4945 Mark Dabling Blvd #20 · Colorado Springs, CO
Flood risk 4/10 · Minor
- FEMA flood zone
- X
- Chance of flooding over 30 yrs
- 0.22%
- Est. flood insurance / yr
- $507 – $1,088
Fire risk 6/10 · Moderate
- Est. fire insurance / yr
- $939 – $1,743
Heat risk 2/10 · Minimal
- Hot days now (above 88°F)
- 7 days/yr
- Hot days in 30 yrs
- 21 days/yr
Wind risk 2/10 · Minimal
- Chance of severe wind over 30 yrs
- —
Air-quality risk 2/10 · Minimal
- Unhealthy air days now
- 0 days/yr
- Unhealthy air days in 30 yrs
- 1 days/yr
Risk factors via First Street. Map © Google.
Why this score? — see what drove the B grade
The composite is a weighted blend of 9 inputs, each scored 0–100. Each bar is that input's sub-score; the figure is the points it added to the 100-point composite (weight × sub-score).
- Cash flow +30.0/30.0
- ARV discount +13.6/15.0
- 1% rule +10.0/10.0
- DSCR +10.0/10.0
- Livability +3.9/5.0
- Schools +2.5/10.0
- Condition / age +2.5/5.0
- Rent growth +2.3/5.0
- Appreciation +0.0/10.0
$58,800
🖨 Deal sheet 📄 Offer letter ✓ Due diligence
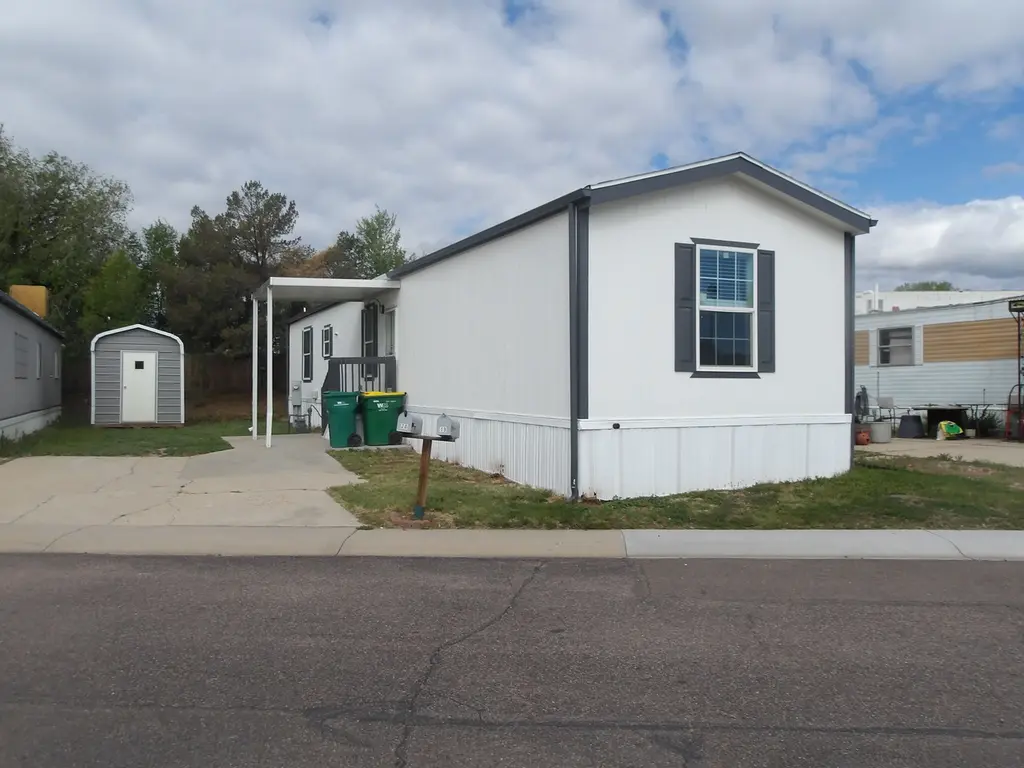
Listing remarks
* THIS IS A RESALE LISTING * This welcoming, well-maintained 3 bedroom, 2 bathroom home is a perfect place to raise your family. For your convenience, we have onsite community management to assist you when you need it. With our family-friendly community amenities such as a playground, a clubhouse, and community events, your family will be excited to live here. This home won't be on the market long, so call us today for more information or to schedule a tour. Deposits & Fees are subject to change.
Key facts
- Built 2026
- Listed 14 days
Property features AI
Finance
- Financial info: List price $58,800
Exterior
- Utilities: Electric service
- Home design: Spec new-construction plan 92282; Active listing
- Construction: Listed in 2026
Interior
- Bedrooms: 3 bedrooms
- Bathrooms: 2 full bathrooms
- Heating & cooling: Electric heating
- Interior features: Living area approximately 840
Neighborhood map
What this means for you Summary
Snapshot
- This is a 3-bed/2.0-bath manufactured listed at $59k.
Deal economics
- At list price, monthly cash flow is $754 ($9k/yr) — positive.
- The deal already cash-flows at list — no discount required.
- Meets the 1% rule at list price ($1k rent vs $59k).
- Cap rate 21.7% vs local median 3.3% in Colorado Springs — top-decile yield for the area; either an underpriced asset or a hidden risk that comps aren't pricing in. Stress-test before assuming the spread holds.
Location & tenants
- Location reads 78/100 on livability (#23 in CO, #2,639 nationally) — a middle-class / working-renter tenant base. Strengths: amenities A+, housing A+, health & safety A+; Watch: cost of living C-, crime F.
- Colorado Springs School District No. 11 In The County Of E (urban): math 20% / reading 37% proficiency, ranked #56 of 86 in CO (top 65%) — low school quality limits family demand, transient renter base, plan for 1-2y turnover.
- Market conditions: Rents soft (-0.6%/yr); 260 active listings in the ZIP; 24 comparable units currently listed for rent nearby; rentals leasing fast (median 3d on market — plan ~1-2 weeks tenant-placement turnaround); solid renter incomes; 3,906 units permitted in El Paso County in 2024 (872 in 5+ unit buildings).
Forward outlook
- Local home prices are declining (-3.0%/yr); year-one equity from $407 of loan paydown is wiped out by about $2k of value loss. Plan a longer hold.
- El Paso County population projected at +28% by 2050 — long-run rental-demand tailwind backs the buy-and-hold thesis.
- At projected returns (-3.0% appreciation + 0.0% rent growth), your $16k cash investment doubles in ~3 years — after that, you're playing with house money.
Negotiation context
- Only 14 days on market — expect competitive offers; lowballing is unlikely to land.
Risks & watch-outs
- Climate carrying-cost: major wildfire risk — expect insurance premiums to compound above CPI over the hold.
Questions for the listing agent
- Is there a deadline driving the sale (1031 exchange, divorce, estate, relocation)? That informs how much negotiation room exists.
- Schools are B-rated — typically a magnet for longer-tenancy family renters. What's the average tenant stay here, and is there a school-zone premium baked into asking?
- Crime grade is F in this area — have there been break-ins, vandalism, or insurance claims at this property in the last 3 years? What carrier currently insures it and at what premium?
- What's the average days-on-market for RENTAL listings here right now (not sales)? A rising rental-DOM trend means longer vacancies and softer asking-rent achievability than the comps imply.
- What's the recent tenant-quality profile in this submarket — average credit score on applications, eviction rate, late-payment / NSF rate, and stable-employment percentage? A property-management company in the area should have these aggregated.
- How much new for-sale + rental construction is in the pipeline within 1–3 miles? Heavy new supply typically softens prices + rents 12–24 months out; constrained supply supports both.
Investment metrics
- 1% rule
- 2.50% ✓
- Cap rate
- 21.69%
- Cash-on-cash
- 54.98%
- DSCR
- 3.45
- GRM
- 3.3
CMA / ARV
- ARV (on-the-fly)
- $68,040
- Comps found
- 2
Show comp detail 2 sales within ~0.75 mi
| Address | Dist | Beds/Ba | Sqft | Sold | Price | $/sf | Match |
|---|---|---|---|---|---|---|---|
| 4945 Mark Dabling Blvd #187 | 0.00mi | 2/1.0 (-1) | 784 (-7%) | 12mo | $52,000 | $66 | 70 |
| 4945 Mark Dabling Blvd #157 | 0.05mi | 3/1.5 | 924 (+10%) | 16mo | $75,000 | $81 | 66 |
Match score weights: distance 35% · size 25% · config 20% · recency 20%. Top-matched comps best support the ARV.
Projected returns pro-forma
-3.0% appreciation · 0.0% rent growth · sell at horizon
- IRR
- 49.8%
- Equity multiple
- 3.08×
- Total profit
- $34,231
- Equity at exit
- $8,767
- IRR
- 54.0%
- Equity multiple
- 5.56×
- Total profit
- $75,121
- Equity at exit
- $5,084
Cash invested: $16,464 (down + closing). Projections, not guarantees.
Landlord ↔ Tenant lean methodology
- Overall (STATE)
- 38 Tenant-Leaning
- State Colorado
- 38 Tenant-Leaning · D+4
- County
- — inherits STATE
- City
- — inherits STATE
ZIP-level market 80918
- Rents YoY
- -0.6%
- Active inventory
- 260
- Price-to-rent
- 3.3×
Monthly cashflow live
- Estimated rent
- $1,469 high interval (Pro) →
- Mortgage (P&I)
- −$308
- Tax est. 1.5%
- −$74 /mo · $882/yr
- Insurance
- −$24
- HOA
- −$0
- Vacancy / Maint / Mgmt
- −$309
- Net cashflow
- $754
Break-even live
UW: 25.0% down · 7.5% · 30yr · 1.5% tax · 5.0% vac · 8.0% maint · 8.0% mgmt
Financing live
Cash to close
- Down payment
- $14,700
- Closing costs
- $1,764
- Reserves months
- —
- Total cash needed
- —
Loan-product check · same deal, 3 products live
Conventional
25% down · 7.5% · 30yr
- Down + closing
- —
- Monthly P&I
- —
- Monthly cashflow
- —
- DSCR
- —
- Eligible?
- —
Personal DTI + credit; lowest rate.
DSCR
20% down · 8.5% · 30yr
- Down + closing
- —
- Monthly P&I
- —
- Monthly cashflow
- —
- DSCR
- —
- Eligible?
- —
No personal income docs; deal must DSCR.
Hard money
10% down · 12.0% · 12mo
- Down + closing
- —
- Monthly P&I
- —
- Monthly cashflow
- —
- DSCR
- —
- Eligible?
- —
Short-term bridge; refi at stabilization.
Rent comps 24 comps
| Address | Beds | Baths | Sqft | Rent | $/sqft | DOM | Units | Dist |
|---|---|---|---|---|---|---|---|---|
| 4760 Rusina Rd Colorado Springs, CO | 1.0–2.0 | 1.0–2.0 | 705 | $1,441 | $2.04 | 3d | 14 | 0.45mi |
| 5400 N Nevada Ave Colorado Springs, CO | 1.0–3.0 | 1.0–2.0 | 875 | $1,475 | $1.69 | 3d | 14 | 0.58mi |
| 309 Redwood Dr Colorado Springs, CO | 3.0 | 1.0 | 829 | $2,000 | $2.41 | 23d | 1 | 0.65mi |
| 4033 Muse Way Colorado Springs, CO | 2.0 | 1.5 | 1121 | $1,500 | $1.34 | 23d | 1 | 0.79mi |
| 325 Cragmor Rd Colorado Springs, CO | 2.0 | 1.0 | 537 | $899 | $1.67 | 3d | 2 | 0.81mi |
| 4012 Muse Way Colorado Springs, CO | 2.0 | 1.5 | 1124 | $1,598 | $1.42 | 23d | 1 | 0.83mi |
| 3850 Schafer Hts Colorado Springs, CO | 1.0–2.0 | 1.0–2.0 | 752 | $1,524 | $2.03 | 3d | 5 | 0.86mi |
| 4311 N Chestnut St Apt 1 Colorado Springs, CO | 2.0 | 1.0 | 850 | $925 | $1.09 | 23d | 1 | 0.87mi |
| 921 Westmoreland Rd Colorado Springs, CO | 1.0–2.0 | 1.0 | 750 | $1,234 | $1.65 | 3d | 12 | 1.05mi |
| 1016 Magnolia St Unit 1018 Colorado Springs, CO | 2.0 | 1.0 | 800 | $1,304 | $1.63 | 23d | 1 | 1.10mi |
| 1035 Magnolia St Colorado Springs, CO | 2.0 | 1.0 | 850 | $1,199 | $1.41 | 23d | 1 | 1.13mi |
| 1035 Magnolia St Unit B Colorado Springs, CO | 2.0 | 1.0 | 850 | $1,145 | $1.35 | 3d | 1 | 1.13mi |
| 1038 Westmoreland Rd Unit A Colorado Springs, CO | 2.0 | 1.0 | 700 | $875 | $1.25 | 14d | 1 | 1.16mi |
| 5824 Walsh Point Dr Colorado Springs, CO | 1.0–3.0 | 1.0–2.0 | 1062 | $2,325 | $2.19 | 2d | 26 | 1.16mi |
| 1075 Magnolia St Apt 1 Colorado Springs, CO | 2.0 | 1.0 | 900 | $795 | $0.88 | 3d | 1 | 1.17mi |
| 1075 Magnolia St Apt 3 Colorado Springs, CO | 2.0 | 1.0 | 900 | $845 | $0.94 | 3d | 1 | 1.17mi |
| 1120 Old Dutch Mill Rd Unit A Colorado Springs, CO | 2.0 | 1.5 | 875 | $1,014 | $1.16 | 23d | 1 | 1.23mi |
| 1120 Old Dutch Mill Rd Colorado Springs, CO | 2.0 | 2.0 | 875 | $1,014 | $1.16 | 3d | 1 | 1.23mi |
| 1134 Westmoreland Rd Colorado Springs, CO | 1.0–2.0 | 1.0 | 675 | $1,050 | $1.56 | 3d | 2 | 1.26mi |
| 1170 Westmoreland Rd Colorado Springs, CO | 2.0 | 1.0 | 900 | $1,250 | $1.39 | 23d | 1 | 1.29mi |
| 260 Rim View Dr Colorado Springs, CO | 1.0–2.0 | 1.0–2.0 | 877 | $1,726 | $1.97 | 2d | 12 | 1.31mi |
| 1318 Holland Park Blvd Unit B Colorado Springs, CO | 2.0 | 1.0 | 954 | $1,300 | $1.36 | 23d | 1 | 1.41mi |
| 980 Holli Springs Ln Colorado Springs, CO | 2.0 | 1.0 | 900 | $1,150 | $1.28 | 23d | 1 | 1.42mi |
| 4015 Stonedike Dr Unit B Colorado Springs, CO | 2.0 | 1.0 | 964 | $1,399 | $1.45 | 3d | 1 | 1.49mi |
Listing history 11 events
-
2026-06-18days on market $58,800 Active 14 DOM
-
2026-06-17days on market $58,800 Active 13 DOM
-
2026-06-16days on market $58,800 Active 12 DOM
-
2026-06-15days on market $58,800 Active 11 DOM
-
2026-06-14days on market $58,800 Active 9 DOM
-
2026-06-10days on market $58,800 Active 6 DOM
-
2026-06-09days on market $58,800 Active 5 DOM
-
2026-06-08days on market $58,800 Active 4 DOM
-
2026-06-07days on market $58,800 Active 3 DOM
-
2026-06-05remarks 506-char remark
-
2026-06-05$58,800 Active 1 DOM
ⓘ Source: listings_history table (triggers on properties + properties_extension) + one-shot
backfill from property_details.listing_events for pre-trigger history.
Climate risk First Street
- Flood 4/10 Moderate FEMA zone X · 22% chance over 30 yrs
- Wildfire 6/10 Major
- Heat 2/10 Low 7 d/yr ≥88°F today · 21 d/yr by 30 yrs out
- Wind 2/10 Low
- Air quality 2/10 Low 0 unhealthy d/yr today · 1 by 30 yrs out
Nearby sold comps map
Loading sold comps map…
Walkable amenities ~0.75 mi
Loading nearby amenities…
Taxation est. · year 1
- Rental income
- $17,630
- − Mortgage interest
- −$3,294
- − Property taxes
- −$882
- − Insurance
- −$294
- − Repairs & maintenance
- −$1,410
- − Management
- −$1,410
- − Depreciation
- −$1,711
- Taxable income
- $8,629
- Est. tax owed @ 24.0%
- −$2,071
- After-tax cash flow
- $6,981/yr
For passive investors: Depreciation is non-cash, so a rental often shows a tax loss while cash-flowing — sheltering income. Rental losses are passive: they offset passive income freely, and up to $25,000/yr can offset ordinary (W-2) income if you actively participate and your MAGI is under $100k (phasing out to $0 by $150k); unused losses carry forward. On sale, claimed depreciation is recaptured at up to 25%, and gains may owe capital-gains tax (a 1031 exchange can defer both). Figures are a year-1 estimate at your 24.0% rate — not tax advice; consult a CPA.
Schools (NCES district)
- District
- Colorado Springs School District No. 11 In The County Of E
- NCES district ID
- 0803060
- Math proficiency
- 20% ▼ -8.00%
- Reading proficiency
- 37% ▼ -4.00%
- Median HH income
- $47,884
- Composite
- 24.69/100
- National rank
- #7613
- State rank
- #56 of 86 in CO
Livability — Colorado Springs
- Score
- 78/100
- State rank
- #23
- US rank
- #2639
Category grades
Schools grade is shown separately in the Schools card above.
Census & demographics
- Census place
- Colorado Springs, CO
- County
- El Paso County · 689,348 people
- City population
- 555,783
- Metro
- Colorado Springs, CO
- Population (ZIP)
- 50,005
- Household income
- $87,685
- Rent vs Own
- Severe rent burden
- 1595.0
Population outlook (El Paso County) Hauer SSP2
- Today (2025)
- 768,926 people
- By 2030
- 815,739 · +6.1%
- By 2040
- 903,489 · +17.5%
- By 2050
- 981,204 · +27.6%
- By 2075
- 1,155,542 · +50.3%
- By 2100
- 1,202,070 · +56.3%
Race, ethnicity, and origin ACS 2023
- Neighborhood character
- Predominantly White (70%)
- Race & ethnicity
- White 70% Hispanic / Latino 16% Two or more races 12% Black 5% Asian 2% Native American 1%
- Hispanic origin (detail)
- Mexican 11%
- Common ancestry
- Lithuanian 3% Slovak 3% Portuguese 2%
- Foreign-born
- 6% · Canada, South Korea
- Languages at home
- 92% English-only · Spanish 5% German/W. Germanic 1% Korean 1%
Political lean MEDSL · El Paso
- 2024 margin
- Lean R (+9.8) · D 43.8% · R 53.5% · Other 2.7%
- 2008→2024 swing
- +9.0pp toward D · 2008: -18.8pp · 2024: -9.8pp
- All cycles
- 2024: R+9.8 2020: R+10.8 2016: R+22.6 2012: R+21.4 2008: R+18.8
Not yet ingested
- Civics
- —
Market trends
- HPI YoY
- ▼ -334.78%
- Current HPI
- 259.6226
- Rent YoY
- ▼ -0.64%
- Metro
- Colorado Springs, CO
- State GDP YoY
- ▲ 1.95%
- F500 in state
- 14
Industry mix (Fortune 500 HQ in CO)
| Industry | F500 HQs | Revenue |
|---|---|---|
| Technology Distribution | 1 | $31B |
|
||
| Food / Agriculture | 1 | $18B |
|
||
| Packaging | 1 | $14B |
|
||
| Healthcare | 1 | $13B |
|
||
| Energy | 1 | $10B |
|
||
| Technology | 1 | $4B |
|
||
Cash-flow waterfall
monthlySold comps — $/sqft
last 12 mo · ≤1 miLoading sold comps…