 🔨 Auction
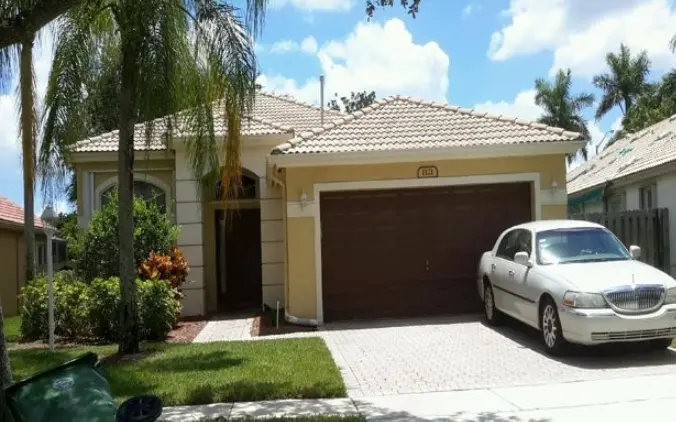
1121 NW 130th Ave · Pembroke Pines, FL
Flood risk 1/10 · Minimal
- FEMA flood zone
- X (unshaded)
- Chance of flooding over 30 yrs
- 0.0%
- Est. flood insurance / yr
- $507 – $1,088
Fire risk 1/10 · Minimal
- Est. fire insurance / yr
- $947 – $1,759
Heat risk 10/10 · Severe
- Hot days now (above 106°F)
- 7 days/yr
- Hot days in 30 yrs
- 26 days/yr
Wind risk 10/10 · Severe
- Chance of severe wind over 30 yrs
- 99.0%
Air-quality risk 2/10 · Minimal
- Unhealthy air days now
- 2 days/yr
- Unhealthy air days in 30 yrs
- 2 days/yr
Risk factors via First Street. Map © Google.
Why this score? — see what drove the F grade
The composite is a weighted blend of 9 inputs, each scored 0–100. Each bar is that input's sub-score; the figure is the points it added to the 100-point composite (weight × sub-score).
- ARV discount +7.5/15.0
- Appreciation +4.8/10.0
- Livability +4.2/5.0
- Schools +4.1/10.0
- Cash flow +3.8/30.0
- Rent growth +2.9/5.0
- Condition / age +2.5/5.0
- 1% rule +0.1/10.0
- DSCR +0.0/10.0
$5,000
🖨 Deal sheet 📄 Offer letter ✓ Due diligence
Listing remarks
Foreclosure Auction Ends May 28, 2026 at 10:00 AM EST. Discover this inviting 4-bedroom, 3-bathroom single-family home, offering a great opportunity in the desirable Pembroke Pines area. The list price is the opening bid for the online auction. Sold As-is. Explore more details and submit your bid through Federa.
Key facts
- 2 garage spots
- Built 1998
- Listed 5 days
Property features AI
Finance
- Other: Lot approximately 0.14 acres; Directions: From I-75, take Pines Blvd west, turn right on NW 130th Ave; property is on the left
Exterior
- Parking: 2-car garage
- Home design: Residential property; 1 story
- Exterior features: Planned Unit Development (PUD)
Interior
- Bathrooms: 3 full bathrooms
- Interior features: Single-story layout
Neighborhood map
What this means for you Summary
Snapshot
- This is a 4-bed/3.0-bath single-family listed at $5k.
Deal economics
- At list price, monthly cash flow is $-2k ($-28k/yr) — negative.
- The deal already cash-flows at list — no discount required.
- Meets the 1% rule at list price ($4k rent vs $5k).
- Cap rate 2.8% vs local median 4.0% in Pembroke Pines — below-typical yield; the buyer is paying a premium for something (appreciation thesis, condition, location) that the cap rate doesn't capture.
Location & tenants
- Location reads 83/100 on livability (#54 in FL, #933 nationally) — a professional / high-income tenant draw. Strengths: housing A+, health & safety A+, schools A-; Watch: amenities D+, cost of living D+.
- Broward (suburban): math 42% / reading 53% proficiency, ranked #46 of 73 in FL (top 63%) — families likely to look elsewhere, expect single-tenant / working-renter base with shorter leases.
- Market conditions: Rents rising (+1.6%/yr); 84 active listings in the ZIP; 40 comparable units currently listed for rent nearby; rentals at typical pace (median 24d on market — plan ~3-4 weeks tenant-placement turnaround); high-income renter base; 2,111 units permitted in Broward County in 2024 (1,265 in 5+ unit buildings).
- This rent runs 42% of the median local income ($119k/yr) — at the standard rent-burdened threshold; future hikes will face affordability resistance.
Forward outlook
- In year one you build about $3k of equity ($6k loan paydown + $-3k appreciation (-0.4% local appreciation)).
- Broward County population projected at +34% by 2050 — long-run rental-demand tailwind backs the buy-and-hold thesis.
- By year 9, paydown + projected appreciation supports a ~$50k cash-out refi (75% LTV) — recoverable capital for the next deal without selling this one.
Negotiation context
- Only 5 days on market — expect competitive offers; lowballing is unlikely to land.
- 2 sale attempts with the ask held roughly flat each time — persistent listings suggest the price (not the market) is what's stuck; bring a comps-based counter.
Risks & watch-outs
- Watch-outs: property tax is 245.9% of price.
- Climate carrying-cost: severe wind risk, 99% chance of damaging wind over 30y; extreme-heat days projected 7→26/yr by 2055 (HVAC capex compounding) — expect insurance premiums to compound above CPI over the hold.
Questions for the listing agent
- What do current leases actually rent for vs. the listed asking? Can we see a recent rent roll and the last 12 months of T-12 income?
- Property tax is high relative to price — has the assessment been appealed recently, and will the sale trigger a re-assessment?
- Is there a deadline driving the sale (1031 exchange, divorce, estate, relocation)? That informs how much negotiation room exists.
- Schools are A-rated — typically a magnet for longer-tenancy family renters. What's the average tenant stay here, and is there a school-zone premium baked into asking?
- The area grade is low — what's the realistic commute time and amenity access for the typical tenant pool here? Any planned neighborhood developments (good or bad) we should know about?
- What's the average days-on-market for RENTAL listings here right now (not sales)? A rising rental-DOM trend means longer vacancies and softer asking-rent achievability than the comps imply.
- What's the recent tenant-quality profile in this submarket — average credit score on applications, eviction rate, late-payment / NSF rate, and stable-employment percentage? A property-management company in the area should have these aggregated.
- How much new for-sale + rental construction is in the pipeline within 1–3 miles? Heavy new supply typically softens prices + rents 12–24 months out; constrained supply supports both.
Investment metrics
- 1% rule
- 0.51% ✗
- Cap rate
- 2.82%
- Cash-on-cash
- -12.39%
- DSCR
- 0.45
- GRM
- 16.4
CMA / ARV
- ARV (on-the-fly)
- $819,826
- Comps found
- 2
Show comp detail 2 sales within ~0.75 mi
| Address | Dist | Beds/Ba | Sqft | Sold | Price | $/sf | Match |
|---|---|---|---|---|---|---|---|
| 13455 NW 12th St | 0.34mi | 3/2.0 (-1) | 1,984 (+5%) | 14mo | $722,000 | $364 | 55 |
| 1561 NW 132nd Ave | 0.47mi | 3/2.0 (-1) | 1,678 (-11%) | 22mo | $729,000 | $434 | 32 |
Match score weights: distance 35% · size 25% · config 20% · recency 20%. Top-matched comps best support the ARV.
Projected returns pro-forma
-0.37% appreciation · 1.65% rent growth · sell at horizon
- IRR
- -19.1%
- Equity multiple
- 0.15×
- Total profit
- $-194,762
- Equity at exit
- $222,888
- IRR
- -13.4%
- Equity multiple
- -0.28×
- Total profit
- $-294,377
- Equity at exit
- $256,103
Cash invested: $229,551 (down + closing). Projections, not guarantees.
Landlord ↔ Tenant lean methodology
- Overall (STATE)
- 87 Strongly Landlord-Friendly
- State Florida
- 87 Strongly Landlord-Friendly · R+3
- County
- — inherits STATE
- City
- — inherits STATE
ZIP-level market 33028
- Home prices YoY
- -0.1%
- Rents YoY
- 1.6%
- Active inventory
- 84
- Price-to-rent
- 0.1×
Monthly cashflow live
- Estimated rent
- $4,171 high interval (Pro) →
- Mortgage (P&I)
- −$4,299
- Tax est. 1.5%
- −$1,025 /mo · $12,297/yr
- Insurance
- −$342
- HOA
- −$0
- Vacancy / Maint / Mgmt
- −$876
- Net cashflow
- $-2,371
Break-even live
UW: 25.0% down · 7.5% · 30yr · 1.5% tax · 5.0% vac · 8.0% maint · 8.0% mgmt
Financing live
Cash to close
- Down payment
- $204,956
- Closing costs
- $24,595
- Reserves months
- —
- Total cash needed
- —
Loan-product check · same deal, 3 products live
Conventional
25% down · 7.5% · 30yr
- Down + closing
- —
- Monthly P&I
- —
- Monthly cashflow
- —
- DSCR
- —
- Eligible?
- —
Personal DTI + credit; lowest rate.
DSCR
20% down · 8.5% · 30yr
- Down + closing
- —
- Monthly P&I
- —
- Monthly cashflow
- —
- DSCR
- —
- Eligible?
- —
No personal income docs; deal must DSCR.
Hard money
10% down · 12.0% · 12mo
- Down + closing
- —
- Monthly P&I
- —
- Monthly cashflow
- —
- DSCR
- —
- Eligible?
- —
Short-term bridge; refi at stabilization.
Rent comps 40 comps
| Address | Beds | Baths | Sqft | Rent | $/sqft | DOM | Units | Dist |
|---|---|---|---|---|---|---|---|---|
| 1151 NW 130th Ave Pembroke Pines, FL | 3.0 | 2.0 | 1729 | $4,500 | $2.60 | 24d | 1 | 0.01mi |
| 13231 NW 12th St Pembroke Pines, FL | 3.0 | 2.5 | 1889 | $4,200 | $2.22 | 12d | 1 | 0.21mi |
| 801 NW 134th Ave Pembroke Pines, FL | 3.0 | 3.0 | 1701 | $3,450 | $2.03 | 24d | 1 | 0.29mi |
| 250 NW 130th Ave Pembroke Pines, FL | 1.0–3.0 | 1.0–2.0 | 1123 | $2,964 | $2.64 | 3d | 16 | 0.41mi |
| 13401 NW 5th St Pembroke Pines, FL | 1.0–3.0 | 1.0–2.5 | 1126 | $3,165 | $2.81 | 1d | 13 | 0.48mi |
| 13651 NW 4th St Pembroke Pines, FL | 1.0–3.0 | 1.5–3.0 | 1187 | $3,983 | $3.35 | 2d | 15 | 0.50mi |
| 13176 NW 18th St Unit Na Pembroke Pines, FL | 3.0 | 2.5 | 2300 | $3,900 | $1.70 | 3d | 1 | 0.64mi |
| 13180 NW 19th St Pembroke Pines, FL | 4.0 | 3.0 | 2142 | $4,300 | $2.01 | 24d | 1 | 0.74mi |
| 1425 NW 124th Ave Unit 1425 Pembroke Pines, FL | 3.0 | 2.5 | 1550 | $3,600 | $2.32 | 24d | 1 | 0.85mi |
| 12264 NW 11th St #12264 Pembroke Pines, FL | 3.0 | 2.0 | 1511 | $3,000 | $1.99 | 24d | 1 | 0.86mi |
| 12266 NW 10th St Pembroke Pines, FL | 3.0 | 2.0 | 1432 | $2,999 | $2.09 | 24d | 1 | 0.87mi |
| 12432 NW 18th Ct Pembroke Pines, FL | 3.0 | 2.5 | 1932 | $3,550 | $1.84 | 24d | 1 | 0.93mi |
| 2051 NW 125th Ter Pembroke Pines, FL | 4.0 | 3.0 | 2598 | $5,800 | $2.23 | 24d | 1 | 0.94mi |
| 1441 NW 122nd Ter Pembroke Pines, FL | 3.0 | 3.0 | 1802 | $3,300 | $1.83 | 24d | 1 | 0.96mi |
| 1381 NW 144th Ave Pembroke Pines, FL | 4.0 | 2.5 | 2339 | $5,500 | $2.35 | 18d | 1 | 0.99mi |
| 1381 NW 144th Ave Pembroke Pines, FL | 4.0 | 2.5 | 2339 | $5,500 | $2.35 | 5d | 1 | 0.99mi |
| 1381 NW 144th Ave Pembroke Pines, FL | 4.0 | 2.5 | 2339 | $5,500 | $2.35 | 24d | 1 | 0.99mi |
| 14300 NW 16th St Pembroke Pines, FL | 4.0 | 3.0 | 2598 | $5,350 | $2.06 | 24d | 1 | 1.04mi |
| 500 SW 145th Ave Pembroke Pines, FL | 1.0–3.0 | 1.0–2.0 | 1044 | $3,637 | $3.48 | 1d | 21 | 1.05mi |
| 14365 NW 15th St Pembroke Pines, FL | 3.0 | 2.5 | 1889 | $4,300 | $2.28 | 24d | 1 | 1.06mi |
| 814 SW 143rd Ter #208 Pembroke Pines, FL | 3.0 | 2.5 | 1613 | $2,750 | $1.70 | 24d | 1 | 1.14mi |
| 11761 NW 12th St Pembroke Pines, FL | 3.0 | 2.0 | 1304 | $3,799 | $2.91 | 24d | 1 | 1.14mi |
| 11838 NW 13th St Pembroke Pines, FL | 3.0 | 2.0 | 1304 | $3,650 | $2.80 | 5d | 1 | 1.17mi |
| 943 SW 143rd Ter #2109 Pembroke Pines, FL | 3.0 | 2.5 | 1390 | $3,050 | $2.19 | 20d | 1 | 1.18mi |
| 12148 SW 4th St #12148 Pembroke Pines, FL | 3.0 | 2.5 | 1428 | $3,200 | $2.24 | 5d | 1 | 1.19mi |
| 962 SW 143rd Ave #2207 Pembroke Pines, FL | 3.0 | 2.5 | 1390 | $3,000 | $2.16 | 24d | 1 | 1.21mi |
| 962 SW 143rd Ave #2207 Pembroke Pines, FL | 3.0 | 2.5 | 1390 | $3,000 | $2.16 | 7d | 1 | 1.21mi |
| 11804 NW 13th St Unit 11804 Pembroke Pines, FL | 3.0 | 2.0 | 1304 | $3,500 | $2.68 | 3d | 1 | 1.24mi |
| 11705 NW 12th St Pembroke Pines, FL | 3.0 | 2.5 | 1494 | $3,600 | $2.41 | 24d | 1 | 1.24mi |
| 1009 SW 144th Ave #2701 Pembroke Pines, FL | 3.0 | 2.5 | 1396 | $2,850 | $2.04 | 24d | 1 | 1.25mi |
| 1062 SW 143rd Ave Pembroke Pines, FL | 3.0 | 2.5 | 1425 | $3,000 | $2.11 | 24d | 1 | 1.27mi |
| 1064 SW 144th Ave #807 Pembroke Pines, FL | 3.0 | 2.5 | 1613 | $2,950 | $1.83 | 24d | 1 | 1.29mi |
| 251 NW 151st Ave Pembroke Pines, FL | 3.0 | 2.5 | 1778 | $3,700 | $2.08 | 4d | 1 | 1.30mi |
| 14228 NW 19th St Pembroke Pines, FL | 4.0 | 3.0 | 2102 | $4,300 | $2.05 | 24d | 1 | 1.30mi |
| 1088 SW 144th Ave #801 Pembroke Pines, FL | 3.0 | 2.5 | 1613 | $3,100 | $1.92 | 24d | 1 | 1.31mi |
| 11700 SW 1st St #3207 Pembroke Pines, FL | 3.0 | 2.0 | 1330 | $3,000 | $2.26 | 18d | 1 | 1.31mi |
| 1421 NW 114th Ave Pembroke Pines, FL | 4.0 | 2.0 | 1893 | $4,390 | $2.32 | 17d | 1 | 1.32mi |
| 14272 NW 18th Ct Pembroke Pines, FL | 4.0 | 3.0 | 2102 | $4,950 | $2.35 | 2d | 1 | 1.32mi |
| 230 SW 117th Ter #202 Pembroke Pines, FL | 3.0 | 2.0 | 1330 | $3,200 | $2.41 | 24d | 1 | 1.34mi |
| 230 SW 117th Ter #11208 Pembroke Pines, FL | 3.0 | 2.0 | 1998 | $2,800 | $1.40 | 24d | 1 | 1.34mi |
Listing history 2 events
-
2026-05-21$5,000 Active
-
2026-01-07$5,000 Active
ⓘ Source: listings_history table (triggers on properties + properties_extension) + one-shot
backfill from property_details.listing_events for pre-trigger history.
Climate risk First Street
- Flood 1/10 Low FEMA zone X (unshaded) · 0% chance over 30 yrs
- Wildfire 1/10 Low
- Heat 10/10 Extreme 7 d/yr ≥106°F today · 26 d/yr by 30 yrs out
- Wind 10/10 Extreme 99% chance of damaging wind over 30 yrs
- Air quality 2/10 Low 2 unhealthy d/yr today · 2 by 30 yrs out
Nearby sold comps map
Loading sold comps map…
Walkable amenities ~0.75 mi
Loading nearby amenities…
Taxation est. · year 1
- Rental income
- $50,048
- − Mortgage interest
- −$45,923
- − Property taxes
- −$12,297
- − Insurance
- −$4,099
- − Repairs & maintenance
- −$4,004
- − Management
- −$4,004
- − Depreciation
- −$23,849
- Taxable loss
- −$44,129
- Est. tax savings @ 24.0%
- +$10,591
- After-tax cash flow
- $-17,859/yr
For passive investors: Depreciation is non-cash, so a rental often shows a tax loss while cash-flowing — sheltering income. Rental losses are passive: they offset passive income freely, and up to $25,000/yr can offset ordinary (W-2) income if you actively participate and your MAGI is under $100k (phasing out to $0 by $150k); unused losses carry forward. On sale, claimed depreciation is recaptured at up to 25%, and gains may owe capital-gains tax (a 1031 exchange can defer both). Figures are a year-1 estimate at your 24.0% rate — not tax advice; consult a CPA.
Schools (NCES district)
- District
- Broward
- NCES district ID
- 1200180
- Math proficiency
- 42% ▼ -18.00%
- Reading proficiency
- 53% ▼ -5.00%
- Median HH income
- $52,139
- Composite
- 40.88/100
- National rank
- #3621
- State rank
- #46 of 73 in FL
Livability — Pembroke Pines
- Score
- 83/100
- State rank
- #54
- US rank
- #933
Category grades
Schools grade is shown separately in the Schools card above.
Census & demographics
- Census place
- Pembroke Pines, FL
- County
- Broward County · 1,963,430 people
- City population
- 180,224
- Metro
- Miami-Fort Lauderdale-Pompano Beach, FL
- Population (ZIP)
- 28,397
- Household income
- $119,091
- Rent vs Own
- Severe rent burden
- 755.0
Population outlook (Broward County) Hauer SSP2
- Today (2025)
- 2,207,033 people
- By 2030
- 2,360,704 · +7.0%
- By 2040
- 2,661,208 · +20.6%
- By 2050
- 2,946,698 · +33.5%
- By 2075
- 3,602,273 · +63.2%
- By 2100
- 3,970,984 · +79.9%
Race, ethnicity, and origin ACS 2023
- Neighborhood character
- Highly diverse neighborhood (Simpson 0.71)
- Race & ethnicity
- Hispanic / Latino 45% Two or more races 24% White 23% Black 16% Asian 9%
- Hispanic origin (detail)
- Mexican 2% Puerto Rican 7% Cuban 11%
- Common ancestry
- Hispanic 2% Romanian 1% Portuguese 1%
- Foreign-born
- 39% · Canada, Jamaica, South Korea
- Languages at home
- 47% English-only · Spanish 40% Other Indo-European 4% French/Haitian/Cajun 2%
Political lean MEDSL · Broward
- 2024 margin
- D (+17.0) · D 58.0% · R 41.0%
- 2008→2024 swing
- -17.8pp toward R · 2008: 34.7pp · 2024: 17.0pp
- All cycles
- 2024: D+17.0 2020: D+29.8 2016: D+35.0 2012: D+34.9 2008: D+34.7
Not yet ingested
- Civics
- —
Market trends
- HPI YoY
- ▼ -0.37%
- Current HPI
- 366.7628
- Rent YoY
- ▲ 1.65%
- Metro
- Miami-Fort Lauderdale-Pompano Beach, FL
- State GDP YoY
- ▲ 3.28%
- F500 in state
- 36
Industry mix (Fortune 500 HQ in FL)
| Industry | F500 HQs | Revenue |
|---|---|---|
| Industrial Technology | 2 | $29B |
|
||
| Insurance | 2 | $17B |
|
||
| Retail | 1 | $60B |
|
||
| Technology Distribution | 1 | $58B |
|
||
| Homebuilding | 1 | $35B |
|
||
| Technology Manufacturing | 1 | $35B |
|
||
Price history
+0.0% since first listed2 events — show timeline
- 2026-05-21 Listed $5,000 NFMLS
- 2026-01-07 Listed $5,000 NFMLS
Property tax history
+2.0%/yrLatest (2025): $4,400 · +2.8% YoY. Source: county tax records.
Cash-flow waterfall
monthlySold comps — $/sqft
last 12 mo · ≤1 miLoading sold comps…