9226 Rochelle Dr · Indianapolis city (balance), IN
Flood risk 1/10 · Minimal
- FEMA flood zone
- X (unshaded)
- Chance of flooding over 30 yrs
- 0.0%
- Est. flood insurance / yr
- $507 – $1,088
Fire risk 1/10 · Minimal
- Est. fire insurance / yr
- $717 – $1,331
Heat risk 3/10 · Minor
- Hot days now (above 101°F)
- 7 days/yr
- Hot days in 30 yrs
- 18 days/yr
Wind risk 2/10 · Minimal
- Chance of severe wind over 30 yrs
- 1.0%
Air-quality risk 3/10 · Minor
- Unhealthy air days now
- 3 days/yr
- Unhealthy air days in 30 yrs
- 4 days/yr
Risk factors via First Street. Map © Google.
Why this score? — see what drove the C- grade
The composite is a weighted blend of 9 inputs, each scored 0–100. Each bar is that input's sub-score; the figure is the points it added to the 100-point composite (weight × sub-score).
- Cash flow +20.9/30.0
- ARV discount +9.0/15.0
- DSCR +6.7/10.0
- 1% rule +5.6/10.0
- Rent growth +3.1/5.0
- Livability +2.5/5.0
- Condition / age +2.5/5.0
- Schools +1.4/10.0
- Appreciation +0.0/10.0
$154,900
🖨 Deal sheet 📄 Offer letter ✓ Due diligence
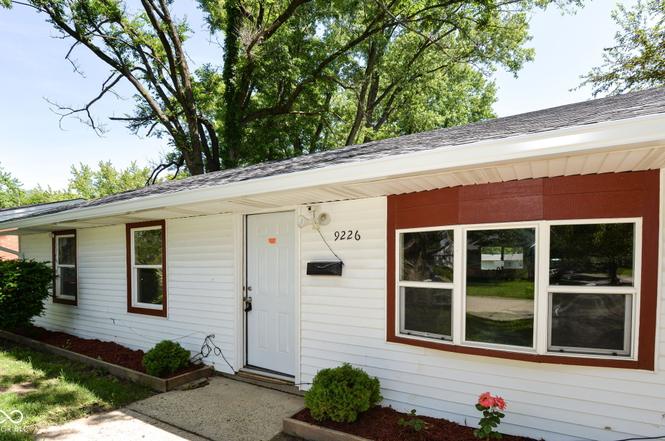
Listing remarks
Welcome home to this inviting ranch-style residence located in a quiet community. Built in 1963, this 1323 square foot single family home is ready for you to move in and begin your next chapter. The home offers four thoughtfully designed bedrooms, providing ample personal space for everyone. Experience convenience and comfort with three full bathrooms, including one featuring a walk-in shower for a spa-like retreat. Beyond the interiors, a private yard awaits, offering a serene outdoor extension for relaxation or entertaining. The dedicated laundry room adds to the home's practical appeal, ensuring everyday tasks are handled with ease. Close to schools, shopping, I-465 & I-70, and eve
Key facts
- Private yard
- Quiet community
- 9,104 sq ft lot
Tags
Property features AI
Exterior
- Parking: Guest street parking
- Utilities: Public water; Municipal sewer connected; Cable available
- Home design: Single-family residence; Updated/remodeled; One story
- Construction: Vinyl siding; Slab foundation
- Exterior features: Storage shed; Privacy fence (full, complete); Sidewalks
Interior
- Kitchen: Dishwasher; Microwave; Gas oven
- Bedrooms: 4 bedrooms on the main level (sizes: 13x13, 11x11, 13x12, 13x12)
- Flooring: Luxury vinyl plank throughout main living areas
- Bathrooms: 3 full bathrooms (all on the main level)
- Heating & cooling: Forced air heating (natural gas); Central air conditioning
- Interior features: Attic access; Has a view
- Laundry & utility: Dedicated laundry room
Neighborhood map
What this means for you Summary
Snapshot
- This is a 3-bed/3.0-bath single-family listed at $155k.
Deal economics
- At list price, monthly cash flow is $217 ($3k/yr) — positive.
- The deal already cash-flows at list — no discount required.
- Meets the 1% rule at list price ($2k rent vs $155k).
- Cap rate 8.0% vs local median 4.4% in Indianapolis city (balance) — top-decile yield for the area; either an underpriced asset or a hidden risk that comps aren't pricing in. Stress-test before assuming the spread holds.
Location & tenants
- Location reads: area grade C — affects rentability + tenant quality, not the cash-flow math above.
- Indianapolis Public Schools (urban): math 14% / reading 20% proficiency, ranked #286 of 301 in IN (top 95%) — low school quality limits family demand, transient renter base, plan for 1-2y turnover; 77% free/reduced lunch — lower-income household profile, screen leases tightly.
- Zoned schools: Charles Warren Fairbanks Sch 105 (math 2% / reading 8%, grade F, #970 of 994 statewide, top 99%, 313 students, 78% FRL); Arsenal Technical High School (math 6% / reading 27%, grade F, #353 of 369 statewide, top 96%, 2,366 students, 74% FRL) — zoned schools at 76% FRL track the district average.
- Market conditions: Rents rising (+2.6%/yr); 54 active listings in the ZIP; 37 comparable units currently listed for rent nearby; rentals at typical pace (median 22d on market — plan ~3-4 weeks tenant-placement turnaround); 1,906 units permitted in Marion County in 2024 (621 in 5+ unit buildings).
- This rent runs 33% of the median local income ($59k/yr) — at the standard rent-burdened threshold; future hikes will face affordability resistance.
Forward outlook
- Local home prices are declining (-3.0%/yr); year-one equity from $1k of loan paydown is wiped out by about $5k of value loss. Plan a longer hold.
- Marion County population projected at +18% by 2050 — long-run rental-demand tailwind backs the buy-and-hold thesis.
Negotiation context
- Only 7 days on market — expect competitive offers; lowballing is unlikely to land.
- 14 sale attempts since 26y ago with the ask held roughly flat each time — persistent listings suggest the price (not the market) is what's stuck; bring a comps-based counter.
- Current owner paid $26k; list at $155k implies a 498% gain — meaningful room to come down on a strong offer.
Questions for the listing agent
- Built in 1963 — when were the roof, HVAC, electrical panel, plumbing, and water heater last replaced?
- Is there a deadline driving the sale (1031 exchange, divorce, estate, relocation)? That informs how much negotiation room exists.
- What's the average days-on-market for RENTAL listings here right now (not sales)? A rising rental-DOM trend means longer vacancies and softer asking-rent achievability than the comps imply.
- What's the recent tenant-quality profile in this submarket — average credit score on applications, eviction rate, late-payment / NSF rate, and stable-employment percentage? A property-management company in the area should have these aggregated.
- How much new for-sale + rental construction is in the pipeline within 1–3 miles? Heavy new supply typically softens prices + rents 12–24 months out; constrained supply supports both.
Investment metrics
- 1% rule
- 1.06% ✓
- Cap rate
- 7.97%
- Cash-on-cash
- 6.00%
- DSCR
- 1.27
- GRM
- 7.9
CMA / ARV
- ARV (on-the-fly)
- $160,083
- Comps found
- 12
Show comp detail 12 sales within ~0.75 mi
| Address | Dist | Beds/Ba | Sqft | Sold | Price | $/sf | Match |
|---|---|---|---|---|---|---|---|
| 3444 Hermosa Ct | 0.03mi | 3/1.5 | 1,262 (-5%) | 3mo | $145,000 | $115 | 83 |
| 9048 E 36th St | 0.26mi | 3/1.0 | 1,311 (-1%) | 8mo | $130,000 | $99 | 72 |
| 3720 Breen Dr | 0.35mi | 3/1.5 | 1,311 (-1%) | 12mo | $147,000 | $112 | 66 |
| 3405 N Brentwood Ave | 0.24mi | 3/1.5 | 1,253 (-5%) | 10mo | $160,000 | $128 | 66 |
| 3601 Luewan Dr | 0.43mi | 3/2.0 | 1,284 (-3%) | 7mo | $110,000 | $86 | 65 |
| 3425 Ireland Dr | 0.07mi | 3/1.5 | 1,457 (+10%) | 11mo | $177,000 | $121 | 65 |
| 3655 N Wittfield St | 0.28mi | 3/1.0 | 1,213 (-8%) | 9mo | $150,261 | $124 | 58 |
| 9036 E 36th St | 0.28mi | 4/2.0 (+1) | 1,458 (+10%) | 6mo | $210,000 | $144 | 56 |
| 3642 Horth Ct | 0.27mi | 3/1.0 | 1,193 (-10%) | 12mo | $210,000 | $176 | 53 |
| 9819 Bishop Ct | 0.72mi | 4/2.0 (+1) | 1,225 (-7%) | 1mo | $136,500 | $111 | 44 |
| 3817 Strathmore Dr | 0.72mi | 3/1.0 | 1,236 (-7%) | 11mo | $150,000 | $121 | 38 |
| 3814 Strathmore Dr | 0.68mi | 4/1.0 (+1) | 1,225 (-7%) | 9mo | $185,000 | $151 | 36 |
Match score weights: distance 35% · size 25% · config 20% · recency 20%. Top-matched comps best support the ARV.
Projected returns pro-forma
-3.0% appreciation · 2.56% rent growth · sell at horizon
- IRR
- -7.5%
- Equity multiple
- 0.72×
- Total profit
- $-11,989
- Equity at exit
- $23,096
- IRR
- 1.5%
- Equity multiple
- 1.10×
- Total profit
- $4,517
- Equity at exit
- $13,393
Cash invested: $43,372 (down + closing). Projections, not guarantees.
Landlord ↔ Tenant lean methodology
- Overall (STATE)
- 90 Strongly Landlord-Friendly
- State Indiana
- 90 Strongly Landlord-Friendly · R+11
- County
- — inherits STATE
- City
- — inherits STATE
ZIP-level market 46235
- Home prices YoY
- -4.3%
- Rents YoY
- 2.6%
- Active inventory
- 54
- Price-to-rent
- 7.9×
Monthly cashflow live
- Estimated rent
- $1,642 high interval (Pro) →
- Mortgage (P&I)
- −$812
- Tax from tax record
- −$204 /mo · $2,444/yr
- Insurance
- −$65
- HOA
- −$0
- Vacancy / Maint / Mgmt
- −$345
- Net cashflow
- $217
Break-even live
UW: 25.0% down · 7.5% · 30yr · 1.5% tax · 5.0% vac · 8.0% maint · 8.0% mgmt
Financing live
Cash to close
- Down payment
- $38,725
- Closing costs
- $4,647
- Reserves months
- —
- Total cash needed
- —
Loan-product check · same deal, 3 products live
Conventional
25% down · 7.5% · 30yr
- Down + closing
- —
- Monthly P&I
- —
- Monthly cashflow
- —
- DSCR
- —
- Eligible?
- —
Personal DTI + credit; lowest rate.
DSCR
20% down · 8.5% · 30yr
- Down + closing
- —
- Monthly P&I
- —
- Monthly cashflow
- —
- DSCR
- —
- Eligible?
- —
No personal income docs; deal must DSCR.
Hard money
10% down · 12.0% · 12mo
- Down + closing
- —
- Monthly P&I
- —
- Monthly cashflow
- —
- DSCR
- —
- Eligible?
- —
Short-term bridge; refi at stabilization.
Rent comps 37 comps
| Address | Beds | Baths | Sqft | Rent | $/sqft | DOM | Units | Dist |
|---|---|---|---|---|---|---|---|---|
| 3525 Luewan Ct Indianapolis, IN | 4.0 | 1.0 | 1107 | $1,750 | $1.58 | 24d | 1 | 0.12mi |
| 9226 E 36th Pl Indianapolis, IN | 3.0 | 1.0 | 1073 | $1,250 | $1.16 | 8d | 1 | 0.16mi |
| 3519 Jerome Ct Indianapolis, IN | 4.0 | 1.0 | 1107 | $1,995 | $1.80 | 24d | 1 | 0.17mi |
| 3644 Celtic Dr Indianapolis, IN | 4.0 | 1.5 | 1637 | $1,500 | $0.92 | 15d | 1 | 0.23mi |
| 3722 Ireland Dr Indianapolis, IN | 3.0 | 2.0 | 1682 | $1,700 | $1.01 | 44d | 1 | 0.33mi |
| 3747 Ireland Dr Indianapolis, IN | 4.0 | 1.5 | 1400 | $1,700 | $1.21 | 24d | 1 | 0.39mi |
| 3631 Decamp Dr Indianapolis, IN | 3.0 | 1.0 | 1000 | $1,335 | $1.33 | 24d | 1 | 0.49mi |
| 3540 Dubarry Ct Indianapolis, IN | 3.0 | 2.0 | 1297 | $1,400 | $1.08 | 24d | 1 | 0.49mi |
| 3809 Biscayne Rd Indianapolis, IN | 2.0 | 1.5 | 992 | $1,020 | $1.03 | 15d | 1 | 0.67mi |
| 3815 Biscayne Rd Indianapolis, IN | 3.0 | 1.5 | 1188 | $1,220 | $1.03 | 15d | 1 | 0.68mi |
| 9060 E 39th Pl Indianapolis, IN | 1.0–2.0 | 1.0–1.5 | 820 | $1,040 | $1.27 | 24d | 1 | 0.68mi |
| 3821 Biscayne Rd Indianapolis, IN | 4.0 | 1.5 | 1188 | $1,325 | $1.12 | 15d | 1 | 0.69mi |
| 3823 Biscayne Rd Indianapolis, IN | 4.0 | 1.5 | 1188 | $1,320 | $1.11 | 15d | 1 | 0.70mi |
| 9513 Baker Ct Indianapolis, IN | 4.0 | 2.0 | 1702 | $1,825 | $1.07 | 8d | 1 | 0.70mi |
| 3829 Biscayne Rd Indianapolis, IN | 4.0 | 1.5 | 1188 | $1,320 | $1.11 | 15d | 1 | 0.70mi |
| 8862 Bel Air Ct Indianapolis, IN | 3.0 | 1.0 | 1073 | $1,264 | $1.18 | 18d | 1 | 0.74mi |
| 9438 Conried Dr Indianapolis, IN | 3.0 | 1.0 | 1094 | $1,445 | $1.32 | 4d | 1 | 0.80mi |
| 3938 Biscayne Rd Indianapolis, IN | 3.0 | 1.0 | 1000 | $1,895 | $1.90 | 3d | 1 | 0.80mi |
| 8914 Elmonte Dr Indianapolis, IN | 3.0 | 1.5 | 1500 | $1,600 | $1.07 | 24d | 1 | 0.82mi |
| 9962 Catalina Dr Indianapolis, IN | 3.0 | 1.0 | 1236 | $1,600 | $1.29 | 4d | 1 | 0.83mi |
| 3962 Strathmore Dr Indianapolis, IN | 3.0 | 1.0 | 925 | $1,250 | $1.35 | 24d | 1 | 0.86mi |
| 8738 Montery Rd Indianapolis, IN | 3.0 | 1.0 | 1421 | $1,396 | $0.98 | 8d | 1 | 0.90mi |
| 8724 Montery Rd Indianapolis, IN | 3.0 | 1.0 | 925 | $1,500 | $1.62 | 44d | 1 | 0.91mi |
| 9949 Ellis Dr Indianapolis, IN | 4.0 | 2.0 | 1421 | $1,580 | $1.11 | 3d | 1 | 1.04mi |
| 8203 Penway St Indianapolis, IN | 3.0 | 1.5 | 1360 | $1,500 | $1.10 | 24d | 1 | 1.05mi |
| 3645 Wingate Ct Indianapolis, IN | 3.0 | 1.0–2.0 | 774 | $1,500 | $1.94 | 24d | 6 | 1.21mi |
| 9634 Meadowlark Dr Indianapolis, IN | 3.0 | 1.5 | 1546 | $1,550 | $1.00 | 16d | 1 | 1.21mi |
| 3513 Roseway Dr Indianapolis, IN | 3.0 | 2.0 | 1216 | $1,600 | $1.32 | 18d | 1 | 1.25mi |
| 7937 E 34th St Indianapolis, IN | 4.0 | 1.0 | 1450 | $2,000 | $1.38 | 24d | 1 | 1.26mi |
| 8501 Athens Ct Indianapolis, IN | 4.0 | 1.0 | 1225 | $1,475 | $1.20 | 15d | 1 | 1.27mi |
| 4315 Aspen Way Indianapolis, IN | 3.0 | 1.0 | 1080 | $1,380 | $1.28 | 44d | 1 | 1.35mi |
| 7838 Ridgewood Dr Indianapolis, IN | 3.0 | 2.0 | 936 | $1,540 | $1.65 | 44d | 1 | 1.36mi |
| 7838 Ridgewood Dr Indianapolis, IN | 3.0 | 2.0 | 936 | $1,540 | $1.65 | 24d | 1 | 1.36mi |
| 7925 Crossbridge Dr Indianapolis, IN | 2.0 | 2.0 | 1072 | $1,200 | $1.12 | 44d | 1 | 1.40mi |
| 3226 Wellington Ave Indianapolis, IN | 3.0 | 1.0 | 900 | $1,149 | $1.28 | 11d | 1 | 1.43mi |
| 8254 Meadowlark Dr Unit 1 Indianapolis, IN | 3.0 | 1.5 | 1320 | $1,150 | $0.87 | 44d | 1 | 1.47mi |
| 8254 Meadowlark Dr Indianapolis, IN | 3.0 | 1.5 | 1320 | $1,150 | $0.87 | 22d | 1 | 1.47mi |
Listing history 7 events
-
2026-06-18days on market $154,900 Active 7 DOM
-
2026-06-17days on market $154,900 Active 6 DOM
-
2026-06-16days on market $154,900 Active 5 DOM
-
2026-06-15days on market $154,900 Active 4 DOM
-
2026-06-13days on market $154,900 Active 2 DOM
-
2026-06-13remarks 695-char remark
-
2026-06-13$154,900 Active 1 DOM
ⓘ Source: listings_history table (triggers on properties + properties_extension) + one-shot
backfill from property_details.listing_events for pre-trigger history.
Tax reassessment forecast IN · Partial reset (capped growth)
- Current annual tax
- $2,444 · $204/mo
- Projected year-2 tax
- $2,444 · $204/mo
- Expected delta
- $0/yr ($0/mo · 0.0%)
ⓘ Screening estimate from a state-policy table — verify with the county assessor before closing.
Climate risk First Street
- Flood 1/10 Low FEMA zone X (unshaded) · 0% chance over 30 yrs
- Wildfire 1/10 Low
- Heat 3/10 Moderate 7 d/yr ≥101°F today · 18 d/yr by 30 yrs out
- Wind 2/10 Low 100% chance of damaging wind over 30 yrs
- Air quality 3/10 Moderate 3 unhealthy d/yr today · 4 by 30 yrs out
Nearby sold comps map
Loading sold comps map…
Walkable amenities ~0.75 mi
Loading nearby amenities…
Taxation est. · year 1
- Rental income
- $19,706
- − Mortgage interest
- −$8,677
- − Property taxes
- −$2,444
- − Insurance
- −$774
- − Repairs & maintenance
- −$1,576
- − Management
- −$1,576
- − Depreciation
- −$4,506
- Taxable income
- $151
- Est. tax owed @ 24.0%
- −$36
- After-tax cash flow
- $2,565/yr
For passive investors: Depreciation is non-cash, so a rental often shows a tax loss while cash-flowing — sheltering income. Rental losses are passive: they offset passive income freely, and up to $25,000/yr can offset ordinary (W-2) income if you actively participate and your MAGI is under $100k (phasing out to $0 by $150k); unused losses carry forward. On sale, claimed depreciation is recaptured at up to 25%, and gains may owe capital-gains tax (a 1031 exchange can defer both). Figures are a year-1 estimate at your 24.0% rate — not tax advice; consult a CPA.
Schools (NCES district)
- District
- Indianapolis Public Schools
- NCES district ID
- 1804770
- Math proficiency
- 14% ▼ -7.00%
- Reading proficiency
- 20% ▼ -3.00%
- Median HH income
- $32,034
- Composite
- 13.69/100
- National rank
- #9499
- State rank
- #286 of 301 in IN
Livability — Indianapolis city (balance)
No livability data for this city. (Only ~50 U.S. cities are tracked.)
Census & demographics
- Census place
- Indianapolis city (balance), IN
- County
- Marion County · 998,460 people
- City population
- 881,119
- Metro
- Indianapolis-Carmel-Anderson, IN
- Population (ZIP)
- 36,317
- Household income
- $58,951
- Rent vs Own
- Severe rent burden
- 1901.0
Population outlook (Marion County) Hauer SSP2
- Today (2025)
- 1,025,572 people
- By 2030
- 1,065,727 · +3.9%
- By 2040
- 1,141,577 · +11.3%
- By 2050
- 1,208,920 · +17.9%
- By 2075
- 1,367,288 · +33.3%
- By 2100
- 1,438,201 · +40.2%
Race, ethnicity, and origin ACS 2023
- Neighborhood character
- Diverse neighborhood (Simpson 0.62)
- Race & ethnicity
- Black 57% White 18% Hispanic / Latino 17% Two or more races 11%
- Hispanic origin (detail)
- Mexican 11% Puerto Rican 2%
- Common ancestry
- Hispanic 3% Slovak 1% Romanian 1%
- Foreign-born
- 11% · Canada
- Languages at home
- 80% English-only · Spanish 15% French/Haitian/Cajun 4%
Political lean MEDSL · Marion
- 2024 margin
- Strong D (+27.7) · D 63.0% · R 35.3% · Other 1.7%
- 2008→2024 swing
- -0.7pp no change · 2008: 28.4pp · 2024: 27.7pp
- All cycles
- 2024: D+27.7 2020: D+29.1 2016: D+22.8 2012: D+22.2 2008: D+28.4
Not yet ingested
- Civics
- —
Market trends
- HPI YoY
- ▼ -12.41%
- Current HPI
- 275.1505
- Rent YoY
- ▲ 2.56%
- Metro
- Indianapolis-Carmel-Anderson, IN
- State GDP YoY
- ▲ 2.90%
- F500 in state
- 18
Industry mix (Fortune 500 HQ in IN)
| Industry | F500 HQs | Revenue |
|---|---|---|
| Industrial Machinery | 2 | $37B |
|
||
| Healthcare | 1 | $177B |
|
||
| Pharmaceuticals | 1 | $45B |
|
||
| Metals / Steel | 1 | $18B |
|
||
| Agriculture | 1 | $17B |
|
||
| Packaging | 1 | $12B |
|
||
Price history
+121.6% since first listed27 events — show timeline
- 2026-06-11 Listed $154,900 MIBOR as Distributed by MLS Grid
- 2017-09-01 Listing Removed — MIBOR as Distributed by MLS Grid
- 2017-08-07 Listed $90,000 MIBOR as Distributed by MLS Grid
- 2016-03-21 Listing Removed — MIBOR as Distributed by MLS Grid
- 2016-01-04 Listed $59,900 MIBOR as Distributed by MLS Grid
- 2009-03-13 Listing Removed — MIBOR as Distributed by MLS Grid
- 2008-03-12 Listed $88,000 MIBOR as Distributed by MLS Grid
- 2008-02-22 Sold (MLS) $25,900 MIBOR as Distributed by MLS Grid
- 2007-12-31 Listing Removed — MIBOR as Distributed by MLS Grid
- 2007-12-04 Listed $28,000 MIBOR as Distributed by MLS Grid
- 2007-06-04 Listed $87,000 MIBOR as Distributed by MLS Grid
- 2004-11-29 Sold (MLS) $37,000 MIBOR as Distributed by MLS Grid
- 2004-08-28 Listing Removed — MIBOR as Distributed by MLS Grid
- 2004-07-23 Listed $40,000 MIBOR as Distributed by MLS Grid
- 2004-01-19 Listed $44,900 MIBOR as Distributed by MLS Grid
- 2003-12-15 Listing Removed — MIBOR as Distributed by MLS Grid
- 2003-10-15 Listing Removed — MIBOR as Distributed by MLS Grid
- 2003-09-29 Listed $49,500 MIBOR as Distributed by MLS Grid
- 2003-09-17 Listed $56,000 MIBOR as Distributed by MLS Grid
- 2003-09-15 Listing Removed — MIBOR as Distributed by MLS Grid
- 2003-05-20 Listing Removed — MIBOR as Distributed by MLS Grid
- 2003-05-20 Listing Removed — MIBOR as Distributed by MLS Grid
- 2003-04-02 Listed $69,500 MIBOR as Distributed by MLS Grid
- 2003-04-02 Listed $56,000 MIBOR as Distributed by MLS Grid
- 2003-02-21 Listed $69,500 MIBOR as Distributed by MLS Grid
- 2001-09-28 Listing Removed — MIBOR as Distributed by MLS Grid
- 2000-09-28 Listed $69,900 MIBOR as Distributed by MLS Grid
Property tax history
+7.6%/yrLatest (2025): $2,444 · +24.0% YoY. Source: county tax records.
Cash-flow waterfall
monthlySold comps — $/sqft
last 12 mo · ≤1 miLoading sold comps…