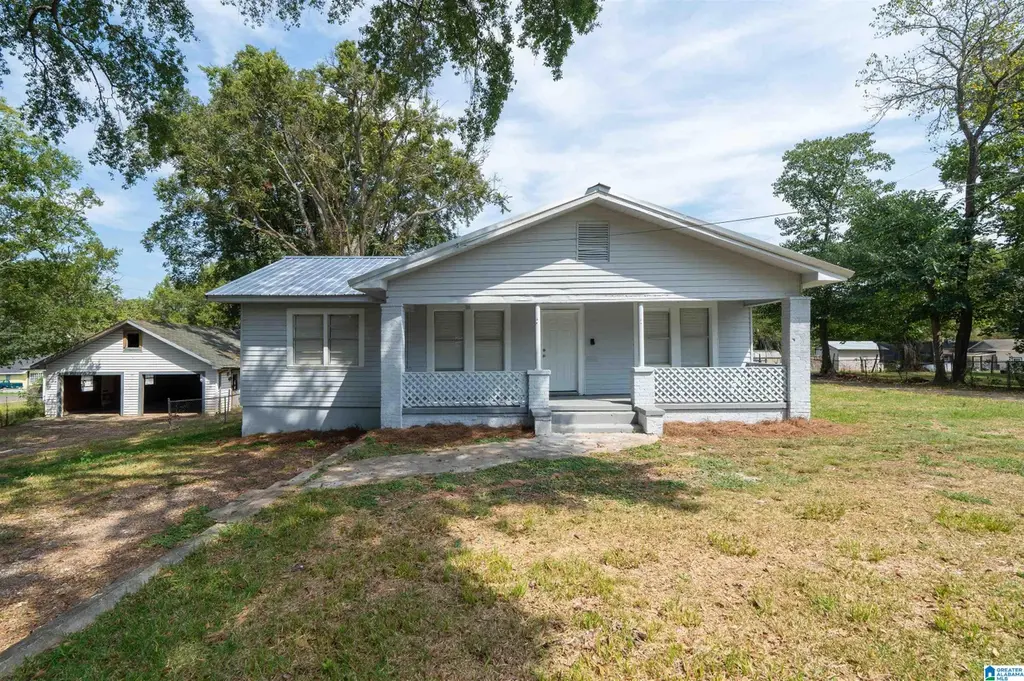
1317 12th St N · Bessemer, AL
Flood risk 1/10 · Minimal
- FEMA flood zone
- X (unshaded)
- Chance of flooding over 30 yrs
- 0.0%
- Est. flood insurance / yr
- $473 – $860
Fire risk 3/10 · Minor
- Est. fire insurance / yr
- $916 – $1,700
Heat risk 7/10 · Major
- Hot days now (above 108°F)
- 7 days/yr
- Hot days in 30 yrs
- 19 days/yr
Wind risk 6/10 · Moderate
- Chance of severe wind over 30 yrs
- 36.0%
Air-quality risk 3/10 · Minor
- Unhealthy air days now
- 2 days/yr
- Unhealthy air days in 30 yrs
- 5 days/yr
Risk factors via First Street. Map © Google.
Why this score? — see what drove the C- grade
The composite is a weighted blend of 9 inputs, each scored 0–100. Each bar is that input's sub-score; the figure is the points it added to the 100-point composite (weight × sub-score).
- Cash flow +22.5/30.0
- ARV discount +7.5/15.0
- DSCR +7.2/10.0
- 1% rule +5.4/10.0
- Livability +3.0/5.0
- Condition / age +2.5/5.0
- Rent growth +1.7/5.0
- Schools +0.8/10.0
- Appreciation +0.0/10.0
$120,000
🖨 Deal sheet (PDF) 📄 Offer letter ✓ Due diligence
Listing remarks MLS
Don’t miss out on this amazing 3-bedroom, 2-bathroom Bessemer home sitting proudly on a large corner lot with plenty of off-the-road parking! Enjoy the outdoors from your covered front porch or relax on one of the two side porches — perfect for morning coffee or evening wind-downs! Inside, you’ll find large rooms throughout, an extra den, and beautiful finishes that make this home stand out. It’s been renovated with granite countertops, luxury flooring, fresh paint, and stunning hardwood floors — all sitting on a flat, spacious lot that offers endless possibilities.
Key facts
- Covered front porch
- Luxury flooring
- Extra den
Tags
Neighborhood map
What this means for you Summary
Snapshot
- This is a 3-bed/1.0-bath single-family listed at $120k.
Deal economics
- At list price, monthly cash flow is $202 ($2k/yr) — positive.
- The deal already cash-flows at list — no discount required.
- Meets the 1% rule at list price ($1k rent vs $120k).
- Recommended offer: $106k (12.0% below list) — sets the bar for market timing.
- Cap rate 8.3% vs local median 5.9% in Bessemer — top-decile yield for the area; either an underpriced asset or a hidden risk that comps aren't pricing in. Stress-test before assuming the spread holds.
Location & tenants
- Location reads 59/100 on livability (#331 in AL) — a working-class tenant base; expect higher turnover. Strengths: commute A+, cost of living A+, housing A; Watch: crime F, amenities F, employment F.
- Bessemer City (suburban): math 3% / reading 19% proficiency, ranked #120 of 129 in AL (top 93%) — low school quality limits family demand, transient renter base, plan for 1-2y turnover; 87% free/reduced lunch — lower-income household profile, screen leases tightly.
- Zoned schools: Jonesboro Elementary School (math 3% / reading 15%, grade F, #593 of 627 statewide, top 95%, 525 students, 78% FRL); Bessemer City Middle School (math 3% / reading 23%, grade F, #215 of 257 statewide, top 84%, 674 students, 88% FRL); Bessemer City High School (math 2% / reading 8%, grade F, #276 of 305 statewide, top 95%, 850 students, 61% FRL).
- Market conditions: Rents falling (-3.1%/yr); 116 active listings in the ZIP; 23 comparable units currently listed for rent nearby; rentals at typical pace (median 18d on market — plan ~3-4 weeks tenant-placement turnaround); lower-income renter base — watch delinquency; 2,114 units permitted in Jefferson County in 2024 (556 in 5+ unit buildings).
- This rent runs 42% of the median local income ($35k/yr) — at the standard rent-burdened threshold; future hikes will face affordability resistance.
Forward outlook
- Local home prices are declining (-3.0%/yr); year-one equity from $830 of loan paydown is wiped out by about $4k of value loss. Plan a longer hold.
- Jefferson County population projected to shrink 4% by 2050 — rents likely to lag national; underwrite the cash flow, not the appreciation.
Negotiation context
- It's been on market 156 days — a 12% lower offer ($106k) is reasonable based on typical stale-listing flexibility.
- 4 sale attempts with the ask held roughly flat each time — persistent listings suggest the price (not the market) is what's stuck; bring a comps-based counter.
Risks & watch-outs
- Watch-outs: built in 1920 — expect roof / HVAC / electrical / plumbing capex.
- Climate carrying-cost: major wind risk, 36% chance of damaging wind over 30y; extreme-heat days projected 7→19/yr by 2055 (HVAC capex compounding) — expect insurance premiums to compound above CPI over the hold.
Questions for the listing agent
- It's been on market 156 days. Have you received any prior offers? Is the seller open to a 12% concession, seller financing, or rate buy-down credit?
- Built in 1920 — when were the roof, HVAC, electrical panel, plumbing, and water heater last replaced?
- Why hasn't it sold? Are there any deal-killer items the seller is aware of (foundation, flood, title, zoning, code violations)?
- Is there a deadline driving the sale (1031 exchange, divorce, estate, relocation)? That informs how much negotiation room exists.
- Schools are D-rated, which usually means shorter tenancies and higher turnover. Who's the typical renter profile here, and what's been the actual vacancy rate?
- Crime grade is F in this area — have there been break-ins, vandalism, or insurance claims at this property in the last 3 years? What carrier currently insures it and at what premium?
- What's the average days-on-market for RENTAL listings here right now (not sales)? A rising rental-DOM trend means longer vacancies and softer asking-rent achievability than the comps imply.
- What's the recent tenant-quality profile in this submarket — average credit score on applications, eviction rate, late-payment / NSF rate, and stable-employment percentage? A property-management company in the area should have these aggregated.
- How much new for-sale + rental construction is in the pipeline within 1–3 miles? Heavy new supply typically softens prices + rents 12–24 months out; constrained supply supports both.
Investment metrics
- 1% rule
- 1.04% ✓
- Cap rate
- 8.31%
- Cash-on-cash
- 7.20%
- DSCR
- 1.32
- GRM
- 8.0
CMA / ARV
- ARV (median comp)
- $74,532
- List price
- $120,000
- Delta
- 61.00%
- Verdict
- OVERPRICED
- Comps
- 20 within 1.0 mi
Show comp detail 10 sales within ~0.75 mi
| Address | Dist | Beds/Ba | Sqft | Sold | Price | $/sf | Match |
|---|---|---|---|---|---|---|---|
| 1003 10th Ave N | 0.39mi | 3/2.0 | 1,372 (-4%) | 1mo | $55,000 | $40 | 70 |
| 1500 7th Ave N | 0.64mi | 3/2.0 | 1,421 (-0%) | 3mo | $46,000 | $32 | 63 |
| 1009 Westlake Blvd | 0.26mi | 2/1.5 (-1) | 1,257 (-12%) | 1mo | $20,000 | $16 | 60 |
| 1129 13th St N | 0.21mi | 3/1.0 | 1,272 (-11%) | 16mo | $80,000 | $63 | 59 |
| 2008 Short 14th St N | 0.63mi | 3/1.0 | 1,225 (-14%) | 2mo | $100,000 | $82 | 46 |
| 529 12th St N | 0.71mi | 3/2.0 | 1,347 (-6%) | 10mo | $90,000 | $67 | 45 |
| 1700 N 14th Ave | 0.46mi | 3/1.0 | 1,232 (-14%) | 21mo | $25,000 | $20 | 38 |
| 1303 Berryhill Rd | 0.71mi | 3/2.0 | 1,281 (-10%) | 13mo | $133,800 | $104 | 35 |
| 1328 Berryhill Rd | 0.74mi | 3/1.0 | 1,289 (-10%) | 20mo | $55,000 | $43 | 33 |
| 1300 21st Ave N | 0.64mi | 3/1.5 | 1,269 (-11%) | 23mo | $89,900 | $71 | 30 |
Match score weights: distance 35% · size 25% · config 20% · recency 20%. Top-matched comps best support the ARV.
Projected returns pro-forma
-3.0% appreciation · 0.0% rent growth · sell at horizon
- IRR
- -8.6%
- Equity multiple
- 0.69×
- Total profit
- $-10,269
- Equity at exit
- $17,892
- IRR
- -3.4%
- Equity multiple
- 0.80×
- Total profit
- $-6,560
- Equity at exit
- $10,375
Cash invested: $33,600 (down + closing). Projections, not guarantees.
Landlord ↔ Tenant lean methodology
- Overall (STATE)
- 90 Strongly Landlord-Friendly
- State Alabama
- 90 Strongly Landlord-Friendly · R+15
- County
- — inherits STATE
- City
- — inherits STATE
ZIP-level market 35020
- Home prices YoY
- -24.2%
- Rents YoY
- -3.1%
- Active inventory
- 116
- Price-to-rent
- 8.0×
Monthly cashflow live
- Estimated rent
- $1,245 high interval (Pro) →
- Mortgage (P&I)
- −$629
- Tax from tax record
- −$103 /mo · $1,237/yr
- Insurance
- −$50
- HOA
- −$0
- Vacancy / Maint / Mgmt
- −$262
- Net cashflow
- $202
Break-even live
Sensitivity live
| Price | -10% $269 | -5% $235 | +0% $202 | +5% $168 | +10% $134 |
|---|---|---|---|---|---|
| Rent | -10% $103 | -5% $152 | +0% $202 | +5% $251 | +10% $300 |
| Rate | -1.0pp $262 | -0.5pp $232 | base $202 | +0.5pp $170 | +1.0pp $139 |
UW: 25.0% down · 7.5% · 30yr · 1.5% tax · 5.0% vac · 8.0% maint · 8.0% mgmt
Financing live
Cash to close
- Down payment
- $30,000
- Closing costs
- $3,600
- Reserves months
- —
- Total cash needed
- —
Loan-product check · same deal, 3 products live
Conventional
25% down · 7.5% · 30yr
- Down + closing
- —
- Monthly P&I
- —
- Monthly cashflow
- —
- DSCR
- —
- Eligible?
- —
Personal DTI + credit; lowest rate.
DSCR
20% down · 8.5% · 30yr
- Down + closing
- —
- Monthly P&I
- —
- Monthly cashflow
- —
- DSCR
- —
- Eligible?
- —
No personal income docs; deal must DSCR.
Hard money
10% down · 12.0% · 12mo
- Down + closing
- —
- Monthly P&I
- —
- Monthly cashflow
- —
- DSCR
- —
- Eligible?
- —
Short-term bridge; refi at stabilization.
Rent comps 23 comps
| Address | Beds | Baths | Sqft | Rent | $/sqft | DOM | Units | Dist |
|---|---|---|---|---|---|---|---|---|
| 1015 11th St N Bessemer, AL | 2.0 | 1.0 | 876 | $975 | $1.11 | 13d | 1 | 0.33mi |
| 817 15th St N Bessemer, AL | 3.0 | 2.0 | 1116 | $1,125 | $1.01 | 4d | 1 | 0.54mi |
| 2028 13th St N Bessemer, AL | 3.0 | 2.0 | 1372 | $1,073 | $0.78 | 25d | 1 | 0.57mi |
| 1929 15th St N Bessemer, AL | 3.0 | 2.0 | 1140 | $1,250 | $1.10 | 21d | 1 | 0.61mi |
| 719 16th St N Bessemer, AL | 3.0 | 1.5 | 1085 | $1,075 | $0.99 | 25d | 1 | 0.66mi |
| 2129 13th St N Bessemer, AL | 4.0 | 1.0 | 1378 | $1,445 | $1.05 | 16d | 1 | 0.67mi |
| 1314 22nd Ave N Bessemer, AL | 3.0 | 1.0 | 1038 | $1,000 | $0.96 | 45d | 1 | 0.76mi |
| 830 5th Ave N Bessemer, AL | 3.0 | 1.0 | 1072 | $1,000 | $0.93 | 45d | 1 | 0.85mi |
| 531 W Lake Dr Bessemer, AL | 3.0 | 1.0 | 1014 | $1,200 | $1.18 | 4d | 1 | 0.94mi |
| 806 4th Ave N Bessemer, AL | 3.0 | 1.0 | 1092 | $1,050 | $0.96 | 25d | 1 | 0.94mi |
| 1307 3rd Ave N Bessemer, AL | 4.0 | 1.0 | 960 | $1,200 | $1.25 | 45d | 1 | 0.97mi |
| 512 W Lake Dr Bessemer, AL | 3.0 | 1.0 | 944 | $1,125 | $1.19 | 13d | 1 | 0.99mi |
| 510 W Lake Dr Bessemer, AL | 3.0 | 1.0 | 950 | $1,025 | $1.08 | 17d | 1 | 0.99mi |
| 2234 19th St N Bessemer, AL | 2.0 | 1.0 | 1106 | $975 | $0.88 | 45d | 1 | 1.02mi |
| 428 Willow Ln Bessemer, AL | 4.0 | 2.0 | 1375 | $1,620 | $1.18 | 16d | 1 | 1.04mi |
| 1013 25th Ave N Bessemer, AL | 3.0 | 2.0 | 1144 | $1,546 | $1.35 | 17d | 1 | 1.25mi |
| 1623 26th Ave N Bessemer, AL | 2.0 | 1.0 | 1004 | $1,095 | $1.09 | 13d | 1 | 1.28mi |
| 3447 Jeanne Ln Bessemer, AL | 3.0 | 2.0 | 1460 | $1,850 | $1.27 | 3d | 1 | 1.29mi |
| 1032 26th Ave N Bessemer, AL | 3.0 | 1.0 | 1724 | $1,175 | $0.68 | 4d | 1 | 1.33mi |
| 306 W Lake Cir SW Bessemer, AL | 1.0–3.0 | 1.0–2.0 | 1004 | $1,455 | $1.45 | 3d | 1 | 1.33mi |
| 1315 27th St N Bessemer, AL | 4.0 | 2.0 | 1439 | $1,250 | $0.87 | 45d | 1 | 1.36mi |
| 1036 Rose Hill Cir Bessemer, AL | 3.0 | 2.0 | 1277 | $1,300 | $1.02 | 23d | 1 | 1.40mi |
| 905 26th Ave N Bessemer, AL | 4.0 | 2.0 | 1218 | $1,200 | $0.99 | 3d | 1 | 1.47mi |
Listing history 26 events
-
2026-06-21days on market $120,000 Active 156 DOM
-
2026-06-18days on market $120,000 Active 153 DOM
-
2026-06-17days on market $120,000 Active 152 DOM
-
2026-06-16days on market $120,000 Active 151 DOM
-
2026-06-15days on market $120,000 Active 150 DOM
-
2026-06-13remarks 629-char remark
-
2026-06-13statusdays on market $120,000 Active 148 DOM
-
2026-06-10days on market $120,000 Contingent 145 DOM
-
2026-06-09days on market $120,000 Contingent 144 DOM
-
2026-06-08days on market $120,000 Contingent 143 DOM
-
2026-06-07days on market $120,000 Contingent 142 DOM
-
2026-06-05days on market $120,000 Contingent 139 DOM
-
2026-06-03days on market $120,000 Contingent 138 DOM
-
2026-06-02days on market $120,000 Contingent 137 DOM
-
2026-06-01days on market $120,000 Contingent 136 DOM
-
2026-05-31days on market $120,000 Contingent 135 DOM
-
2026-04-30status Active 602-char remark
Show marketing remark (602 chars)
Don’t miss out on this amazing 3-bedroom, 2-bathroom Bessemer home sitting proudly on a large corner lot with plenty of off-the-road parking! Enjoy the outdoors from your covered front porch or relax on one of the two side porches — perfect for morning coffee or evening wind-downs! Inside, you’ll find large rooms throughout, an extra den, and beautiful finishes that make this home stand out. It’s been renovated with granite countertops, luxury flooring, fresh paint, and stunning hardwood floors — all sitting on a flat, spacious lot that offers endless possibilities.
-
2026-01-31historical Contingent 602-char remark
Show marketing remark (602 chars)
Don’t miss out on this amazing 3-bedroom, 2-bathroom Bessemer home sitting proudly on a large corner lot with plenty of off-the-road parking! Enjoy the outdoors from your covered front porch or relax on one of the two side porches — perfect for morning coffee or evening wind-downs! Inside, you’ll find large rooms throughout, an extra den, and beautiful finishes that make this home stand out. It’s been renovated with granite countertops, luxury flooring, fresh paint, and stunning hardwood floors — all sitting on a flat, spacious lot that offers endless possibilities.
-
2026-01-16$120,000 Active 602-char remark
Show marketing remark (602 chars)
Don’t miss out on this amazing 3-bedroom, 2-bathroom Bessemer home sitting proudly on a large corner lot with plenty of off-the-road parking! Enjoy the outdoors from your covered front porch or relax on one of the two side porches — perfect for morning coffee or evening wind-downs! Inside, you’ll find large rooms throughout, an extra den, and beautiful finishes that make this home stand out. It’s been renovated with granite countertops, luxury flooring, fresh paint, and stunning hardwood floors — all sitting on a flat, spacious lot that offers endless possibilities.
-
2025-10-30historical $1,200
-
2025-10-29$1,200
-
2025-10-28historical $1,200
-
2025-10-28$1,200
-
2023-11-03soldstatus $128,500
-
2004-08-20soldstatus $56,500
-
1984-07-24soldstatus $28,000
ⓘ Source: listings_history table (triggers on properties + properties_extension) + one-shot
backfill from property_details.listing_events for pre-trigger history.
Tax reassessment forecast AL · Resets to sale price
- Current annual tax
- $1,237 · $103/mo
- Projected year-2 tax
- $1,237 · $103/mo
- Expected delta
- $0/yr ($0/mo · 0.0%)
ⓘ Screening estimate from a state-policy table — verify with the county assessor before closing.
Climate risk First Street
- Flood 1/10 Low FEMA zone X (unshaded) · 0% chance over 30 yrs
- Wildfire 3/10 Moderate
- Heat 7/10 Severe 7 d/yr ≥108°F today · 19 d/yr by 30 yrs out
- Wind 6/10 Major 36% chance of damaging wind over 30 yrs
- Air quality 3/10 Moderate 2 unhealthy d/yr today · 5 by 30 yrs out
Nearby sold comps map
Loading sold comps map…
Walkable amenities ~0.75 mi
Loading nearby amenities…
Taxation est. · year 1
- Rental income
- $14,945
- − Mortgage interest
- −$6,722
- − Property taxes
- −$1,237
- − Insurance
- −$600
- − Repairs & maintenance
- −$1,196
- − Management
- −$1,196
- − Depreciation
- −$3,491
- Taxable income
- $504
- Est. tax owed @ 24.0%
- −$121
- After-tax cash flow
- $2,297/yr
For passive investors: Depreciation is non-cash, so a rental often shows a tax loss while cash-flowing — sheltering income. Rental losses are passive: they offset passive income freely, and up to $25,000/yr can offset ordinary (W-2) income if you actively participate and your MAGI is under $100k (phasing out to $0 by $150k); unused losses carry forward. On sale, claimed depreciation is recaptured at up to 25%, and gains may owe capital-gains tax (a 1031 exchange can defer both). Figures are a year-1 estimate at your 24.0% rate — not tax advice; consult a CPA.
Schools (NCES district)
- District
- Bessemer City
- NCES district ID
- 0100330
- Math proficiency
- 3% ▼ -18.00%
- Reading proficiency
- 19% ▼ -3.00%
- Median HH income
- $29,721
- Composite
- 8.45/100
- National rank
- #9905
- State rank
- #120 of 129 in AL
Livability — Bessemer
- Score
- 59/100
- State rank
- #331
- US rank
- #20078
Category grades
Schools grade is shown separately in the Schools card above.
Census & demographics
- Census place
- Bessemer, AL
- County
- Jefferson County · 527,445 people
- City population
- 48,018
- Metro
- Birmingham-Hoover, AL
- Population (ZIP)
- 24,892
- Household income
- $35,362
- Rent vs Own
- Severe rent burden
- 1001.0
Population outlook (Jefferson County) Hauer SSP2
- Today (2025)
- 669,185 people
- By 2030
- 669,694 · +0.1%
- By 2040
- 661,388 · -1.2%
- By 2050
- 643,086 · -3.9%
- By 2075
- 577,267 · -13.7%
- By 2100
- 474,758 · -29.1%
Race, ethnicity, and origin ACS 2023
- Neighborhood character
- Predominantly Black (74%)
- Race & ethnicity
- Black 74% Hispanic / Latino 13% White 11% Two or more races 6%
- Hispanic origin (detail)
- Mexican 10%
- Foreign-born
- 5% · Canada
- Languages at home
- 89% English-only · Spanish 11%
Political lean MEDSL · Jefferson
- 2024 margin
- D (+10.4) · D 54.6% · R 44.2% · Other 1.2%
- 2008→2024 swing
- +5.4pp toward D · 2008: 5.1pp · 2024: 10.4pp
- All cycles
- 2024: D+10.4 2020: D+13.2 2016: D+7.2 2012: D+6.0 2008: D+5.1
Not yet ingested
- Civics
- —
Market trends
- HPI YoY
- ▼ -57.54%
- Current HPI
- 179.7702
- Rent YoY
- ▼ -3.12%
- Metro
- Birmingham-Hoover, AL
- State GDP YoY
- ▲ 2.94%
- F500 in state
- 4
Industry mix (Fortune 500 HQ in AL)
| Industry | F500 HQs | Revenue |
|---|---|---|
| Financial Services | 1 | $8B |
|
||
| Healthcare | 1 | $5B |
|
||
Price history
+328.6% since first listed10 events — show timeline
- 2026-04-30 Relisted — Greater Alabama MLS
- 2026-01-31 Contingent — Greater Alabama MLS
- 2026-01-16 Listed $120,000 Greater Alabama MLS
- 2025-10-30 Rental Removed $1,200 APPFOLIO
- 2025-10-29 Listed for Rent $1,200 APPFOLIO
- 2025-10-28 Rental Removed $1,200 SHOWMOJO
- 2025-10-28 Listed for Rent $1,200 SHOWMOJO
- 2023-11-03 Sold (Public Records) $128,500 Public Records
- 2004-08-20 Sold (Public Records) $56,500 Public Records
- 1984-07-24 Sold (Public Records) $28,000 Public Records
Property tax history
+8.1%/yrLatest (2025): $1,237 · +0.0% YoY. Source: county tax records.
Cash-flow waterfall
monthlySold comps — $/sqft
last 12 mo · ≤1 miLoading sold comps…