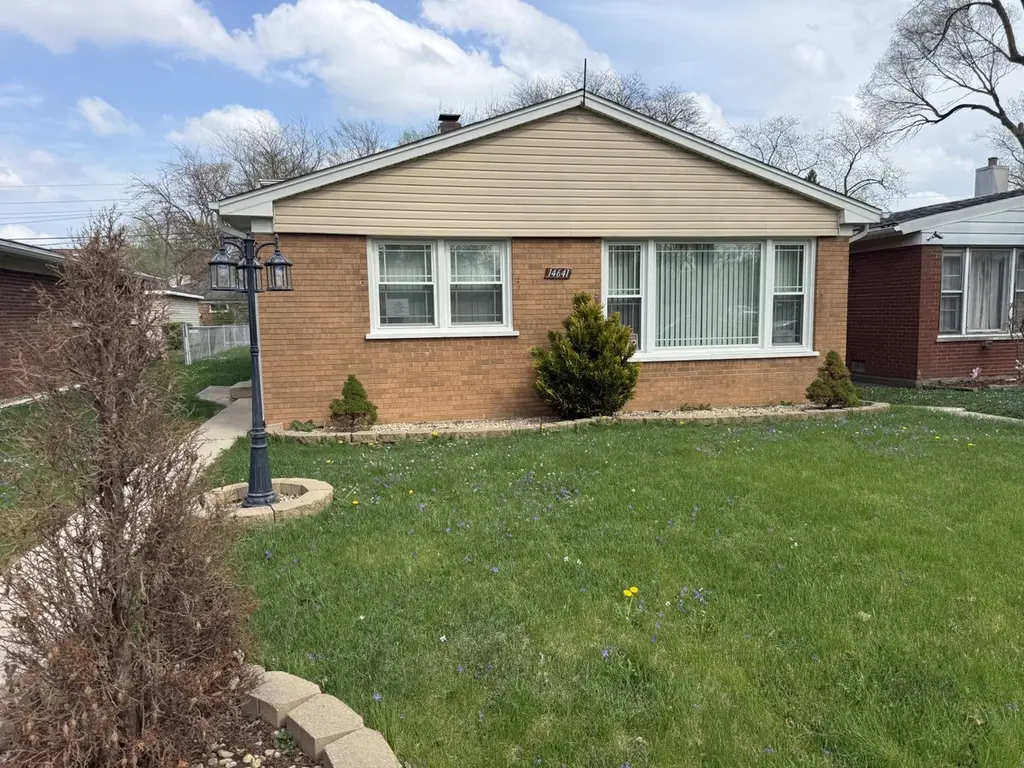
14641 Wabash Ave · Dolton, IL
Flood risk 1/10 · Minimal
- FEMA flood zone
- X (unshaded)
- Chance of flooding over 30 yrs
- 0.0%
- Est. flood insurance / yr
- $473 – $860
Fire risk 1/10 · Minimal
- Est. fire insurance / yr
- $804 – $1,492
Heat risk 3/10 · Minor
- Hot days now (above 101°F)
- 7 days/yr
- Hot days in 30 yrs
- 15 days/yr
Wind risk 2/10 · Minimal
- Chance of severe wind over 30 yrs
- —
Air-quality risk 4/10 · Minor
- Unhealthy air days now
- 4 days/yr
- Unhealthy air days in 30 yrs
- 5 days/yr
Risk factors via First Street. Map © Google.
Why this score? — see what drove the C+ grade
The composite is a weighted blend of 9 inputs, each scored 0–100. Each bar is that input's sub-score; the figure is the points it added to the 100-point composite (weight × sub-score).
- Cash flow +24.8/30.0
- 1% rule +9.4/10.0
- DSCR +8.0/10.0
- ARV discount +6.5/15.0
- Rent growth +4.9/5.0
- Livability +3.7/5.0
- Condition / age +2.5/5.0
- Schools +0.7/10.0
- Appreciation +0.0/10.0
$153,000
🖨 Deal sheet 📄 Offer letter ✓ Due diligence
Listing remarks MLS
Beautiful Remodeled 4 Bedrooms, 2 Full Baths, Master Bathroom with Whirlpool Bathtub, Hardwood Floors, Living room with Fireplace and Flat Screen TV included, Beautiful Kitchen With Brand New Stainless Steel Appliances, and Breakfast Bar, New Windows, New Roof & Siding on the garage, 2 car garage, good size backyard.
Key facts
- Close to commerce
- Close to parks
- Close to schools
Tags
Property features AI
Finance
- Other: Fee simple ownership
- HOA & community: No master association fee required
Exterior
- Parking: Detached owned garage (2 garage spaces, 2 total parking spaces)
- Utilities: Public water; Public sewer
- Home design: Detached single-family home; Split-level design; Age: 61–70 years; Built before 1978
- Construction: Brick construction
- Exterior features: Less than 1/4 acre lot
Interior
- Kitchen: Kitchen on main level
- Bedrooms: 3 bedrooms (master and two additional bedrooms on second level)
- Flooring: Hardwood flooring in main living areas and bedrooms; Ceramic tile in kitchen
- Bathrooms: 2 full bathrooms; Basement has a bathroom
- Heating & cooling: Natural gas forced air heating; Central air conditioning
- Interior features: Finished partial basement; Six total rooms; School bus service
- Laundry & utility: Lower-level laundry room (approx. 12 x 8)
Neighborhood map
What this means for you Summary
Snapshot
- This is a 3-bed/1.0-bath single-family listed at $153k.
Deal economics
- At list price, monthly cash flow is $324 ($4k/yr) — positive.
- The deal already cash-flows at list — no discount required.
- Meets the 1% rule at list price ($2k rent vs $153k).
- Recommended offer: $151k (1.5% below list) — sets the bar for market timing.
Location & tenants
- Location reads 74/100 on livability (#263 in IL, #4,883 nationally) — a middle-class / working-renter tenant base. Strengths: commute A+, cost of living A+, housing A+; Watch: employment C-, health & safety C-, schools F.
- Thornton Twp Hsd 205 (suburban): math 7% / reading 8% proficiency, ranked #594 of 620 in IL (top 96%) — low school quality limits family demand, transient renter base, plan for 1-2y turnover.
- Market conditions: Rents rising fast (+9.7%/yr); 130 active listings in the ZIP; 16 comparable units currently listed for rent nearby; rentals at typical pace (median 25d on market — plan ~3-4 weeks tenant-placement turnaround); 6,272 units permitted in Cook County in 2024 (4,658 in 5+ unit buildings).
- At $2,207/mo this rent would consume 46% of the median local household income ($58k/yr) (locally 919% of renters already pay >50% of income on rent) — very limited rent-growth headroom before tenants either downsize or default.
Forward outlook
- Local home prices are declining (-3.0%/yr); year-one equity from $1k of loan paydown is wiped out by about $5k of value loss. Plan a longer hold.
- At projected returns (-3.0% appreciation + 8.0% rent growth), your $43k cash investment doubles in ~7 years — after that, you're playing with house money.
Negotiation context
- It's been on market 24 days — a 2% lower offer ($151k) is reasonable based on typical stale-listing flexibility.
- 5 sale attempts since 8y ago; this cycle's ask has dropped $10k (6%) from the opening price — seller is motivated, your offer sets the floor, not the list.
Risks & watch-outs
- Watch-outs: property tax is 4.3% of price; built in 1957 — expect roof / HVAC / electrical / plumbing capex.
Questions for the listing agent
- Built in 1957 — when were the roof, HVAC, electrical panel, plumbing, and water heater last replaced?
- Property tax is high relative to price — has the assessment been appealed recently, and will the sale trigger a re-assessment?
- Is there a deadline driving the sale (1031 exchange, divorce, estate, relocation)? That informs how much negotiation room exists.
- Schools are F-rated, which usually means shorter tenancies and higher turnover. Who's the typical renter profile here, and what's been the actual vacancy rate?
- Crime grade is D in this area — have there been break-ins, vandalism, or insurance claims at this property in the last 3 years? What carrier currently insures it and at what premium?
- What's the average days-on-market for RENTAL listings here right now (not sales)? A rising rental-DOM trend means longer vacancies and softer asking-rent achievability than the comps imply.
- What's the recent tenant-quality profile in this submarket — average credit score on applications, eviction rate, late-payment / NSF rate, and stable-employment percentage? A property-management company in the area should have these aggregated.
- How much new for-sale + rental construction is in the pipeline within 1–3 miles? Heavy new supply typically softens prices + rents 12–24 months out; constrained supply supports both.
Investment metrics
- 1% rule
- 1.44% ✓
- Cap rate
- 8.83%
- Cash-on-cash
- 9.06%
- DSCR
- 1.40
- GRM
- 5.8
CMA / ARV
- ARV (on-the-fly)
- $149,678
- Comps found
- 12
Show comp detail 12 sales within ~0.75 mi
| Address | Dist | Beds/Ba | Sqft | Sold | Price | $/sf | Match |
|---|---|---|---|---|---|---|---|
| 14525 S Michigan Ave | 0.16mi | 3/1.0 | 1,200 (+7%) | 2mo | $190,000 | $158 | 79 |
| 14633 Wabash Ave | 0.02mi | 3/7.0 | 1,150 (+3%) | 1mo | $95,000 | $83 | 74 |
| 14234 S Michigan Ave | 0.50mi | 3/1.0 | 1,102 (-1%) | 3mo | $114,000 | $103 | 72 |
| 15061 Wabash Ave | 0.57mi | 3/1.5 | 1,116 (-0%) | 2mo | $150,000 | $134 | 70 |
| 302 W 145th St | 0.52mi | 3/2.0 | 1,087 (-3%) | 0mo | $250,000 | $230 | 67 |
| 201 E 143rd St | 0.50mi | 4/2.0 (+1) | 1,129 (+1%) | 0mo | $95,000 | $84 | 66 |
| 523 E 149th St | 0.68mi | 3/1.5 | 1,143 (+2%) | 2mo | $80,000 | $70 | 61 |
| 14619 Martin Luther King Jr Dr | 0.69mi | 3/1.0 | 1,153 (+3%) | 2mo | $163,000 | $141 | 60 |
| 14231 S State St | 0.51mi | 2/1.0 (-1) | 1,000 (-10%) | 0mo | $145,000 | $145 | 53 |
| 506 E 144th St | 0.68mi | 3/1.0 | 1,020 (-9%) | 2mo | $48,500 | $48 | 52 |
| 14135 S La Salle St | 0.67mi | 3/1.5 | 1,210 (+8%) | 1mo | $60,000 | $50 | 52 |
| 14825 Perry Ave | 0.72mi | 4/2.0 (+1) | 1,014 (-9%) | 1mo | $200,000 | $197 | 41 |
Match score weights: distance 35% · size 25% · config 20% · recency 20%. Top-matched comps best support the ARV.
Projected returns pro-forma
-3.0% appreciation · 8.0% rent growth · sell at horizon
- IRR
- 4.4%
- Equity multiple
- 1.18×
- Total profit
- $7,733
- Equity at exit
- $22,813
- IRR
- 18.9%
- Equity multiple
- 3.04×
- Total profit
- $87,385
- Equity at exit
- $13,229
Cash invested: $42,840 (down + closing). Projections, not guarantees.
Landlord ↔ Tenant lean methodology
- Overall (STATE)
- 43 Moderately Tenant-Leaning
- State Illinois
- 43 Moderately Tenant-Leaning · D+7
- County
- — inherits STATE
- City
- — inherits STATE
ZIP-level market 60419
- Home prices YoY
- -25.7%
- Rents YoY
- 9.7%
- Active inventory
- 130
- Price-to-rent
- 5.8×
Monthly cashflow live
- Estimated rent
- $2,207 high interval (Pro) →
- Mortgage (P&I)
- −$802
- Tax from tax record
- −$554 /mo · $6,643/yr
- Insurance
- −$64
- HOA
- −$0
- Vacancy / Maint / Mgmt
- −$463
- Net cashflow
- $324
Break-even live
UW: 25.0% down · 7.5% · 30yr · 1.5% tax · 5.0% vac · 8.0% maint · 8.0% mgmt
Financing live
Cash to close
- Down payment
- $38,250
- Closing costs
- $4,590
- Reserves months
- —
- Total cash needed
- —
Loan-product check · same deal, 3 products live
Conventional
25% down · 7.5% · 30yr
- Down + closing
- —
- Monthly P&I
- —
- Monthly cashflow
- —
- DSCR
- —
- Eligible?
- —
Personal DTI + credit; lowest rate.
DSCR
20% down · 8.5% · 30yr
- Down + closing
- —
- Monthly P&I
- —
- Monthly cashflow
- —
- DSCR
- —
- Eligible?
- —
No personal income docs; deal must DSCR.
Hard money
10% down · 12.0% · 12mo
- Down + closing
- —
- Monthly P&I
- —
- Monthly cashflow
- —
- DSCR
- —
- Eligible?
- —
Short-term bridge; refi at stabilization.
Rent comps 16 comps
| Address | Beds | Baths | Sqft | Rent | $/sqft | DOM | Units | Dist |
|---|---|---|---|---|---|---|---|---|
| 14844 Wabash Ave Dolton, IL | 3.0 | 1.5 | 1277 | $2,320 | $1.82 | 24d | 1 | 0.23mi |
| 14124 Manor Ave Dolton, IL | 3.0 | 2.0 | 1440 | $2,390 | $1.66 | 24d | 1 | 0.77mi |
| 14101 S Atlantic Ave Riverdale, IL | 2.0 | 1.0 | 790 | $1,140 | $1.44 | 7d | 1 | 0.82mi |
| 15238 Doctor Martin Luther King Junior Dr Unit 2W Dolton, IL | 2.0 | 1.0 | 800 | $1,500 | $1.88 | 10d | 1 | 0.99mi |
| 14015 S Stewart Ave Unit 2W Riverdale, IL | 2.0 | 1.0 | 800 | $1,400 | $1.75 | 24d | 1 | 1.00mi |
| 14817 Champlain Ave Dolton, IL | 2.0 | 1.0 | 980 | $2,430 | $2.48 | 22d | 1 | 1.04mi |
| 14305 Irving Ave Unit 2 Dolton, IL | 3.0 | 1.0 | 1100 | $2,200 | $2.00 | 24d | 1 | 1.07mi |
| 14916 Langley Ave Dolton, IL | 3.0 | 1.5 | 1418 | $2,500 | $1.76 | 24d | 1 | 1.10mi |
| 13810 S La Salle St #1 Riverdale, IL | 3.0 | 1.0 | 800 | $1,550 | $1.94 | 2d | 1 | 1.14mi |
| 13841 Forest Ave Dolton, IL | 3.0 | 1.0 | 930 | $1,895 | $2.04 | 24d | 1 | 1.17mi |
| 14500 Cottage Grove Ave Unit 3 Dolton, IL | 2.0 | 1.0 | 1000 | $1,475 | $1.48 | 24d | 1 | 1.22mi |
| 13708 S Wentworth Ave Riverdale, IL | 3.0 | 1.5 | 1500 | $2,200 | $1.47 | 22d | 1 | 1.27mi |
| 15509 Park Ln South Holland, IL | 4.0 | 1.5 | 1200 | $3,400 | $2.83 | 24d | 1 | 1.37mi |
| 15509 Park Ln South Holland, IL | 4.0 | 1.5 | 1200 | $3,400 | $2.83 | 7d | 1 | 1.37mi |
| 13604 S Wentworth Ave Riverdale, IL | 3.0 | 1.0 | 1100 | $1,200 | $1.09 | 24d | 1 | 1.39mi |
| 724 W 138th St Unit 3 Riverdale, IL | 2.0 | 1.0 | 800 | $1,250 | $1.56 | 18d | 1 | 1.48mi |
Listing history 29 events
-
2026-06-18days on market $153,000 Active 24 DOM
-
2026-06-17days on market $153,000 Active 23 DOM
-
2026-06-16days on market $153,000 Active 22 DOM
-
2026-06-15days on market $153,000 Active 21 DOM
-
2026-06-13days on market $153,000 Active 19 DOM
-
2026-06-13days on market $153,000 Active 18 DOM
-
2026-06-09days on market $153,000 Active 15 DOM
-
2026-06-08days on market $153,000 Active 14 DOM
-
2026-06-07days on market $153,000 Active 13 DOM
-
2026-06-04days on market $153,000 Active 10 DOM
-
2026-06-03days on market $153,000 Active 9 DOM
-
2026-06-02days on market $153,000 Active 8 DOM
-
2026-06-01days on market $153,000 Active 7 DOM
-
2026-05-31days on market $153,000 Active 6 DOM
-
2026-04-15historical
-
2026-04-15$162,950 Active
-
2026-04-12status Temporarily No Showings
-
2025-11-22historical
-
2025-10-15price
-
2025-09-05Active
-
2019-10-29soldstatus $159,000
-
2019-10-21soldstatus $159,000 Closed Sale 324-char remark
Show marketing remark (324 chars)
Beautiful Remodeled 4 Bedrooms, 2 Full Baths, Master Bathroom with Whirlpool Bathtub, Hardwood Floors, Living room with Fireplace and Flat Screen TV included, Beautiful Kitchen With Brand New Stainless Steel Appliances, and Breakfast Bar, New Windows, New Roof & Siding on the garage, 2 car garage, good size backyard.
-
2019-08-17price $159,900 324-char remark
Show marketing remark (324 chars)
Beautiful Remodeled 4 Bedrooms, 2 Full Baths, Master Bathroom with Whirlpool Bathtub, Hardwood Floors, Living room with Fireplace and Flat Screen TV included, Beautiful Kitchen With Brand New Stainless Steel Appliances, and Breakfast Bar, New Windows, New Roof & Siding on the garage, 2 car garage, good size backyard.
-
2019-08-17historical Contingent 324-char remark
Show marketing remark (324 chars)
Beautiful Remodeled 4 Bedrooms, 2 Full Baths, Master Bathroom with Whirlpool Bathtub, Hardwood Floors, Living room with Fireplace and Flat Screen TV included, Beautiful Kitchen With Brand New Stainless Steel Appliances, and Breakfast Bar, New Windows, New Roof & Siding on the garage, 2 car garage, good size backyard.
-
2019-08-05$155,900 New 324-char remark
Show marketing remark (324 chars)
Beautiful Remodeled 4 Bedrooms, 2 Full Baths, Master Bathroom with Whirlpool Bathtub, Hardwood Floors, Living room with Fireplace and Flat Screen TV included, Beautiful Kitchen With Brand New Stainless Steel Appliances, and Breakfast Bar, New Windows, New Roof & Siding on the garage, 2 car garage, good size backyard.
-
2019-01-11soldstatus $47,100 Closed Sale
-
2018-11-21status Pending
-
2018-10-25$34,700 New
-
1994-07-20soldstatus $70,000
ⓘ Source: listings_history table (triggers on properties + properties_extension) + one-shot
backfill from property_details.listing_events for pre-trigger history.
Tax reassessment forecast IL · Partial reset (capped growth)
- Current annual tax
- $6,643 · $554/mo
- Projected year-2 tax
- $6,643 · $554/mo
- Expected delta
- $0/yr ($0/mo · 0.0%)
ⓘ Screening estimate from a state-policy table — verify with the county assessor before closing.
Climate risk First Street
- Flood 1/10 Low FEMA zone X (unshaded) · 0% chance over 30 yrs
- Wildfire 1/10 Low
- Heat 3/10 Moderate 7 d/yr ≥101°F today · 15 d/yr by 30 yrs out
- Wind 2/10 Low
- Air quality 4/10 Moderate 4 unhealthy d/yr today · 5 by 30 yrs out
Nearby sold comps map
Loading sold comps map…
Walkable amenities ~0.75 mi
Loading nearby amenities…
Taxation est. · year 1
- Rental income
- $26,479
- − Mortgage interest
- −$8,570
- − Property taxes
- −$6,643
- − Insurance
- −$765
- − Repairs & maintenance
- −$2,118
- − Management
- −$2,118
- − Depreciation
- −$4,451
- Taxable income
- $1,814
- Est. tax owed @ 24.0%
- −$435
- After-tax cash flow
- $3,447/yr
For passive investors: Depreciation is non-cash, so a rental often shows a tax loss while cash-flowing — sheltering income. Rental losses are passive: they offset passive income freely, and up to $25,000/yr can offset ordinary (W-2) income if you actively participate and your MAGI is under $100k (phasing out to $0 by $150k); unused losses carry forward. On sale, claimed depreciation is recaptured at up to 25%, and gains may owe capital-gains tax (a 1031 exchange can defer both). Figures are a year-1 estimate at your 24.0% rate — not tax advice; consult a CPA.
Schools (NCES district)
- District
- Thornton Twp Hsd 205
- NCES district ID
- 1738970
- Math proficiency
- 7% ▬ 0.00%
- Reading proficiency
- 8% ▼ -2.00%
- Median HH income
- $43,392
- Composite
- 6.92/100
- National rank
- #9976
- State rank
- #594 of 620 in IL
Livability — Dolton
- Score
- 74/100
- State rank
- #263
- US rank
- #4883
Category grades
Schools grade is shown separately in the Schools card above.
Census & demographics
- Census place
- Dolton, IL
- County
- Cook County · 4,486,803 people
- City population
- 20,825
- Metro
- Chicago-Naperville-Elgin, IL-IN-WI
- Population (ZIP)
- 20,825
- Household income
- $57,887
- Rent vs Own
- Severe rent burden
- 919.0
Population outlook (Cook County) Hauer SSP2
- Today (2025)
- 5,347,519 people
- By 2030
- 5,357,703 · +0.2%
- By 2040
- 5,324,924 · -0.4%
- By 2050
- 5,230,762 · -2.2%
- By 2075
- 4,785,735 · -10.5%
- By 2100
- 4,188,836 · -21.7%
Race, ethnicity, and origin ACS 2023
- Neighborhood character
- Predominantly Black (91%)
- Race & ethnicity
- Black 91% White 4% Two or more races 3% Hispanic / Latino 1%
- Common ancestry
- Romanian 1% Hispanic 1%
- Foreign-born
- 3% · Canada
- Languages at home
- 95% English-only · French/Haitian/Cajun 2% Spanish 1%
Political lean MEDSL · Cook
- 2024 margin
- Solid D (+42.0) · D 70.4% · R 28.4% · Other 1.2%
- 2008→2024 swing
- -11.4pp toward R · 2008: 53.4pp · 2024: 42.0pp
- All cycles
- 2024: D+42.0 2020: D+50.3 2016: D+53.0 2012: D+49.4 2008: D+53.4
Not yet ingested
- Civics
- —
Market trends
- HPI YoY
- ▼ -66.88%
- Current HPI
- 193.2346
- Rent YoY
- ▲ 9.65%
- Metro
- Chicago-Naperville-Elgin, IL-IN-WI
- State GDP YoY
- ▲ 1.59%
- F500 in state
- 60
Industry mix (Fortune 500 HQ in IL)
| Industry | F500 HQs | Revenue |
|---|---|---|
| Insurance | 4 | $201B |
|
||
| Consumer Goods | 4 | $87B |
|
||
| Industrial Machinery | 3 | $64B |
|
||
| Healthcare | 2 | $55B |
|
||
| Retail / Pharmacy | 1 | $148B |
|
||
| Agriculture / Food | 1 | $86B |
|
||
Price history
+132.8% since first listed15 events — show timeline
- 2026-04-15 Listed $162,950 MRED as Distributed by MLS Grid
- 2026-04-15 Listing Removed — MRED as Distributed by MLS Grid
- 2026-04-12 Relisted — MRED as Distributed by MLS Grid
- 2025-11-22 Listing Removed — MRED as Distributed by MLS Grid
- 2025-10-15 Price Changed — MRED as Distributed by MLS Grid
- 2025-09-05 Listed — MRED as Distributed by MLS Grid
- 2019-10-29 Sold (Public Records) $159,000 Public Records
- 2019-10-21 Sold (MLS) $159,000 MRED as Distributed by MLS Grid
- 2019-08-17 Price Changed $159,900 MRED as Distributed by MLS Grid
- 2019-08-17 Contingent — MRED as Distributed by MLS Grid
- 2019-08-05 Listed $155,900 MRED as Distributed by MLS Grid
- 2019-01-11 Sold (MLS) $47,100 MRED as Distributed by MLS Grid
- 2018-11-21 Pending — MRED as Distributed by MLS Grid
- 2018-10-25 Listed $34,700 MRED as Distributed by MLS Grid
- 1994-07-20 Sold (Public Records) $70,000 Public Records
Property tax history
+8.5%/yrLatest (2023): $6,643 · -35.0% YoY. Source: county tax records.
Cash-flow waterfall
monthlySold comps — $/sqft
last 12 mo · ≤1 miLoading sold comps…