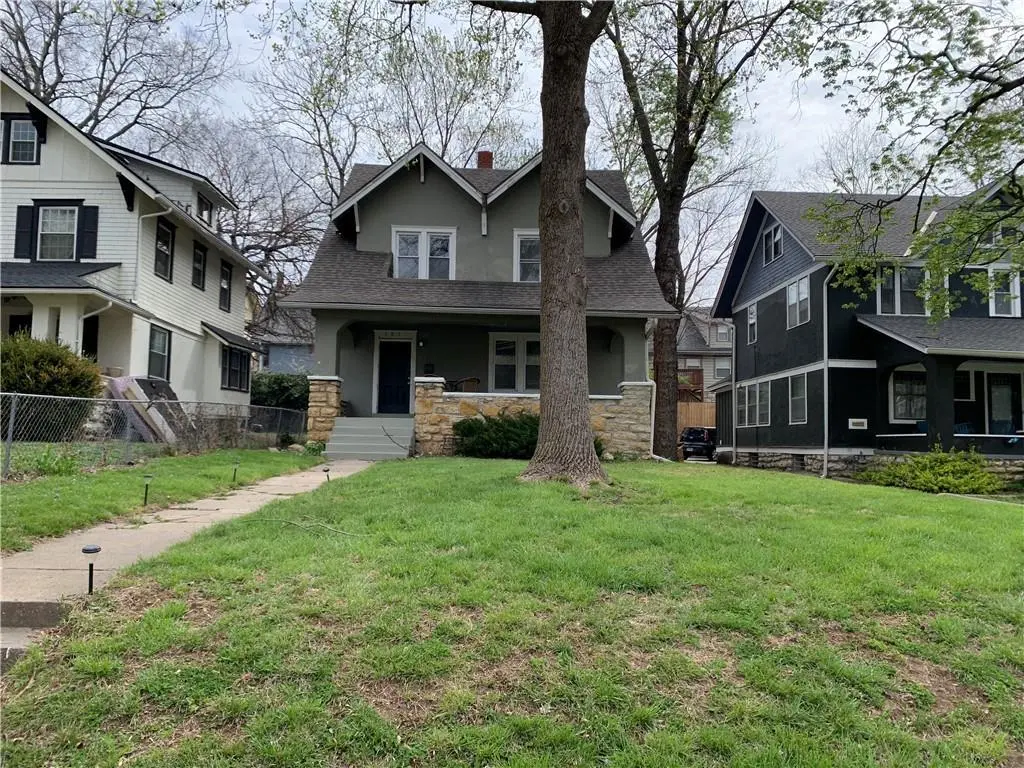
3821 Virginia Ave · Kansas City, MO
Flood risk 1/10 · Minimal
- FEMA flood zone
- X (unshaded)
- Chance of flooding over 30 yrs
- 0.0%
- Est. flood insurance / yr
- $473 – $860
Fire risk 1/10 · Minimal
- Est. fire insurance / yr
- $1,054 – $1,958
Heat risk 4/10 · Minor
- Hot days now (above 106°F)
- 7 days/yr
- Hot days in 30 yrs
- 17 days/yr
Wind risk 2/10 · Minimal
- Chance of severe wind over 30 yrs
- —
Air-quality risk 3/10 · Minor
- Unhealthy air days now
- 2 days/yr
- Unhealthy air days in 30 yrs
- 3 days/yr
Risk factors via First Street. Map © Google.
Why this score? — see what drove the C grade
The composite is a weighted blend of 9 inputs, each scored 0–100. Each bar is that input's sub-score; the figure is the points it added to the 100-point composite (weight × sub-score).
- Cash flow +17.7/30.0
- ARV discount +15.0/15.0
- DSCR +5.5/10.0
- Rent growth +4.9/5.0
- 1% rule +4.0/10.0
- Livability +3.9/5.0
- Condition / age +2.5/5.0
- Schools +1.5/10.0
- Appreciation +0.0/10.0
$199,900
🖨 Deal sheet 📄 Offer letter ✓ Due diligence
Listing remarks MLS
This house has huge potential with its size and location. Carpet in good condition, bathrooms all have tile, and kitchen has newer cabinets and counter tops. Lots of living space. 4 bedrooms plus one bonus room for study or playroom off bedroom. 3 large full bathrooms plus 1/2 bath.
Key facts
- Covered front porch
- Formal dining room
- Private urban oasis
Tags
Property features AI
Finance
- Other: Lot size approximately 5,723 square feet
- Financial info: Tax amount not included per instructions
- HOA & community: No association fees
Exterior
- Parking: Off-street parking
- Security: Security features not specified
- Utilities: Public water; Public sewer; Power details not specified
- Home design: Single-family residential; Tri-level design; Facing direction not specified; Entry level not specified
- Construction: Stucco exterior with stone trim; Composition roof; Approximately 101+ years old; Foundation details not specified
- Exterior features: Level lot; Fenced (type: Other); Classic front porch (per directions)
Interior
- Kitchen: Appliances not specified
- Bedrooms: 4 bedrooms (all located on the second level)
- Flooring: Flooring details not specified
- Bathrooms: 3 full bathrooms; 1 half bathroom
- Heating & cooling: Natural gas heating; Electric cooling (central cooling indicated)
- Interior features: Formal dining area; Living room fireplace; Tri-level floor plan; Basement with concrete floor, inside entrance and walk-out access
- Laundry & utility: Laundry/utility details not specified
Neighborhood map
What this means for you Summary
Snapshot
- This is a 3-bed/3.0-bath single-family listed at $200k.
Deal economics
- At list price, monthly cash flow is $162 ($2k/yr) — positive.
- The deal already cash-flows at list — no discount required.
- To meet the 1% rule (rent ≥ 1% of price), the offer needs to be $180k (10.1% below list).
- Recommended offer: $180k (10.1% below list) — sets the bar for 1% rule.
- Cap rate 7.3% vs local median 3.9% in Kansas City — top-decile yield for the area; either an underpriced asset or a hidden risk that comps aren't pricing in. Stress-test before assuming the spread holds.
Location & tenants
- Location reads 78/100 on livability (#28 in MO, #2,671 nationally) — a middle-class / working-renter tenant base. Strengths: amenities A+, commute A+, cost of living A+; Watch: crime F.
- Kansas City 33 (urban): math 12% / reading 24% proficiency, ranked #308 of 324 in MO (top 95%) — low school quality limits family demand, transient renter base, plan for 1-2y turnover; 75% free/reduced lunch — lower-income household profile, screen leases tightly.
- Zoned schools: Central High School (math 2% / reading 17%, grade F, #507 of 521 statewide, top 98%, 535 students, 99% FRL) — zoned schools average 99% FRL vs 75% district-wide (24 pts higher); higher-poverty schools than district average — tighter screening recommended.
- Market conditions: Rents rising fast (+9.5%/yr); 97 active listings in the ZIP; 30 comparable units currently listed for rent nearby; rentals at typical pace (median 16d on market — plan ~3-4 weeks tenant-placement turnaround); lower-income renter base — watch delinquency; 4,002 units permitted in Jackson County in 2024 (2,271 in 5+ unit buildings).
- At $1,798/mo this rent would consume 51% of the median local household income ($42k/yr) (locally 853% of renters already pay >50% of income on rent) — very limited rent-growth headroom before tenants either downsize or default.
Forward outlook
- Local home prices are declining (-3.0%/yr); year-one equity from $1k of loan paydown is wiped out by about $6k of value loss. Plan a longer hold.
- Jackson County population projected at +4% by 2050 — modest demand growth; plan on rents tracking national, not racing it.
- At projected returns (-3.0% appreciation + 8.0% rent growth), your $56k cash investment doubles in ~10 years — after that, you're playing with house money.
Negotiation context
- It's been on market 35 days — a 3% lower offer ($194k) is reasonable based on typical stale-listing flexibility.
- 5 sale attempts since 21y ago with the ask held roughly flat each time — persistent listings suggest the price (not the market) is what's stuck; bring a comps-based counter.
Risks & watch-outs
- Watch-outs: built in 1912 — expect roof / HVAC / electrical / plumbing capex.
Questions for the listing agent
- It's been on market 35 days. Have you received any prior offers? Is the seller open to a 10% concession, seller financing, or rate buy-down credit?
- Built in 1912 — when were the roof, HVAC, electrical panel, plumbing, and water heater last replaced?
- Is there a deadline driving the sale (1031 exchange, divorce, estate, relocation)? That informs how much negotiation room exists.
- Crime grade is F in this area — have there been break-ins, vandalism, or insurance claims at this property in the last 3 years? What carrier currently insures it and at what premium?
- What's the average days-on-market for RENTAL listings here right now (not sales)? A rising rental-DOM trend means longer vacancies and softer asking-rent achievability than the comps imply.
- What's the recent tenant-quality profile in this submarket — average credit score on applications, eviction rate, late-payment / NSF rate, and stable-employment percentage? A property-management company in the area should have these aggregated.
- How much new for-sale + rental construction is in the pipeline within 1–3 miles? Heavy new supply typically softens prices + rents 12–24 months out; constrained supply supports both.
Investment metrics
- 1% rule
- 0.90% ✗
- Cap rate
- 7.27%
- Cash-on-cash
- 3.47%
- DSCR
- 1.15
- GRM
- 9.3
CMA / ARV
- ARV (median comp)
- $296,645
- List price
- $199,900
- Delta
- -32.61%
- Verdict
- UNDERPRICED
- Comps
- 20 within 1.0 mi
Show comp detail 12 sales within ~0.75 mi
| Address | Dist | Beds/Ba | Sqft | Sold | Price | $/sf | Match |
|---|---|---|---|---|---|---|---|
| 3928 Forest Ave | 0.21mi | 4/3.0 (+1) | 2,101 (-0%) | 2mo | $340,000 | $162 | 83 |
| 3915 Highland Ave | 0.27mi | 4/3.0 (+1) | 2,000 (-5%) | 2mo | $280,500 | $140 | 72 |
| 820 E 41st St | 0.47mi | 4/2.5 (+1) | 2,124 (+1%) | 0mo | $370,000 | $174 | 70 |
| 4332 Harrison St | 0.72mi | 3/2.5 | 2,100 (-0%) | 2mo | $399,000 | $190 | 62 |
| 3669 Harrison Blvd | 0.29mi | 4/2.5 (+1) | 2,294 (+9%) | 4mo | $499,000 | $218 | 62 |
| 3937 Campbell St | 0.36mi | 3/1.5 | 2,296 (+9%) | 4mo | $284,900 | $124 | 60 |
| 3937 Highland Ave | 0.30mi | 4/2.5 (+1) | 1,850 (-12%) | 1mo | $282,500 | $153 | 58 |
| 4114 Charlotte St | 0.54mi | 4/1.5 (+1) | 2,045 (-3%) | 4mo | $200,000 | $98 | 56 |
| 4009 Locust St | 0.67mi | 3/2.5 | 1,904 (-10%) | 1mo | $345,000 | $181 | 50 |
| 4226 Charlotte St | 0.66mi | 3/1.5 | 1,876 (-11%) | 1mo | $315,000 | $168 | 44 |
| 1319 E 32nd Ter | 0.72mi | 3/2.0 | 1,858 (-12%) | 3mo | $175,000 | $94 | 40 |
| 4436 Tracy Ave | 0.74mi | 3/2.5 | 1,797 (-15%) | 2mo | $429,900 | $239 | 37 |
Match score weights: distance 35% · size 25% · config 20% · recency 20%. Top-matched comps best support the ARV.
Projected returns pro-forma
-3.0% appreciation · 8.0% rent growth · sell at horizon
- IRR
- -5.8%
- Equity multiple
- 0.77×
- Total profit
- $-12,626
- Equity at exit
- $29,806
- IRR
- 8.7%
- Equity multiple
- 1.81×
- Total profit
- $45,327
- Equity at exit
- $17,284
Cash invested: $55,972 (down + closing). Projections, not guarantees.
Landlord ↔ Tenant lean methodology
- Overall (STATE)
- 81 Strongly Landlord-Friendly
- State Missouri
- 81 Strongly Landlord-Friendly · R+10
- County
- — inherits STATE
- City
- — inherits STATE
ZIP-level market 64109
- Rents YoY
- 9.5%
- Active inventory
- 97
- Price-to-rent
- 9.3×
Monthly cashflow live
- Estimated rent
- $1,798 high interval (Pro) →
- Mortgage (P&I)
- −$1,048
- Tax from tax record
- −$126 /mo · $1,518/yr
- Insurance
- −$83
- HOA
- −$0
- Vacancy / Maint / Mgmt
- −$377
- Net cashflow
- $162
Break-even live
UW: 25.0% down · 7.5% · 30yr · 1.5% tax · 5.0% vac · 8.0% maint · 8.0% mgmt
Financing live
Cash to close
- Down payment
- $49,975
- Closing costs
- $5,997
- Reserves months
- —
- Total cash needed
- —
Loan-product check · same deal, 3 products live
Conventional
25% down · 7.5% · 30yr
- Down + closing
- —
- Monthly P&I
- —
- Monthly cashflow
- —
- DSCR
- —
- Eligible?
- —
Personal DTI + credit; lowest rate.
DSCR
20% down · 8.5% · 30yr
- Down + closing
- —
- Monthly P&I
- —
- Monthly cashflow
- —
- DSCR
- —
- Eligible?
- —
No personal income docs; deal must DSCR.
Hard money
10% down · 12.0% · 12mo
- Down + closing
- —
- Monthly P&I
- —
- Monthly cashflow
- —
- DSCR
- —
- Eligible?
- —
Short-term bridge; refi at stabilization.
Rent comps 30 comps
| Address | Beds | Baths | Sqft | Rent | $/sqft | DOM | Units | Dist |
|---|---|---|---|---|---|---|---|---|
| 4031 Campbell St Kansas City, MO | 4.0 | 1.5 | 2074 | $2,500 | $1.21 | 16d | 1 | 0.43mi |
| 4211 Woodland Ave Kansas City, MO | 4.0 | 2.5 | 1926 | $2,010 | $1.04 | 16d | 1 | 0.58mi |
| 2002 E 35th St Kansas City, MO | 3.0 | 2.0 | 1426 | $1,295 | $0.91 | 7d | 1 | 0.61mi |
| 4219 Woodland Ave Kansas City, MO | 4.0 | 2.0 | 1566 | $1,900 | $1.21 | 2d | 1 | 0.61mi |
| 2018 E 35th St Kansas City, MO | 3.0 | 2.0 | 1502 | $1,800 | $1.20 | 3d | 1 | 0.63mi |
| 4112 Park Ave Kansas City, MO | 4.0 | 2.0 | 1700 | $1,800 | $1.06 | 14d | 1 | 0.68mi |
| 3902 Wabash Ave Kansas City, MO | 4.0 | 2.0 | 1400 | $1,850 | $1.32 | 43d | 1 | 0.71mi |
| 404 E 41st St Kansas City, MO | 4.0 | 3.0 | 1711 | $2,650 | $1.55 | 20d | 1 | 0.76mi |
| 3434 Olive St Kansas City, MO | 3.0 | 2.0 | 2020 | $1,445 | $0.72 | 43d | 1 | 0.79mi |
| 4138 Locust St Kansas City, MO | 4.0 | 2.0 | 1763 | $2,600 | $1.47 | 7d | 1 | 0.80mi |
| 4018 Prospect Ave Kansas City, MO | 4.0 | 1.5 | 1900 | $1,695 | $0.89 | 43d | 1 | 0.80mi |
| 3333 Gillham Rd Kansas City, MO | 4.0 | 2.0 | 1500 | $2,000 | $1.33 | 14d | 1 | 0.82mi |
| 3830 Warwick Blvd Unit 1S Kansas City, MO | 3.0 | 2.0 | 1500 | $1,600 | $1.07 | 14d | 1 | 0.86mi |
| 3434 Chestnut Ave Kansas City, MO | 2.0 | 1.0 | 1512 | $1,100 | $0.73 | 10d | 1 | 1.00mi |
| 3630 Agnes Ave Kansas City, MO | 3.0 | 2.0 | 1448 | $1,500 | $1.04 | 10d | 1 | 1.03mi |
| 4511 Park Ave Kansas City, MO | 4.0 | 2.5 | 1915 | $1,982 | $1.03 | 23d | 1 | 1.04mi |
| 4119 S Benton Ave Kansas City, MO | 4.0 | 2.0 | 1700 | $1,800 | $1.06 | 43d | 1 | 1.05mi |
| 3840 Bellefontaine Ave Kansas City, MO | 3.0 | 1.0 | 1500 | $1,500 | $1.00 | 16d | 1 | 1.07mi |
| 3346 Agnes Ave Kansas City, MO | 3.0 | 1.0 | 1400 | $1,200 | $0.86 | 7d | 1 | 1.15mi |
| 2901 Charlotte St Kansas City, MO | 2.0 | 1.0 | 1700 | $1,700 | $1.00 | 12d | 1 | 1.24mi |
| 3419 College Ave Kansas City, MO | 4.0 | 1.0 | 1608 | $1,300 | $0.81 | 2d | 1 | 1.32mi |
| 2729 Grove St Kansas City, MO | 3.0 | 2.0 | 1510 | $1,375 | $0.91 | 43d | 1 | 1.34mi |
| 3739 Bales Ave Kansas City, MO | 3.0 | 2.0 | 1400 | $1,575 | $1.12 | 23d | 1 | 1.35mi |
| 3420 Broadway Blvd Kansas City, MO | 1.0–3.0 | 1.0–2.0 | 1043 | $2,160 | $2.07 | 23d | 2 | 1.36mi |
| 3040 Baltimore Ave Kansas City, MO | 2.0 | 1.0–2.0 | 1363 | $5,999 | $4.40 | 1d | 75 | 1.42mi |
| 2980 Baltimore Ave Kansas City, MO | 2.0 | 2.0 | 1225 | $2,354 | $1.92 | 43d | 5 | 1.47mi |
| 641 W 39th Ter Kansas City, MO | 3.0 | 2.5 | 2187 | $2,790 | $1.28 | 7d | 1 | 1.47mi |
| 2715 Holmes St Kansas City, MO | 3.0 | 2.0 | 1848 | $2,095 | $1.13 | 16d | 1 | 1.47mi |
| 3205 E 31st St Kansas City, MO | 4.0 | 1.0 | 1800 | $1,325 | $0.74 | 23d | 1 | 1.47mi |
| 551 W 44th St Kansas City, MO | 1.0–3.0 | 1.0–3.5 | 1293 | $4,866 | $3.76 | 2d | 12 | 1.50mi |
Listing history 30 events
-
2026-06-18days on market $199,900 Active 35 DOM
-
2026-06-17days on market $199,900 Active 34 DOM
-
2026-06-16days on market $199,900 Active 33 DOM
-
2026-06-15pricedays on market $199,900 Active 32 DOM
-
2026-06-13days on market $209,900 Active 30 DOM
-
2026-06-09days on market $209,900 Active 26 DOM
-
2026-06-08days on market $209,900 Active 25 DOM
-
2026-06-07days on market $209,900 Active 24 DOM
-
2026-06-05days on market $209,900 Active 21 DOM
-
2026-06-03days on market $209,900 Active 20 DOM
-
2026-06-02days on market $209,900 Active 19 DOM
-
2026-06-01days on market $209,900 Active 18 DOM
-
2026-05-31days on market $209,900 Active 17 DOM
-
2026-05-14$209,900 Active 754-char remark
-
2022-04-27price $1,575
-
2012-10-24historical
-
2012-06-08$47,000
-
2010-02-12soldstatus
-
2010-02-09soldstatus
Show marketing remark (283 chars)
This house has huge potential with its size and location. Carpet in good condition, bathrooms all have tile, and kitchen has newer cabinets and counter tops. Lots of living space. 4 bedrooms plus one bonus room for study or playroom off bedroom. 3 large full bathrooms plus 1/2 bath.
-
2009-09-19$69,000
Show marketing remark (283 chars)
This house has huge potential with its size and location. Carpet in good condition, bathrooms all have tile, and kitchen has newer cabinets and counter tops. Lots of living space. 4 bedrooms plus one bonus room for study or playroom off bedroom. 3 large full bathrooms plus 1/2 bath.
-
2008-12-22historical
-
2008-08-27$94,900
-
2007-07-11soldstatus
-
2005-09-30soldstatus
-
2005-06-24$69,900
-
2004-04-05soldstatus
-
2004-04-05soldstatus
-
2003-10-16soldstatus
-
2003-10-16soldstatus
-
1995-08-02soldstatus
ⓘ Source: listings_history table (triggers on properties + properties_extension) + one-shot
backfill from property_details.listing_events for pre-trigger history.
Tax reassessment forecast MO · Resets to sale price
- Current annual tax
- $1,518 · $126/mo
- Projected year-2 tax
- $1,939 · $162/mo
- Expected delta
- +$421/yr (+$35/mo · 27.8%)
ⓘ Screening estimate from a state-policy table — verify with the county assessor before closing.
Climate risk First Street
- Flood 1/10 Low FEMA zone X (unshaded) · 0% chance over 30 yrs
- Wildfire 1/10 Low
- Heat 4/10 Moderate 7 d/yr ≥106°F today · 17 d/yr by 30 yrs out
- Wind 2/10 Low
- Air quality 3/10 Moderate 2 unhealthy d/yr today · 3 by 30 yrs out
Nearby sold comps map
Loading sold comps map…
Walkable amenities ~0.75 mi
Loading nearby amenities…
Taxation est. · year 1
- Rental income
- $21,570
- − Mortgage interest
- −$11,198
- − Property taxes
- −$1,518
- − Insurance
- −$1,000
- − Repairs & maintenance
- −$1,726
- − Management
- −$1,726
- − Depreciation
- −$5,815
- Taxable loss
- −$1,411
- Est. tax savings @ 24.0%
- +$339
- After-tax cash flow
- $2,282/yr
For passive investors: Depreciation is non-cash, so a rental often shows a tax loss while cash-flowing — sheltering income. Rental losses are passive: they offset passive income freely, and up to $25,000/yr can offset ordinary (W-2) income if you actively participate and your MAGI is under $100k (phasing out to $0 by $150k); unused losses carry forward. On sale, claimed depreciation is recaptured at up to 25%, and gains may owe capital-gains tax (a 1031 exchange can defer both). Figures are a year-1 estimate at your 24.0% rate — not tax advice; consult a CPA.
Schools (NCES district)
- District
- Kansas City 33
- NCES district ID
- 2916400
- Math proficiency
- 12% ▼ -8.00%
- Reading proficiency
- 24% ▬ 0.00%
- Median HH income
- $35,227
- Composite
- 14.8/100
- National rank
- #9387
- State rank
- #308 of 324 in MO
Livability — Kansas City
- Score
- 78/100
- State rank
- #28
- US rank
- #2671
Category grades
Schools grade is shown separately in the Schools card above.
Census & demographics
- Census place
- Kansas City, MO
- County
- Jackson County · 687,798 people
- City population
- 439,467
- Metro
- Kansas City, MO-KS
- Population (ZIP)
- 10,043
- Household income
- $41,943
- Rent vs Own
- Severe rent burden
- 853.0
Population outlook (Jackson County) Hauer SSP2
- Today (2025)
- 719,589 people
- By 2030
- 731,456 · +1.6%
- By 2040
- 746,689 · +3.8%
- By 2050
- 749,289 · +4.1%
- By 2075
- 736,227 · +2.3%
- By 2100
- 668,210 · -7.1%
Race, ethnicity, and origin ACS 2023
- Neighborhood character
- Diverse neighborhood (Simpson 0.64)
- Race & ethnicity
- Black 45% White 39% Hispanic / Latino 9% Two or more races 4% Asian 2%
- Hispanic origin (detail)
- Mexican 7%
- Common ancestry
- Slovak 1% Romanian 1% Lithuanian 1%
- Foreign-born
- 7% · Canada, Philippines, China
- Languages at home
- 88% English-only · Spanish 5% Other Asian/Pacific 3% Arabic 1%
Political lean MEDSL · Jackson
- 2024 margin
- D (+19.3) · D 58.9% · R 39.5% · Other 1.6%
- 2008→2024 swing
- -6.1pp toward R · 2008: 25.4pp · 2024: 19.3pp
- All cycles
- 2024: D+19.3 2020: D+22.0 2016: D+16.6 2012: D+19.0 2008: D+25.4
Not yet ingested
- Civics
- —
Market trends
- HPI YoY
- ▼ -275.12%
- Current HPI
- 243.6094
- Rent YoY
- ▲ 9.50%
- Metro
- Kansas City, MO-KS
- State GDP YoY
- ▲ 1.84%
- F500 in state
- 20
Industry mix (Fortune 500 HQ in MO)
| Industry | F500 HQs | Revenue |
|---|---|---|
| Healthcare | 1 | $163B |
|
||
| Insurance | 1 | $21B |
|
||
| Industrial Technology | 1 | $17B |
|
||
| Retail | 1 | $16B |
|
||
| Industrial Distribution | 1 | $10B |
|
||
| Utilities | 1 | $9B |
|
||
Price history
+186.0% since first listed18 events — show timeline
- 2026-06-14 Price Changed $199,900 Heartland MLS as Distributed by MLS Grid
- 2026-05-14 Listed $209,900 Heartland MLS as Distributed by MLS Grid
- 2022-04-27 Price Changed $1,575 RENT.
- 2012-10-24 Listing Removed — Heartland MLS as Distributed by MLS Grid
- 2012-06-08 Listed $47,000 Heartland MLS as Distributed by MLS Grid
- 2010-02-12 Sold (Public Records) — Public Records
- 2010-02-09 Sold (MLS) — Heartland MLS as Distributed by MLS Grid
- 2009-09-19 Listed $69,000 Heartland MLS as Distributed by MLS Grid
- 2008-12-22 Listing Removed — Heartland MLS as Distributed by MLS Grid
- 2008-08-27 Listed $94,900 Heartland MLS as Distributed by MLS Grid
- 2007-07-11 Sold (Public Records) — Public Records
- 2005-09-30 Sold (MLS) — Heartland MLS as Distributed by MLS Grid
- 2005-06-24 Listed $69,900 Heartland MLS as Distributed by MLS Grid
- 2004-04-05 Sold (Public Records) — Public Records
- 2004-04-05 Sold (Public Records) — Public Records
- 2003-10-16 Sold (Public Records) — Public Records
- 2003-10-16 Sold (Public Records) — Public Records
- 1995-08-02 Sold (Public Records) — Public Records
Property tax history
+8.6%/yrLatest (2025): $1,518 · -2.9% YoY. Source: county tax records.
Cash-flow waterfall
monthlySold comps — $/sqft
last 12 mo · ≤1 miLoading sold comps…