5605 W Metaline #11 Ave #11 · Kennewick, WA
Flood risk 1/10 · Minimal
- FEMA flood zone
- X
- Chance of flooding over 30 yrs
- 0.0%
- Est. flood insurance / yr
- $507 – $1,088
Fire risk 1/10 · Minimal
- Est. fire insurance / yr
- $604 – $1,122
Heat risk 5/10 · Moderate
- Hot days now (above 98°F)
- 7 days/yr
- Hot days in 30 yrs
- 15 days/yr
Wind risk 1/10 · Minimal
- Chance of severe wind over 30 yrs
- —
Air-quality risk 8/10 · Major
- Unhealthy air days now
- 14 days/yr
- Unhealthy air days in 30 yrs
- 15 days/yr
Risk factors via First Street. Map © Google.
Why this score? — see what drove the B+ grade
The composite is a weighted blend of 9 inputs, each scored 0–100. Each bar is that input's sub-score; the figure is the points it added to the 100-point composite (weight × sub-score).
- Cash flow +30.0/30.0
- ARV discount +15.0/15.0
- DSCR +10.0/10.0
- 1% rule +7.6/10.0
- Schools +4.6/10.0
- Livability +3.9/5.0
- Rent growth +3.3/5.0
- Condition / age +2.5/5.0
- Appreciation +0.0/10.0
$155,000
🖨 Deal sheet 📄 Offer letter ✓ Due diligence
Listing remarks MLS
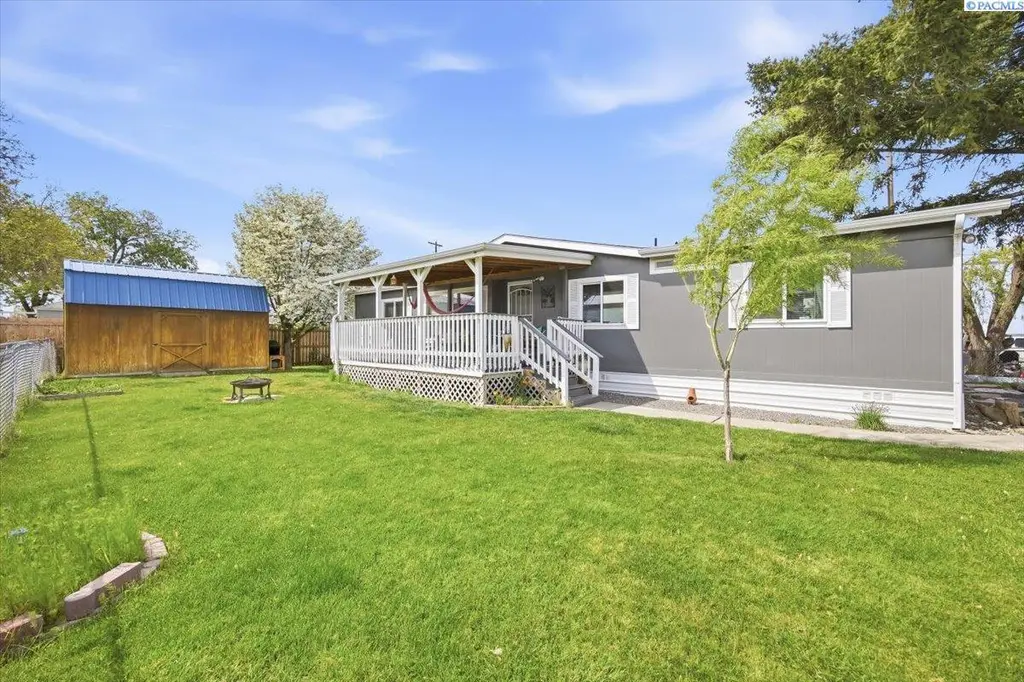
Beautiful 2008 Valley Mobile Home that was a demo model and was lived in for only 4 years! This 56x27 ft home features 3 bedrooms, 2 bathrooms, including a master suite with walk-in closet, entry and dining room with new acaia wood flooring, separate living room and family room, open and spacious kitchen with oak cabinetry, upgraded dishwasher, refrigerator plumbed for water dispenser, and laundry room off kitchen. Windows have 1/8" glass, which makes the home very quiet. Outside you will enjoy a custom porch, all around gutters, fiber rock siding, dedicated 30 and 20 amp service, plenty of parking, fenced yard, and a 12x18 hickory shed with a blue metal roof that matches the home, 2 over-head lofts, a work bench and inside lighting.
Key facts
- Built 2008
- Listed 4 days
Property features AI
Finance
- Financial info: Annual tax: $684.75
Exterior
- Parking: No garage; Off-street parking
- Utilities: Public water; Electricity connected / electric on property; Septic tank
- Home design: Manufactured home (double wide); One-level; New construction
- Construction: Composition roof; Block foundation; Manufactured home make: Valley Quality 56x27
- Exterior features: Deck; Full yard fencing; Shed(s)
Interior
- Kitchen: Dishwasher; Disposal; Range
- Bedrooms: Master bedroom on main level
- Flooring: Carpet; Laminate; Vinyl
- Bathrooms: 2 full bathrooms
- Heating & cooling: Central air (electric); Forced air heating
- Interior features: Breakfast bar; Laminate countertops; Vaulted ceilings; Master bedroom on main level
- Laundry & utility: Dedicated laundry room
Neighborhood map
What this means for you Summary
Snapshot
- This is a 4-bed/2.0-bath manufactured listed at $155k.
Deal economics
- At list price, monthly cash flow is $624 ($7k/yr) — positive.
- The deal already cash-flows at list — no discount required.
- Meets the 1% rule at list price ($2k rent vs $155k).
- Cap rate 11.1% vs local median 3.3% in Kennewick — top-decile yield for the area; either an underpriced asset or a hidden risk that comps aren't pricing in. Stress-test before assuming the spread holds.
Location & tenants
- Location reads 78/100 on livability (#131 in WA, #2,599 nationally) — a middle-class / working-renter tenant base. Strengths: commute A+, housing A+, health & safety A; Watch: schools D+, amenities D+, crime F.
- Kennewick School District (urban): math 43% / reading 58% proficiency, ranked #141 of 291 in WA (top 48%) — acceptable for families but not a draw, mixed tenant base, ~2y average lease.
- Market conditions: Rents rising (+3.4%/yr); 286 active listings in the ZIP; 16 comparable units currently listed for rent nearby; rentals at typical pace (median 21d on market — plan ~3-4 weeks tenant-placement turnaround); 44% of comp listings sitting > 30 days — soft ceiling on asking rent; 1,532 units permitted in Benton County in 2024 (389 in 5+ unit buildings).
- This rent runs 37% of the median local income ($63k/yr) — at the standard rent-burdened threshold; future hikes will face affordability resistance.
Forward outlook
- Local home prices are declining (-3.0%/yr); year-one equity from $1k of loan paydown is wiped out by about $5k of value loss. Plan a longer hold.
- Benton County population projected at +32% by 2050 — long-run rental-demand tailwind backs the buy-and-hold thesis.
- At projected returns (-3.0% appreciation + 3.4% rent growth), your $43k cash investment doubles in ~7 years — after that, you're playing with house money.
Negotiation context
- Only 4 days on market — expect competitive offers; lowballing is unlikely to land.
- 2 sale attempts since 9y ago with the ask held roughly flat each time — persistent listings suggest the price (not the market) is what's stuck; bring a comps-based counter.
- Current owner paid $70k; list at $155k implies a 120% gain — meaningful room to come down on a strong offer.
Risks & watch-outs
- Climate carrying-cost: extreme-heat days projected 7→15/yr by 2055 (HVAC capex compounding) — expect insurance premiums to compound above CPI over the hold.
Questions for the listing agent
- Is there a deadline driving the sale (1031 exchange, divorce, estate, relocation)? That informs how much negotiation room exists.
- Schools are D-rated, which usually means shorter tenancies and higher turnover. Who's the typical renter profile here, and what's been the actual vacancy rate?
- Crime grade is F in this area — have there been break-ins, vandalism, or insurance claims at this property in the last 3 years? What carrier currently insures it and at what premium?
- What's the average days-on-market for RENTAL listings here right now (not sales)? A rising rental-DOM trend means longer vacancies and softer asking-rent achievability than the comps imply.
- What's the recent tenant-quality profile in this submarket — average credit score on applications, eviction rate, late-payment / NSF rate, and stable-employment percentage? A property-management company in the area should have these aggregated.
- How much new for-sale + rental construction is in the pipeline within 1–3 miles? Heavy new supply typically softens prices + rents 12–24 months out; constrained supply supports both.
Investment metrics
- 1% rule
- 1.26% ✓
- Cap rate
- 11.13%
- Cash-on-cash
- 17.27%
- DSCR
- 1.77
- GRM
- 6.6
CMA / ARV
- ARV (median comp)
- $218,386
- List price
- $155,000
- Delta
- -29.02%
- Verdict
- UNDERPRICED
- Comps
- 2 within 1.0 mi
Show comp detail 3 sales within ~0.75 mi
| Address | Dist | Beds/Ba | Sqft | Sold | Price | $/sf | Match |
|---|---|---|---|---|---|---|---|
| 5605 W Metaline Ave #9 Ave #9 | 0.00mi | 3/2.0 (-1) | 1,536 (+2%) | 14mo | $149,900 | $98 | 81 |
| 4726 W Hood Ave | 0.55mi | 3/2.0 (-1) | 1,512 (0%) | 17mo | $305,000 | $202 | 55 |
| 4705 W Grand Ronde Ave | 0.63mi | 3/2.0 (-1) | 1,428 (-6%) | 8mo | $300,000 | $210 | 50 |
Match score weights: distance 35% · size 25% · config 20% · recency 20%. Top-matched comps best support the ARV.
Projected returns pro-forma
-3.0% appreciation · 3.39% rent growth · sell at horizon
- IRR
- 9.0%
- Equity multiple
- 1.35×
- Total profit
- $15,356
- Equity at exit
- $23,111
- IRR
- 18.4%
- Equity multiple
- 2.56×
- Total profit
- $67,491
- Equity at exit
- $13,402
Cash invested: $43,400 (down + closing). Projections, not guarantees.
Landlord ↔ Tenant lean methodology
- Overall (STATE)
- 28 Tenant-Leaning
- State Washington
- 28 Tenant-Leaning · D+8
- County
- — inherits STATE
- City
- — inherits STATE
ZIP-level market 99336
- Rents YoY
- 3.4%
- Active inventory
- 286
- Price-to-rent
- 6.6×
Monthly cashflow live
- Estimated rent
- $1,949 high interval (Pro) →
- Mortgage (P&I)
- −$813
- Tax from tax record
- −$38 /mo · $456/yr
- Insurance
- −$65
- HOA
- −$0
- Vacancy / Maint / Mgmt
- −$409
- Net cashflow
- $624
Break-even live
UW: 25.0% down · 7.5% · 30yr · 1.5% tax · 5.0% vac · 8.0% maint · 8.0% mgmt
Financing live
Cash to close
- Down payment
- $38,750
- Closing costs
- $4,650
- Reserves months
- —
- Total cash needed
- —
Loan-product check · same deal, 3 products live
Conventional
25% down · 7.5% · 30yr
- Down + closing
- —
- Monthly P&I
- —
- Monthly cashflow
- —
- DSCR
- —
- Eligible?
- —
Personal DTI + credit; lowest rate.
DSCR
20% down · 8.5% · 30yr
- Down + closing
- —
- Monthly P&I
- —
- Monthly cashflow
- —
- DSCR
- —
- Eligible?
- —
No personal income docs; deal must DSCR.
Hard money
10% down · 12.0% · 12mo
- Down + closing
- —
- Monthly P&I
- —
- Monthly cashflow
- —
- DSCR
- —
- Eligible?
- —
Short-term bridge; refi at stabilization.
Rent comps 16 comps
| Address | Beds | Baths | Sqft | Rent | $/sqft | DOM | Units | Dist |
|---|---|---|---|---|---|---|---|---|
| 5100 W Clearwater Ave Kennewick, WA | 1.0–3.0 | 1.0–2.0 | 1068 | $1,843 | $1.72 | 13d | 6 | 0.49mi |
| 720 N Arthur St Kennewick, WA | 3.0 | 1.5 | 1200 | $1,545 | $1.29 | 13d | 9 | 0.51mi |
| 100 N Irving Pl Unit H101 Kennewick, WA | 3.0 | 1.5 | 1120 | $1,699 | $1.52 | 44d | 1 | 0.56mi |
| 100 N Irving Pl Unit K101 Kennewick, WA | 3.0 | 1.5 | 1120 | $1,700 | $1.52 | 44d | 1 | 0.56mi |
| 100 N Irving Pl Kennewick, WA | 1.0–3.0 | 1.0–1.5 | 939 | $1,750 | $1.86 | 13d | 11 | 0.56mi |
| 33 N Jefferson Pl Unit 110 Kennewick, WA | 3.0 | 2.5 | 1536 | $1,950 | $1.27 | 43d | 1 | 0.61mi |
| 5702 W Kennewick Pl #110 Kennewick, WA | 3.0 | 2.5 | 1435 | $1,695 | $1.18 | 13d | 1 | 0.61mi |
| 318 N Arthur St Kennewick, WA | 2.0–3.0 | 2.0 | 1113 | $1,975 | $1.77 | 13d | 1 | 0.62mi |
| 1148 N Yost St Kennewick, WA | 3.0 | 2.5 | 1324 | $1,863 | $1.41 | 21d | 1 | 0.64mi |
| 440 N Volland St Kennewick, WA | 1.0–3.0 | 1.0–1.5 | 958 | $1,600 | $1.67 | 13d | 7 | 0.85mi |
| 24 S Quay St Unit 3 Kennewick, WA | 3.0 | 1.5 | 1128 | $1,625 | $1.44 | 13d | 1 | 0.91mi |
| 4215 W 2nd Ave Kennewick, WA | 3.0 | 2.0 | 1348 | $2,595 | $1.93 | 43d | 1 | 1.14mi |
| 7113 W Arrowhead Ave Kennewick, WA | 3.0 | 2.0 | 1848 | $2,595 | $1.40 | 13d | 1 | 1.26mi |
| 3910 W Kennewick Ave Unit 3910 Kennewick, WA | 3.0 | 1.5 | 1645 | $1,800 | $1.09 | 43d | 1 | 1.27mi |
| 722 S Union St Kennewick, WA | 4.0 | 2.0 | 2181 | $2,295 | $1.05 | 43d | 1 | 1.38mi |
| 717 S Union St Kennewick, WA | 3.0 | 1.0 | 1340 | $1,895 | $1.41 | 43d | 1 | 1.39mi |
Listing history 4 events
-
2026-05-04status Pending 620-char remark
-
2026-04-30$155,000 Active 620-char remark
-
2017-11-16soldstatus $70,500 748-char remark
Show marketing remark (748 chars)
Beautiful 2008 Valley Mobile Home that was a demo model and was lived in for only 4 years! This 56x27 ft home features 3 bedrooms, 2 bathrooms, including a master suite with walk-in closet, entry and dining room with new acaia wood flooring, separate living room and family room, open and spacious kitchen with oak cabinetry, upgraded dishwasher, refrigerator plumbed for water dispenser, and laundry room off kitchen. Windows have 1/8" glass, which makes the home very quiet. Outside you will enjoy a custom porch, all around gutters, fiber rock siding, dedicated 30 and 20 amp service, plenty of parking, fenced yard, and a 12x18 hickory shed with a blue metal roof that matches the home, 2 over-head lofts, a work bench and inside lighting.
-
2017-10-04$73,000 748-char remark
Show marketing remark (748 chars)
Beautiful 2008 Valley Mobile Home that was a demo model and was lived in for only 4 years! This 56x27 ft home features 3 bedrooms, 2 bathrooms, including a master suite with walk-in closet, entry and dining room with new acaia wood flooring, separate living room and family room, open and spacious kitchen with oak cabinetry, upgraded dishwasher, refrigerator plumbed for water dispenser, and laundry room off kitchen. Windows have 1/8" glass, which makes the home very quiet. Outside you will enjoy a custom porch, all around gutters, fiber rock siding, dedicated 30 and 20 amp service, plenty of parking, fenced yard, and a 12x18 hickory shed with a blue metal roof that matches the home, 2 over-head lofts, a work bench and inside lighting.
ⓘ Source: listings_history table (triggers on properties + properties_extension) + one-shot
backfill from property_details.listing_events for pre-trigger history.
Tax reassessment forecast WA · Resets to sale price
- Current annual tax
- $456 · $38/mo
- Projected year-2 tax
- $1,519 · $127/mo
- Expected delta
- +$1,063/yr (+$89/mo · 232.8%)
ⓘ Screening estimate from a state-policy table — verify with the county assessor before closing.
Climate risk First Street
- Flood 1/10 Low FEMA zone X · 0% chance over 30 yrs
- Wildfire 1/10 Low
- Heat 5/10 Major 7 d/yr ≥98°F today · 15 d/yr by 30 yrs out
- Wind 1/10 Low
- Air quality 8/10 Severe 14 unhealthy d/yr today · 15 by 30 yrs out
Nearby sold comps map
Loading sold comps map…
Walkable amenities ~0.75 mi
Loading nearby amenities…
Taxation est. · year 1
- Rental income
- $23,391
- − Mortgage interest
- −$8,682
- − Property taxes
- −$456
- − Insurance
- −$775
- − Repairs & maintenance
- −$1,871
- − Management
- −$1,871
- − Depreciation
- −$4,509
- Taxable income
- $5,225
- Est. tax owed @ 24.0%
- −$1,254
- After-tax cash flow
- $6,239/yr
For passive investors: Depreciation is non-cash, so a rental often shows a tax loss while cash-flowing — sheltering income. Rental losses are passive: they offset passive income freely, and up to $25,000/yr can offset ordinary (W-2) income if you actively participate and your MAGI is under $100k (phasing out to $0 by $150k); unused losses carry forward. On sale, claimed depreciation is recaptured at up to 25%, and gains may owe capital-gains tax (a 1031 exchange can defer both). Figures are a year-1 estimate at your 24.0% rate — not tax advice; consult a CPA.
Schools (NCES district)
- District
- Kennewick School District
- NCES district ID
- 5303930
- Math proficiency
- 43% ▼ -1.00%
- Reading proficiency
- 58% ▬ 0.00%
- Median HH income
- $54,191
- Composite
- 45.56/100
- National rank
- #5667
- State rank
- #141 of 291 in WA
Livability — Kennewick
- Score
- 78/100
- State rank
- #131
- US rank
- #2599
Category grades
Schools grade is shown separately in the Schools card above.
Census & demographics
- Census place
- Kennewick, WA
- County
- Benton County · 186,895 people
- City population
- 104,655
- Metro
- Kennewick-Richland, WA
- Population (ZIP)
- 50,735
- Household income
- $62,527
- Rent vs Own
- Severe rent burden
- 2605.0
Population outlook (Benton County) Hauer SSP2
- Today (2025)
- 219,421 people
- By 2030
- 233,813 · +6.6%
- By 2040
- 262,134 · +19.5%
- By 2050
- 290,100 · +32.2%
- By 2075
- 363,525 · +65.7%
- By 2100
- 418,667 · +90.8%
Race, ethnicity, and origin ACS 2023
- Neighborhood character
- Diverse neighborhood (Simpson 0.56)
- Race & ethnicity
- White 55% Hispanic / Latino 37% Two or more races 15% Black 3% Asian 2% Native American 1%
- Hispanic origin (detail)
- Mexican 31% Cuban 2%
- Common ancestry
- Portuguese 4% Slovak 3% Romanian 1%
- Foreign-born
- 16% · Canada, Jamaica
- Languages at home
- 68% English-only · Spanish 29% Arabic 1%
Political lean MEDSL · Benton
- 2024 margin
- Strong R (+21.9) · D 37.7% · R 59.6% · Other 2.7%
- 2008→2024 swing
- +4.2pp toward D · 2008: -26.1pp · 2024: -21.9pp
- All cycles
- 2024: R+21.9 2020: R+21.0 2016: R+26.6 2012: R+27.0 2008: R+26.1
Not yet ingested
- Civics
- —
Market trends
- HPI YoY
- ▼ -408.26%
- Current HPI
- 256.1143
- Rent YoY
- ▲ 3.39%
- Metro
- Kennewick-Richland, WA
- State GDP YoY
- ▲ 4.65%
- F500 in state
- 22
Industry mix (Fortune 500 HQ in WA)
| Industry | F500 HQs | Revenue |
|---|---|---|
| Retail | 2 | $269B |
|
||
| Technology / Retail | 1 | $638B |
|
||
| Technology | 1 | $245B |
|
||
| Telecommunications | 1 | $38B |
|
||
| Food / Beverage | 1 | $36B |
|
||
| Automotive / Trucks | 1 | $34B |
|
||
Price history
+112.3% since first listed4 events — show timeline
- 2026-05-04 Pending — PACMLS
- 2026-04-30 Listed $155,000 PACMLS
- 2017-11-16 Sold (MLS) $70,500 PACMLS
- 2017-10-04 Listed $73,000 PACMLS
Property tax history
-3.5%/yrLatest (2026): $456 · -5.7% YoY. Source: county tax records.
Cash-flow waterfall
monthlySold comps — $/sqft
last 12 mo · ≤1 miLoading sold comps…