3618 Juniper St · Brandon, MI
Flood risk 1/10 · Minimal
- FEMA flood zone
- X (unshaded)
- Chance of flooding over 30 yrs
- 0.0%
- Est. flood insurance / yr
- $473 – $860
Fire risk 3/10 · Minor
- Est. fire insurance / yr
- $784 – $1,456
Heat risk 2/10 · Minimal
- Hot days now (above 95°F)
- 7 days/yr
- Hot days in 30 yrs
- 16 days/yr
Wind risk 2/10 · Minimal
- Chance of severe wind over 30 yrs
- —
Air-quality risk 3/10 · Minor
- Unhealthy air days now
- 2 days/yr
- Unhealthy air days in 30 yrs
- 4 days/yr
Risk factors via First Street. Map © Google.
Why this score? — see what drove the B- grade
The composite is a weighted blend of 9 inputs, each scored 0–100. Each bar is that input's sub-score; the figure is the points it added to the 100-point composite (weight × sub-score).
- Cash flow +30.0/30.0
- 1% rule +10.0/10.0
- DSCR +10.0/10.0
- ARV discount +7.5/15.0
- Schools +3.8/10.0
- Rent growth +2.5/5.0
- Livability +2.5/5.0
- Condition / age +2.5/5.0
- Appreciation +0.0/10.0
$73,900
🖨 Deal sheet 📄 Offer letter ✓ Due diligence
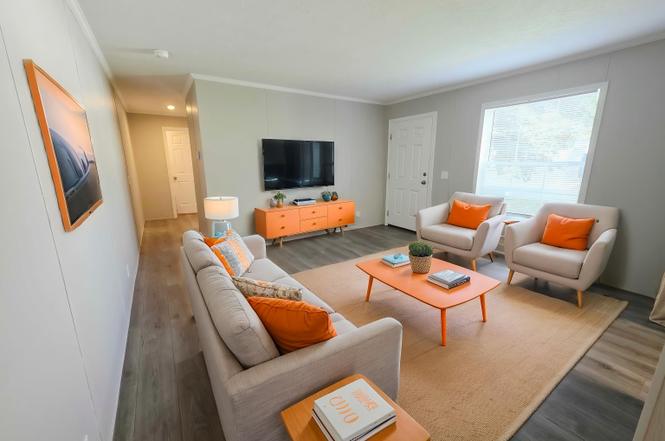
Listing remarks
Step into comfort and style with this beautiful 3 bedroom 2 bathroom home featuring an open concept living room and kitchen. The spacious kitchen includes a large island perfect for entertaining along with ample cabinet space for all your culinary needs. Enjoy year round comfort with energy efficient windows and central air conditioning. Washer and dryer hookups add everyday convenience and an outdoor shed provides extra storage to keep things organized. Schedule your tour today and see the possibilities. Some photos have been virtually staged.
Key facts
- Built 2024
- Listed 166 days
Tags
Property features AI
Finance
- Financial info: List price: $73,900
Exterior
- Home design: Single-section home (3 bed, 2 bath plan); Spec inventory
Interior
- Kitchen: Includes dishwasher, disposal, and refrigerator
- Bedrooms: 3 bedrooms
- Bathrooms: 2 bathrooms
- Interior features: Dishwasher; Disposal; Refrigerator
Neighborhood map
What this means for you Summary
Snapshot
- This is a 3-bed/2.0-bath manufactured listed at $74k.
Deal economics
- At list price, monthly cash flow is $760 ($9k/yr) — positive.
- The deal already cash-flows at list — no discount required.
- Meets the 1% rule at list price ($2k rent vs $74k).
- Recommended offer: $65k (12.0% below list) — sets the bar for market timing.
Location & tenants
- Location reads: area grade B — affects rentability + tenant quality, not the cash-flow math above.
- Brandon School District In The Counties Of Oakland And Lapee (town): math 35% / reading 48% proficiency, ranked #152 of 540 in MI (top 28%) — families likely to look elsewhere, expect single-tenant / working-renter base with shorter leases.
- Market conditions: 147 active listings in the ZIP; 3 comparable units currently listed for rent nearby; rentals leasing fast (median 2d on market — plan ~1-2 weeks tenant-placement turnaround); high-income renter base; 2,614 units permitted in Oakland County in 2024 (721 in 5+ unit buildings).
- This rent is only 15% of the median local income ($129k/yr) — well below the 30% rent-burden line; pricing power to push rent on renewal without tenant pushback.
Forward outlook
- Local home prices are declining (-3.0%/yr); year-one equity from $511 of loan paydown is wiped out by about $2k of value loss. Plan a longer hold.
- Oakland County population projected at +10% by 2050 — modest demand growth; plan on rents tracking national, not racing it.
- At projected returns (-3.0% appreciation + 3.0% rent growth), your $21k cash investment doubles in ~3 years — after that, you're playing with house money.
Negotiation context
- It's been on market 166 days — a 12% lower offer ($65k) is reasonable based on typical stale-listing flexibility.
Questions for the listing agent
- It's been on market 166 days. Have you received any prior offers? Is the seller open to a 12% concession, seller financing, or rate buy-down credit?
- Why hasn't it sold? Are there any deal-killer items the seller is aware of (foundation, flood, title, zoning, code violations)?
- Is there a deadline driving the sale (1031 exchange, divorce, estate, relocation)? That informs how much negotiation room exists.
- What's the average days-on-market for RENTAL listings here right now (not sales)? A rising rental-DOM trend means longer vacancies and softer asking-rent achievability than the comps imply.
- What's the recent tenant-quality profile in this submarket — average credit score on applications, eviction rate, late-payment / NSF rate, and stable-employment percentage? A property-management company in the area should have these aggregated.
- How much new for-sale + rental construction is in the pipeline within 1–3 miles? Heavy new supply typically softens prices + rents 12–24 months out; constrained supply supports both.
Investment metrics
- 1% rule
- 2.18% ✓
- Cap rate
- 18.63%
- Cash-on-cash
- 44.06%
- DSCR
- 2.96
- GRM
- 3.8
CMA / ARV
No comps found within radius.
Projected returns pro-forma
-3.0% appreciation · 3.0% rent growth · sell at horizon
- IRR
- 41.0%
- Equity multiple
- 2.76×
- Total profit
- $36,438
- Equity at exit
- $11,019
- IRR
- 47.3%
- Equity multiple
- 5.55×
- Total profit
- $94,135
- Equity at exit
- $6,390
Cash invested: $20,692 (down + closing). Projections, not guarantees.
Landlord ↔ Tenant lean methodology
- Overall (STATE)
- 62 Landlord-Friendly
- State Michigan
- 62 Landlord-Friendly · EVEN
- County
- — inherits STATE
- City
- — inherits STATE
ZIP-level market 48348
- Active inventory
- 147
- Price-to-rent
- 3.8×
Monthly cashflow live
- Estimated rent
- $1,608 medium interval (Pro) →
- Mortgage (P&I)
- −$388
- Tax est. 1.5%
- −$92 /mo · $1,108/yr
- Insurance
- −$31
- HOA
- −$0
- Vacancy / Maint / Mgmt
- −$338
- Net cashflow
- $760
Break-even live
UW: 25.0% down · 7.5% · 30yr · 1.5% tax · 5.0% vac · 8.0% maint · 8.0% mgmt
Financing live
Cash to close
- Down payment
- $18,475
- Closing costs
- $2,217
- Reserves months
- —
- Total cash needed
- —
Loan-product check · same deal, 3 products live
Conventional
25% down · 7.5% · 30yr
- Down + closing
- —
- Monthly P&I
- —
- Monthly cashflow
- —
- DSCR
- —
- Eligible?
- —
Personal DTI + credit; lowest rate.
DSCR
20% down · 8.5% · 30yr
- Down + closing
- —
- Monthly P&I
- —
- Monthly cashflow
- —
- DSCR
- —
- Eligible?
- —
No personal income docs; deal must DSCR.
Hard money
10% down · 12.0% · 12mo
- Down + closing
- —
- Monthly P&I
- —
- Monthly cashflow
- —
- DSCR
- —
- Eligible?
- —
Short-term bridge; refi at stabilization.
Rent comps 3 comps
| Address | Beds | Baths | Sqft | Rent | $/sqft | DOM | Units | Dist |
|---|---|---|---|---|---|---|---|---|
| 3618 Juniper St Unit 795 Village of Clarkston, MI | 3.0 | 2.0 | 1056 | $1,399 | $1.32 | 2d | 1 | 0.03mi |
| 3628 Birch St Unit 837 Village of Clarkston, MI | 2.0 | 2.0 | 1056 | $1,379 | $1.31 | 2d | 1 | 0.08mi |
| 3684 Willow Ct Unit 747 Village of Clarkston, MI | 3.0 | 2.0 | 1216 | $1,329 | $1.09 | 2d | 1 | 0.08mi |
Listing history 7 events
-
2026-06-18days on market $73,900 Active 166 DOM
-
2026-06-17days on market $73,900 Active 165 DOM
-
2026-06-16days on market $73,900 Active 164 DOM
-
2026-06-15days on market $73,900 Active 163 DOM
-
2026-06-13days on market $73,900 Active 161 DOM
-
2026-06-10remarks 550-char remark
-
2026-06-10$73,900 Active 157 DOM
ⓘ Source: listings_history table (triggers on properties + properties_extension) + one-shot
backfill from property_details.listing_events for pre-trigger history.
Climate risk First Street
- Flood 1/10 Low FEMA zone X (unshaded) · 0% chance over 30 yrs
- Wildfire 3/10 Moderate
- Heat 2/10 Low 7 d/yr ≥95°F today · 16 d/yr by 30 yrs out
- Wind 2/10 Low
- Air quality 3/10 Moderate 2 unhealthy d/yr today · 4 by 30 yrs out
Nearby sold comps map
Loading sold comps map…
Walkable amenities ~0.75 mi
Loading nearby amenities…
Taxation est. · year 1
- Rental income
- $19,298
- − Mortgage interest
- −$4,140
- − Property taxes
- −$1,108
- − Insurance
- −$370
- − Repairs & maintenance
- −$1,544
- − Management
- −$1,544
- − Depreciation
- −$2,150
- Taxable income
- $8,443
- Est. tax owed @ 24.0%
- −$2,026
- After-tax cash flow
- $7,091/yr
For passive investors: Depreciation is non-cash, so a rental often shows a tax loss while cash-flowing — sheltering income. Rental losses are passive: they offset passive income freely, and up to $25,000/yr can offset ordinary (W-2) income if you actively participate and your MAGI is under $100k (phasing out to $0 by $150k); unused losses carry forward. On sale, claimed depreciation is recaptured at up to 25%, and gains may owe capital-gains tax (a 1031 exchange can defer both). Figures are a year-1 estimate at your 24.0% rate — not tax advice; consult a CPA.
Schools (NCES district)
- District
- Brandon School District In The Counties Of Oakland And Lapee
- NCES district ID
- 2606570
- Math proficiency
- 35% ▼ -8.00%
- Reading proficiency
- 48% ▼ -1.00%
- Median HH income
- $73,593
- Composite
- 37.94/100
- National rank
- #4306
- State rank
- #152 of 540 in MI
Livability — Brandon
No livability data for this city. (Only ~50 U.S. cities are tracked.)
Census & demographics
- County
- Oakland County · 1,009,092 people
- Metro
- Detroit-Warren-Dearborn, MI
- Population (ZIP)
- 24,574
- Household income
- $129,410
- Rent vs Own
- Severe rent burden
- 212.0
Population outlook (Oakland County) Hauer SSP2
- Today (2025)
- 1,335,747 people
- By 2030
- 1,375,100 · +2.9%
- By 2040
- 1,435,385 · +7.5%
- By 2050
- 1,469,250 · +10.0%
- By 2075
- 1,531,946 · +14.7%
- By 2100
- 1,450,485 · +8.6%
Race, ethnicity, and origin ACS 2023
- Neighborhood character
- Predominantly White (87%)
- Race & ethnicity
- White 87% Two or more races 6% Hispanic / Latino 5% Black 2% Asian 2%
- Hispanic origin (detail)
- Mexican 2%
- Common ancestry
- Romanian 10% Slovak 4% Lithuanian 3%
- Foreign-born
- 5% · Canada, Vietnam
- Languages at home
- 95% English-only · Spanish 2% French/Haitian/Cajun 1% Other Indo-European 1%
Political lean MEDSL · Oakland
- 2024 margin
- D (+10.6) · D 54.4% · R 43.8% · Other 1.9%
- 2008→2024 swing
- -3.9pp toward R · 2008: 14.5pp · 2024: 10.6pp
- All cycles
- 2024: D+10.6 2020: D+14.1 2016: D+8.1 2012: D+8.1 2008: D+14.5
Not yet ingested
- Civics
- —
Market trends
- HPI YoY
- ▼ -275.65%
- Current HPI
- 196.4302
- Rent YoY
- —
- Metro
- Detroit-Warren-Dearborn, MI
- State GDP YoY
- ▲ 1.37%
- F500 in state
- 28
Industry mix (Fortune 500 HQ in MI)
| Industry | F500 HQs | Revenue |
|---|---|---|
| Automotive Parts | 3 | $48B |
|
||
| Automotive | 2 | $372B |
|
||
| Chemicals | 1 | $45B |
|
||
| Automotive Retail | 1 | $29B |
|
||
| Healthcare / Medical Devices | 1 | $23B |
|
||
| Automotive Technology | 1 | $20B |
|
||
Cash-flow waterfall
monthlySold comps — $/sqft
last 12 mo · ≤1 miLoading sold comps…