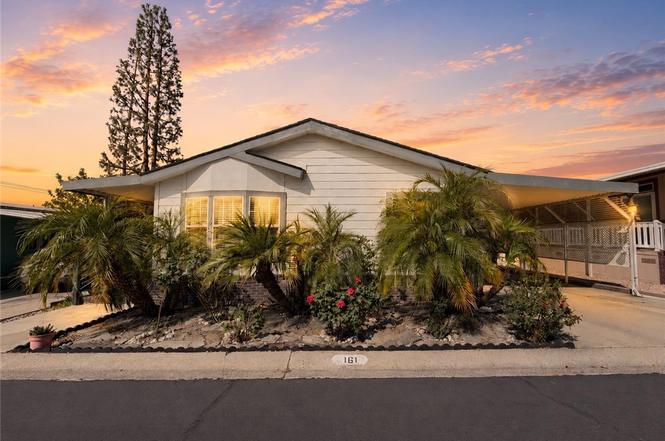
1400 W 13th #161 · Upland, CA
Flood risk 1/10 · Minimal
- FEMA flood zone
- X (unshaded)
- Chance of flooding over 30 yrs
- 0.0%
- Est. flood insurance / yr
- $507 – $1,088
Fire risk 3/10 · Minor
- Est. fire insurance / yr
- $659 – $1,223
Heat risk 7/10 · Major
- Hot days now (above 99°F)
- 6 days/yr
- Hot days in 30 yrs
- 16 days/yr
Wind risk 1/10 · Minimal
- Chance of severe wind over 30 yrs
- —
Air-quality risk 8/10 · Major
- Unhealthy air days now
- 16 days/yr
- Unhealthy air days in 30 yrs
- 19 days/yr
Risk factors via First Street. Map © Google.
Why this score? — see what drove the D grade
The composite is a weighted blend of 9 inputs, each scored 0–100. Each bar is that input's sub-score; the figure is the points it added to the 100-point composite (weight × sub-score).
- Cash flow +18.3/30.0
- DSCR +5.7/10.0
- 1% rule +4.9/10.0
- Schools +4.3/10.0
- Livability +3.6/5.0
- ARV discount +2.5/15.0
- Condition / age +2.5/5.0
- Rent growth +2.4/5.0
- Appreciation +0.0/10.0
$299,900
🖨 Deal sheet (PDF) 📄 Offer letter ✓ Due diligence
Listing remarks MLS
Welcome to the serene El Dorado community, where this charming 3-bed, 2-bath manufactured home awaits its new owners. Perfectly suited for those aged 55 and above, this residence offers a comfortable and convenient lifestyle. Step inside to find a move-in ready haven, complete with a cozy living area ideal for relaxation. The kitchen is thoughtfully designed with ample storage and workspace, inviting culinary exploration. Three bedrooms provide comfortable retreats, with the primary suite boasting its own private bath featuring a soothing soaking tub, perfect for unwinding after a long day. Outside, a lattice enclosure offers a touch of privacy as you enjoy the outdoor space, whether for morning coffee or evening gatherings. Take advantage of community amenities, including access to a pool and spa, providing opportunities for leisure and socializing. Benefit from the stability of rent-controlled living, ensuring peace of mind for the long term. Don't miss out on this opportunity to embrace the easygoing lifestyle offered by this well-maintained mobile home in the sought-after El Dorado community. Schedule your showing today and make it yours!
Key facts
- Relaxing spa
- Clubhouse
- Lattice enclosure
Tags
Property features AI
Finance
- Other: Living area source: assessor's data; Lot classification: 0-1 unit/acre; Elevation units: feet; Park/rental details and assessments: see remarks
- Financial info: Land lease: $1,200 per month (park provided)
- HOA & community: Senior community; Suburban setting; Park name: El Dorado Mobile Home Park; Manager approval required
Exterior
- Parking: Carport with 2 parking spaces
- Utilities: Public/district water; Public sewer; Standard electric; Natural gas available; Cable available; Telephone in street; Electricity available
- Home design: Single-story mobile home; Model: SKY 1402-CT; Mobile dimensions approximately 28 ft by 56 ft; Entry at level 1; Turnkey condition
- Construction: Mobile home (remains on site); Total stories: 1; Foundation details: see remarks; Year built source: public records
- Exterior features: Rear porch; Patio; Community pool; Shed (1)
Interior
- Kitchen: Formica counters; 6-burner stove; Gas range and gas oven; Microwave; Dishwasher; Water heater unit
- Bedrooms: Primary bedroom
- Flooring: Carpet; Laminate
- Bathrooms: 2 full bathrooms; Soaking tub; Separate tub and shower; Walk-in shower; Shower in tub
- Heating & cooling: Central heating (furnace); Central cooling
- Interior features: Ceiling fan; Recessed lighting; One-level layout; Community spa
- Laundry & utility: Inside laundry in its own room
Neighborhood map
What this means for you Summary
Snapshot
- This is a 2-bed/2.0-bath manufactured listed at $300k.
Deal economics
- At list price, monthly cash flow is $274 ($3k/yr) — positive.
- The deal already cash-flows at list — no discount required.
- To meet the 1% rule (rent ≥ 1% of price), the offer needs to be $297k (0.9% below list).
- Recommended offer: $297k (0.9% below list) — sets the bar for 1% rule.
- Cap rate 7.4% vs local median 2.7% in Upland — top-decile yield for the area; either an underpriced asset or a hidden risk that comps aren't pricing in. Stress-test before assuming the spread holds.
Location & tenants
- Location reads 72/100 on livability (#184 in CA) — a middle-class / working-renter tenant base. Strengths: amenities A+, commute A+, employment A; Watch: crime C-, health & safety C-, cost of living F.
- Upland Unified (suburban): math 39% / reading 53% proficiency, ranked #493 of 1,400 in CA (top 35%) — families likely to look elsewhere, expect single-tenant / working-renter base with shorter leases.
- Market conditions: Rents soft (-0.3%/yr); 84 active listings in the ZIP; 25 comparable units currently listed for rent nearby; rentals at typical pace (median 25d on market — plan ~3-4 weeks tenant-placement turnaround); 40% of comp listings sitting > 30 days — soft ceiling on asking rent; solid renter incomes; 5,458 units permitted in San Bernardino County in 2024 (1,500 in 5+ unit buildings).
- This rent runs 39% of the median local income ($92k/yr) — at the standard rent-burdened threshold; future hikes will face affordability resistance.
Forward outlook
- Local home prices are declining (-3.0%/yr); year-one equity from $2k of loan paydown is wiped out by about $9k of value loss. Plan a longer hold.
- San Bernardino County population projected at +15% by 2050 — modest demand growth; plan on rents tracking national, not racing it.
Negotiation context
- Only 7 days on market — expect competitive offers; lowballing is unlikely to land.
- 9 sale attempts since 13y ago with the ask held roughly flat each time — persistent listings suggest the price (not the market) is what's stuck; bring a comps-based counter.
Risks & watch-outs
- Climate carrying-cost: extreme-heat days projected 6→16/yr by 2055 (HVAC capex compounding) — expect insurance premiums to compound above CPI over the hold.
Questions for the listing agent
- Is there a deadline driving the sale (1031 exchange, divorce, estate, relocation)? That informs how much negotiation room exists.
- The area grade is low — what's the realistic commute time and amenity access for the typical tenant pool here? Any planned neighborhood developments (good or bad) we should know about?
- What's the average days-on-market for RENTAL listings here right now (not sales)? A rising rental-DOM trend means longer vacancies and softer asking-rent achievability than the comps imply.
- What's the recent tenant-quality profile in this submarket — average credit score on applications, eviction rate, late-payment / NSF rate, and stable-employment percentage? A property-management company in the area should have these aggregated.
- How much new for-sale + rental construction is in the pipeline within 1–3 miles? Heavy new supply typically softens prices + rents 12–24 months out; constrained supply supports both.
Investment metrics
- 1% rule
- 0.99% ✗
- Cap rate
- 7.39%
- Cash-on-cash
- 3.92%
- DSCR
- 1.17
- GRM
- 8.4
CMA / ARV
- ARV (on-the-fly)
- $269,696
- Comps found
- 12
Show comp detail 12 sales within ~0.75 mi
| Address | Dist | Beds/Ba | Sqft | Sold | Price | $/sf | Match |
|---|---|---|---|---|---|---|---|
| 1400 W 13th #94 | 0.00mi | 2/2.0 | 1,568 (0%) | 17mo | $270,000 | $172 | 86 |
| 1400 W 13th St #6 | 0.00mi | 2/2.0 | 1,540 (-2%) | 14mo | $285,000 | $185 | 86 |
| 1400 W 13th St #148 | 0.00mi | 3/2.0 (+1) | 1,620 (+3%) | 6mo | $270,000 | $167 | 84 |
| 1400 W 13th St #161 | 0.00mi | 3/2.0 (+1) | 1,568 (0%) | 14mo | $272,500 | $174 | 84 |
| 1400 W 13th St #108 | 0.00mi | 3/2.0 (+1) | 1,568 (0%) | 15mo | $280,000 | $179 | 82 |
| 1400 W 13th St #193 | 0.00mi | 3/2.0 (+1) | 1,568 (0%) | 18mo | $299,000 | $191 | 80 |
| 1400 13th #147 | 0.09mi | 2/2.0 | 1,585 (+1%) | 18mo | $215,000 | $136 | 79 |
| 1400 W 13th St #80 | 0.00mi | 2/2.0 | 1,344 (-14%) | 4mo | $230,000 | $171 | 73 |
| 1400 W 13th St #114 | 0.00mi | 3/2.0 (+1) | 1,680 (+7%) | 14mo | $289,000 | $172 | 72 |
| 1400 W 13th st # 127 | 0.00mi | 2/2.0 | 1,344 (-14%) | 6mo | $214,000 | $159 | 71 |
| 1400 W 13th St #18 | 0.00mi | 3/2.0 (+1) | 1,680 (+7%) | 15mo | $287,000 | $171 | 71 |
| 1400 W 13th #157 St | 0.03mi | 3/2.0 (+1) | 1,624 (+4%) | 22mo | $289,900 | $179 | 69 |
Match score weights: distance 35% · size 25% · config 20% · recency 20%. Top-matched comps best support the ARV.
Projected returns pro-forma
-3.0% appreciation · 0.0% rent growth · sell at horizon
- IRR
- -13.6%
- Equity multiple
- 0.53×
- Total profit
- $-39,789
- Equity at exit
- $44,716
- IRR
- -10.3%
- Equity multiple
- 0.46×
- Total profit
- $-45,616
- Equity at exit
- $25,930
Cash invested: $83,972 (down + closing). Projections, not guarantees.
Landlord ↔ Tenant lean methodology
- Overall (STATE)
- 18 Strongly Tenant-Friendly
- State California
- 18 Strongly Tenant-Friendly · D+13
- County
- — inherits STATE
- City
- — inherits STATE
ZIP-level market 91786
- Rents YoY
- -0.3%
- Active inventory
- 84
- Price-to-rent
- 8.4×
Monthly cashflow live
- Estimated rent
- $2,971 high interval (Pro) →
- Mortgage (P&I)
- −$1,573
- Tax est. 1.5%
- −$375 /mo · $4,498/yr
- Insurance
- −$125
- HOA
- −$0
- Vacancy / Maint / Mgmt
- −$624
- Net cashflow
- $274
Break-even live
Sensitivity live
| Price | -10% $482 | -5% $378 | +0% $274 | +5% $171 | +10% $67 |
|---|---|---|---|---|---|
| Rent | -10% $40 | -5% $157 | +0% $274 | +5% $392 | +10% $509 |
| Rate | -1.0pp $425 | -0.5pp $351 | base $274 | +0.5pp $197 | +1.0pp $118 |
UW: 25.0% down · 7.5% · 30yr · 1.5% tax · 5.0% vac · 8.0% maint · 8.0% mgmt
Financing live
Cash to close
- Down payment
- $74,975
- Closing costs
- $8,997
- Reserves months
- —
- Total cash needed
- —
Loan-product check · same deal, 3 products live
Conventional
25% down · 7.5% · 30yr
- Down + closing
- —
- Monthly P&I
- —
- Monthly cashflow
- —
- DSCR
- —
- Eligible?
- —
Personal DTI + credit; lowest rate.
DSCR
20% down · 8.5% · 30yr
- Down + closing
- —
- Monthly P&I
- —
- Monthly cashflow
- —
- DSCR
- —
- Eligible?
- —
No personal income docs; deal must DSCR.
Hard money
10% down · 12.0% · 12mo
- Down + closing
- —
- Monthly P&I
- —
- Monthly cashflow
- —
- DSCR
- —
- Eligible?
- —
Short-term bridge; refi at stabilization.
Rent comps 25 comps
| Address | Beds | Baths | Sqft | Rent | $/sqft | DOM | Units | Dist |
|---|---|---|---|---|---|---|---|---|
| 1488 Springfield Way Upland, CA | 3.0 | 2.5 | 1670 | $3,100 | $1.86 | 44d | 1 | 0.21mi |
| 406 Tyler Way Upland, CA | 2.0 | 2.0 | 1100 | $2,195 | $2.00 | 0d | 1 | 0.79mi |
| 896 Altura Way Unit A Upland, CA | 3.0 | 2.0 | 1317 | $3,000 | $2.28 | 5d | 1 | 0.80mi |
| 854 Orchid Ct Unit G Upland, CA | 2.0 | 2.0 | 1050 | $1,900 | $1.81 | 25d | 1 | 0.81mi |
| 1560 Corte Caballo Upland, CA | 2.0 | 2.5 | 1522 | $2,995 | $1.97 | 25d | 1 | 0.83mi |
| 1076 W Arrow Hwy Upland, CA | 2.0 | 2.0 | 1076 | $2,730 | $2.54 | 0d | 2 | 0.88mi |
| 1641 Maywood Ave Upland, CA | 3.0 | 2.0 | 1798 | $3,850 | $2.14 | 25d | 1 | 0.90mi |
| 976 ARROW Unit A Upland, CA | 2.0 | 2.5 | 1120 | $2,775 | $2.48 | 0d | 1 | 0.95mi |
| 1790 W Arrow Rte Upland, CA | 2.0 | 2.0 | 1070 | $2,402 | $2.25 | 5d | 3 | 0.96mi |
| 2074 Wild Woods Upland, CA | 3.0 | 2.5 | 1651 | $3,400 | $2.06 | 44d | 1 | 1.01mi |
| 1696 Carmel Cir E Upland, CA | 2.0 | 2.0 | 1392 | $2,775 | $1.99 | 44d | 1 | 1.04mi |
| 2113 Crescent Moon Upland, CA | 3.0 | 2.5 | 1722 | $3,300 | $1.92 | 44d | 1 | 1.05mi |
| 330 Amber Ct Upland, CA | 1.0–2.0 | 1.0–2.0 | 931 | $2,200 | $2.36 | 0d | 2 | 1.20mi |
| 2296 Strawberry Ct Upland, CA | 3.0 | 4.0 | 1785 | $3,650 | $2.04 | 3d | 1 | 1.22mi |
| 2235 Rose Garden Ct Upland, CA | 3.0 | 3.5 | 1694 | $3,250 | $1.92 | 44d | 1 | 1.23mi |
| 2100 W Arrow Rte Upland, CA | 1.0–2.0 | 1.0–2.0 | 940 | $2,993 | $3.18 | 0d | 10 | 1.25mi |
| 1540 W 8th St Upland, CA | 2.0 | 1.0–2.0 | 790 | $2,649 | $3.35 | 0d | 9 | 1.26mi |
| 1386 W 8th St Upland, CA | 3.0 | 2.0 | 1125 | $2,700 | $2.40 | 44d | 1 | 1.27mi |
| 1671 Yarrow Pl Upland, CA | 3.0 | 2.5 | 1719 | $3,600 | $2.09 | 8d | 1 | 1.30mi |
| 1644 Coral Bells Pl Upland, CA | 3.0 | 2.5 | 1741 | $6,000 | $3.45 | 0d | 1 | 1.30mi |
| 1054 N Euclid Ave Upland, CA | 3.0 | 2.0 | 1544 | $3,600 | $2.33 | 44d | 1 | 1.40mi |
| 900 W 18th St Upland, CA | 3.0 | 2.0 | 2000 | $3,850 | $1.93 | 44d | 1 | 1.44mi |
| 387 Sinclair Ave Unit B Upland, CA | 3.0 | 1.5 | 1250 | $2,700 | $2.16 | 44d | 1 | 1.45mi |
| 1007 Harrison Ct Upland, CA | 3.0 | 2.0 | 1400 | $3,900 | $2.79 | 44d | 1 | 1.46mi |
| 595 N Euclid Ave Upland, CA | 3.0 | 2.0 | 1298 | $2,900 | $2.23 | 4d | 1 | 1.48mi |
Listing history 7 events
-
2026-06-18days on market $299,900 Active 7 DOM
-
2026-06-17days on market $299,900 Active 6 DOM
-
2026-06-16days on market $299,900 Active 5 DOM
-
2026-06-15days on market $299,900 Active 4 DOM
-
2026-06-13days on market $299,900 Active 2 DOM
-
2026-06-13remarks 699-char remark
-
2026-06-13$299,900 Active 1 DOM
ⓘ Source: listings_history table (triggers on properties + properties_extension) + one-shot
backfill from property_details.listing_events for pre-trigger history.
Climate risk First Street
- Flood 1/10 Low FEMA zone X (unshaded) · 0% chance over 30 yrs
- Wildfire 3/10 Moderate
- Heat 7/10 Severe 6 d/yr ≥99°F today · 16 d/yr by 30 yrs out
- Wind 1/10 Low
- Air quality 8/10 Severe 16 unhealthy d/yr today · 19 by 30 yrs out
Nearby sold comps map
Loading sold comps map…
Walkable amenities ~0.75 mi
Loading nearby amenities…
Taxation est. · year 1
- Rental income
- $35,648
- − Mortgage interest
- −$16,799
- − Property taxes
- −$4,498
- − Insurance
- −$1,500
- − Repairs & maintenance
- −$2,852
- − Management
- −$2,852
- − Depreciation
- −$8,724
- Taxable loss
- −$1,577
- Est. tax savings @ 24.0%
- +$379
- After-tax cash flow
- $3,670/yr
For passive investors: Depreciation is non-cash, so a rental often shows a tax loss while cash-flowing — sheltering income. Rental losses are passive: they offset passive income freely, and up to $25,000/yr can offset ordinary (W-2) income if you actively participate and your MAGI is under $100k (phasing out to $0 by $150k); unused losses carry forward. On sale, claimed depreciation is recaptured at up to 25%, and gains may owe capital-gains tax (a 1031 exchange can defer both). Figures are a year-1 estimate at your 24.0% rate — not tax advice; consult a CPA.
Schools (NCES district)
- District
- Upland Unified
- NCES district ID
- 0600016
- Math proficiency
- 39% ▲ 1.00%
- Reading proficiency
- 53% ▬ 0.00%
- Median HH income
- $66,267
- Composite
- 43.17/100
- National rank
- #6593
- State rank
- #493 of 1400 in CA
Livability — Upland
- Score
- 72/100
- State rank
- #184
- US rank
- #6041
Category grades
Schools grade is shown separately in the Schools card above.
Census & demographics
- Census place
- Upland, CA
- County
- San Bernardino County · 2,030,291 people
- City population
- 82,715
- Metro
- Riverside-San Bernardino-Ontario, CA
- Population (ZIP)
- 55,829
- Household income
- $92,458
- Rent vs Own
- Severe rent burden
- 2409.0
Population outlook (San Bernardino County) Hauer SSP2
- Today (2025)
- 2,300,329 people
- By 2030
- 2,378,907 · +3.4%
- By 2040
- 2,523,137 · +9.7%
- By 2050
- 2,642,388 · +14.9%
- By 2075
- 2,880,769 · +25.2%
- By 2100
- 2,909,436 · +26.5%
Race, ethnicity, and origin ACS 2023
- Neighborhood character
- Diverse neighborhood (Simpson 0.65)
- Race & ethnicity
- Hispanic / Latino 50% White 30% Two or more races 20% Asian 8% Black 7% Native American 1%
- Hispanic origin (detail)
- Mexican 40%
- Common ancestry
- Romanian 1% Lithuanian 1% Italian 1%
- Foreign-born
- 19% · Canada, China, South Korea
- Languages at home
- 66% English-only · Spanish 24% Chinese 2% Other Indo-European 2%
Political lean MEDSL · San Bernardino
- 2024 margin
- Toss-up / Even · D 47.5% · R 49.7% · Other 2.8%
- 2008→2024 swing
- -8.5pp toward R · 2008: 6.3pp · 2024: -2.1pp
- All cycles
- 2024: R+2.1 2020: D+10.7 2016: D+9.8 2012: D+5.4 2008: D+6.3
Not yet ingested
- Civics
- —
Market trends
- HPI YoY
- ▼ -771.58%
- Current HPI
- 379.2283
- Rent YoY
- ▼ -0.27%
- Metro
- Riverside-San Bernardino-Ontario, CA
- State GDP YoY
- ▲ 3.21%
- F500 in state
- 116
Industry mix (Fortune 500 HQ in CA)
| Industry | F500 HQs | Revenue |
|---|---|---|
| Technology | 27 | $1,492B |
|
||
| Financial Services | 3 | $174B |
|
||
| Retail | 3 | $44B |
|
||
| Insurance | 3 | $26B |
|
||
| Media / Entertainment | 2 | $115B |
|
||
| Pharmaceuticals / Biotech | 2 | $62B |
|
||
Price history
+134.3% since first listed21 events — show timeline
- 2026-06-11 Listed $299,900 CRMLS
- 2025-05-05 Sold (MLS) $272,500 CRMLS
- 2025-03-21 Pending — CRMLS
- 2025-03-03 Relisted — CRMLS
- 2025-02-21 Pending — CRMLS
- 2025-01-30 Relisted — CRMLS
- 2025-01-24 Pending — CRMLS
- 2025-01-14 Relisted — CRMLS
- 2024-12-19 Pending — CRMLS
- 2024-11-13 Relisted — CRMLS
- 2024-11-04 Pending — CRMLS
- 2024-08-07 Relisted — CRMLS
- 2024-04-23 Pending — CRMLS
- 2024-03-19 Listed $275,000 CRMLS
- 2014-03-27 Sold (MLS) $128,000 CRMLS
- 2014-03-21 Pending — CRMLS
- 2014-03-14 Pending — CRMLS
- 2014-02-15 Pending — CRMLS
- 2014-02-10 Relisted — CRMLS
- 2014-01-30 Pending — CRMLS
- 2013-12-06 Listed $128,000 CRMLS
Property tax history
-2.7%/yrLatest (2025): $528 · +1.3% YoY. Source: county tax records.
Cash-flow waterfall
monthlySold comps — $/sqft
last 12 mo · ≤1 miLoading sold comps…