20544 U. S. Rt. 23, N · Andersonville, OH
Flood risk 6/10 · Moderate
- FEMA flood zone
- X (unshaded)
- Chance of flooding over 30 yrs
- 0.7%
- Est. flood insurance / yr
- $507 – $1,088
Fire risk 1/10 · Minimal
- Est. fire insurance / yr
- $713 – $1,323
Heat risk 4/10 · Minor
- Hot days now (above 100°F)
- 7 days/yr
- Hot days in 30 yrs
- 18 days/yr
Wind risk 2/10 · Minimal
- Chance of severe wind over 30 yrs
- 1.0%
Air-quality risk 2/10 · Minimal
- Unhealthy air days now
- 1 days/yr
- Unhealthy air days in 30 yrs
- 2 days/yr
Risk factors via First Street. Map © Google.
Why this score? — see what drove the D+ grade
The composite is a weighted blend of 9 inputs, each scored 0–100. Each bar is that input's sub-score; the figure is the points it added to the 100-point composite (weight × sub-score).
- Cash flow +15.0/30.0
- ARV discount +7.5/15.0
- 1% rule +5.0/10.0
- DSCR +5.0/10.0
- Schools +5.0/10.0
- Livability +3.4/5.0
- Rent growth +2.5/5.0
- Condition / age +2.5/5.0
- Appreciation +0.0/10.0
$17,000
🖨 Deal sheet 📄 Offer letter ✓ Due diligence
Listing remarks MLS
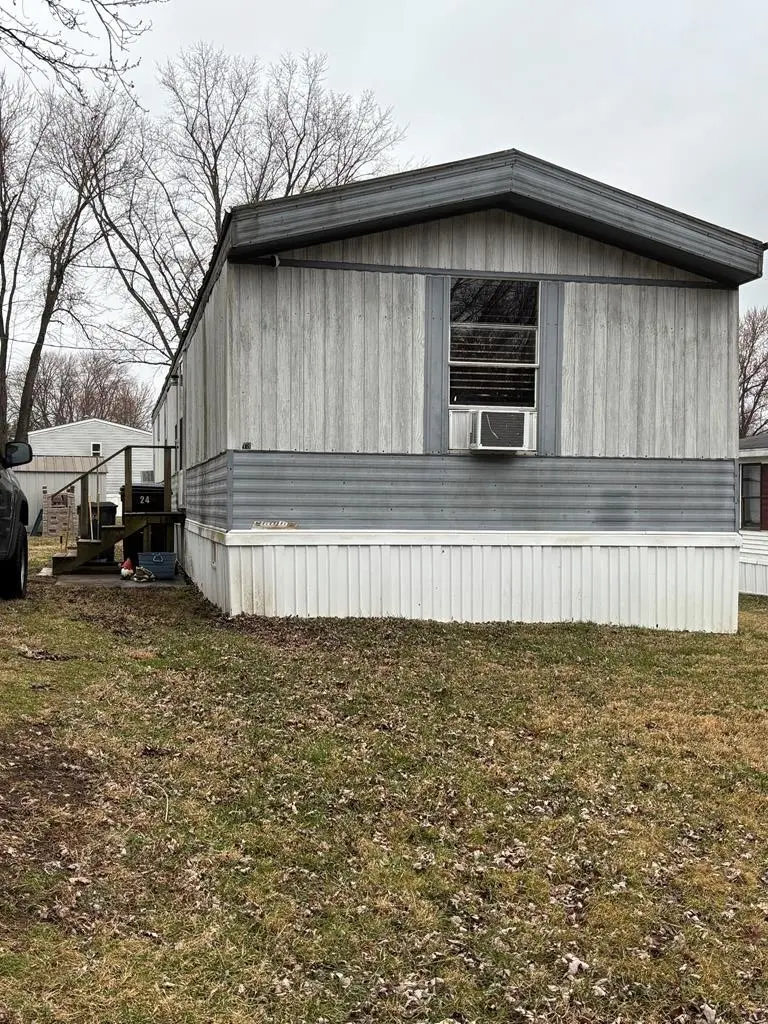
Welcome to home ownership with no mortgage. That's what you can have with this mobile home. This 3 bedroom, 1.5 bath home needs very little cosmetic finishing touches to make it your own. Kitchen appliances including the counter top dishwasher conveys with the home.
Key facts
- Kitchen appliances
- Built 1994
- Listed 65 days
Tags
Neighborhood map
What this means for you Summary
Snapshot
- This is a 3-bed/1.5-bath manufactured listed at $17k.
Deal economics
- At list price, monthly cash flow is $1k ($12k/yr) — positive.
- The deal already cash-flows at list — no discount required.
- Meets the 1% rule at list price ($1k rent vs $17k).
- Recommended offer: $16k (6.0% below list) — sets the bar for market timing.
Location & tenants
- Location reads 67/100 on livability (#618 in OH) — a middle-class / working-renter tenant base. Strengths: employment A+, cost of living A+, housing A+; Watch: schools D-, amenities F, commute F.
- Zane Trace Local (rural): math 54% / reading 61% proficiency, ranked #317 of 656 in OH (top 48%) — acceptable for families but not a draw, mixed tenant base, ~2y average lease.
- Market conditions: 178 active listings in the ZIP; 24 units permitted in Ross County in 2024 (0 in 5+ unit buildings).
Forward outlook
- Local home prices are declining (-3.0%/yr); year-one equity from $118 of loan paydown is wiped out by about $510 of value loss. Plan a longer hold.
- Ross County population projected at -12% by 2050 — secular population decline; favor cash flow + early exit over multi-decade hold.
- At projected returns (-3.0% appreciation + 3.0% rent growth), your $5k cash investment doubles in ~1 year — after that, you're playing with house money.
Negotiation context
- It's been on market 65 days — a 6% lower offer ($16k) is reasonable based on typical stale-listing flexibility.
- 11 sale attempts since 21y ago; this cycle's ask has dropped $8k (32%) from the opening price — seller is motivated, your offer sets the floor, not the list.
Risks & watch-outs
- Climate carrying-cost: major flood risk — expect insurance premiums to compound above CPI over the hold.
Questions for the listing agent
- It's been on market 65 days. Have you received any prior offers? Is the seller open to a 6% concession, seller financing, or rate buy-down credit?
- Why hasn't it sold? Are there any deal-killer items the seller is aware of (foundation, flood, title, zoning, code violations)?
- Is there a deadline driving the sale (1031 exchange, divorce, estate, relocation)? That informs how much negotiation room exists.
- Schools are D-rated, which usually means shorter tenancies and higher turnover. Who's the typical renter profile here, and what's been the actual vacancy rate?
- The area grade is low — what's the realistic commute time and amenity access for the typical tenant pool here? Any planned neighborhood developments (good or bad) we should know about?
- What's the average days-on-market for RENTAL listings here right now (not sales)? A rising rental-DOM trend means longer vacancies and softer asking-rent achievability than the comps imply.
- What's the recent tenant-quality profile in this submarket — average credit score on applications, eviction rate, late-payment / NSF rate, and stable-employment percentage? A property-management company in the area should have these aggregated.
- How much new for-sale + rental construction is in the pipeline within 1–3 miles? Heavy new supply typically softens prices + rents 12–24 months out; constrained supply supports both.
Investment metrics
- 1% rule
- 8.44% ✓
- Cap rate
- 78.00%
- Cash-on-cash
- 256.09%
- DSCR
- 12.39
- GRM
- 1.0
CMA / ARV
No comps found within radius.
Projected returns pro-forma
-3.0% appreciation · 3.0% rent growth · sell at horizon
- IRR
- —
- Equity multiple
- 14.02×
- Total profit
- $61,966
- Equity at exit
- $2,535
- IRR
- —
- Equity multiple
- 29.86×
- Total profit
- $137,357
- Equity at exit
- $1,470
Cash invested: $4,760 (down + closing). Projections, not guarantees.
Landlord ↔ Tenant lean methodology
- Overall (STATE)
- 73 Landlord-Friendly
- State Ohio
- 73 Landlord-Friendly · R+6
- County
- — inherits STATE
- City
- — inherits STATE
ZIP-level market 45601
- Active inventory
- 178
- Price-to-rent
- 1.0×
Monthly cashflow live
- Estimated rent
- $1,435 medium interval (Pro) →
- Mortgage (P&I)
- −$89
- Tax est. 1.5%
- −$21 /mo · $255/yr
- Insurance
- −$7
- HOA
- −$0
- Vacancy / Maint / Mgmt
- −$301
- Net cashflow
- $1,016
Break-even live
UW: 25.0% down · 7.5% · 30yr · 1.5% tax · 5.0% vac · 8.0% maint · 8.0% mgmt
Financing live
Cash to close
- Down payment
- $4,250
- Closing costs
- $510
- Reserves months
- —
- Total cash needed
- —
Loan-product check · same deal, 3 products live
Conventional
25% down · 7.5% · 30yr
- Down + closing
- —
- Monthly P&I
- —
- Monthly cashflow
- —
- DSCR
- —
- Eligible?
- —
Personal DTI + credit; lowest rate.
DSCR
20% down · 8.5% · 30yr
- Down + closing
- —
- Monthly P&I
- —
- Monthly cashflow
- —
- DSCR
- —
- Eligible?
- —
No personal income docs; deal must DSCR.
Hard money
10% down · 12.0% · 12mo
- Down + closing
- —
- Monthly P&I
- —
- Monthly cashflow
- —
- DSCR
- —
- Eligible?
- —
Short-term bridge; refi at stabilization.
Listing history 24 events
-
2026-05-08status Pending 266-char remark
Show marketing remark (266 chars)
Welcome to home ownership with no mortgage. That's what you can have with this mobile home. This 3 bedroom, 1.5 bath home needs very little cosmetic finishing touches to make it your own. Kitchen appliances including the counter top dishwasher conveys with the home.
-
2026-04-29price $17,000 266-char remark
Show marketing remark (266 chars)
Welcome to home ownership with no mortgage. That's what you can have with this mobile home. This 3 bedroom, 1.5 bath home needs very little cosmetic finishing touches to make it your own. Kitchen appliances including the counter top dishwasher conveys with the home.
-
2026-04-17price $20,000 266-char remark
Show marketing remark (266 chars)
Welcome to home ownership with no mortgage. That's what you can have with this mobile home. This 3 bedroom, 1.5 bath home needs very little cosmetic finishing touches to make it your own. Kitchen appliances including the counter top dishwasher conveys with the home.
-
2026-03-16price $22,000 266-char remark
Show marketing remark (266 chars)
Welcome to home ownership with no mortgage. That's what you can have with this mobile home. This 3 bedroom, 1.5 bath home needs very little cosmetic finishing touches to make it your own. Kitchen appliances including the counter top dishwasher conveys with the home.
-
2026-03-04$25,000 Active 266-char remark
Show marketing remark (266 chars)
Welcome to home ownership with no mortgage. That's what you can have with this mobile home. This 3 bedroom, 1.5 bath home needs very little cosmetic finishing touches to make it your own. Kitchen appliances including the counter top dishwasher conveys with the home.
-
2025-09-03historical Active Under Contract
-
2025-07-30price $70,000
-
2025-06-13$75,000 Active
-
2025-01-02soldstatus $20,000 Closed
-
2024-11-25status Active
-
2024-11-19status Pending
-
2024-11-08$45,000 Active
-
2021-09-13soldstatus $33,100
-
2021-07-19$34,900
-
2021-01-13soldstatus $27,000
-
2020-11-30$28,900
-
2020-08-12soldstatus $23,000
-
2020-07-16$28,900
-
2020-02-25$44,900
-
2018-08-29$29,999
-
2007-09-05historical
-
2006-09-01$29,900
-
2006-03-09historical
-
2005-09-09$29,900
ⓘ Source: listings_history table (triggers on properties + properties_extension) + one-shot
backfill from property_details.listing_events for pre-trigger history.
Climate risk First Street
- Flood 6/10 Major FEMA zone X (unshaded) · 70% chance over 30 yrs
- Wildfire 1/10 Low
- Heat 4/10 Moderate 7 d/yr ≥100°F today · 18 d/yr by 30 yrs out
- Wind 2/10 Low 100% chance of damaging wind over 30 yrs
- Air quality 2/10 Low 1 unhealthy d/yr today · 2 by 30 yrs out
Nearby sold comps map
Loading sold comps map…
Walkable amenities ~0.75 mi
Loading nearby amenities…
Taxation est. · year 1
- Rental income
- $17,215
- − Mortgage interest
- −$952
- − Property taxes
- −$255
- − Insurance
- −$85
- − Repairs & maintenance
- −$1,377
- − Management
- −$1,377
- − Depreciation
- −$495
- Taxable income
- $12,674
- Est. tax owed @ 24.0%
- −$3,042
- After-tax cash flow
- $9,148/yr
For passive investors: Depreciation is non-cash, so a rental often shows a tax loss while cash-flowing — sheltering income. Rental losses are passive: they offset passive income freely, and up to $25,000/yr can offset ordinary (W-2) income if you actively participate and your MAGI is under $100k (phasing out to $0 by $150k); unused losses carry forward. On sale, claimed depreciation is recaptured at up to 25%, and gains may owe capital-gains tax (a 1031 exchange can defer both). Figures are a year-1 estimate at your 24.0% rate — not tax advice; consult a CPA.
Schools (NCES district)
- District
- Zane Trace Local
- NCES district ID
- 3904954
- Math proficiency
- 54% ▼ -6.00%
- Reading proficiency
- 61% ▼ -7.00%
- Median HH income
- $56,172
- Composite
- 49.57/100
- National rank
- #1988
- State rank
- #317 of 656 in OH
Livability — Andersonville
- Score
- 67/100
- State rank
- #618
- US rank
- #10697
Category grades
Schools grade is shown separately in the Schools card above.
Census & demographics
- County
- Ross · 75,517 people
- Population (ZIP)
- 56,453
- Household income
- $57,430
- Rent vs Own
- Severe rent burden
- 10.6
Population outlook (Ross County) Hauer SSP2
- Today (2025)
- 75,482 people
- By 2030
- 74,035 · -1.9%
- By 2040
- 70,702 · -6.3%
- By 2050
- 66,706 · -11.6%
- By 2075
- 55,398 · -26.6%
- By 2100
- 42,197 · -44.1%
Race, ethnicity, and origin ACS 2023
- Neighborhood character
- Predominantly White (86%)
- Race & ethnicity
- White 86% Black 7% Two or more races 4% Hispanic / Latino 2%
- Common ancestry
- Slovak 2% Iranian 1% Italian 1%
- Foreign-born
- 1% · Canada
- Languages at home
- 98% English-only · Spanish 1%
Political lean MEDSL · Ross
- 2024 margin
- Solid R (+39.3) · D 29.9% · R 69.2%
- 2008→2024 swing
- -32.1pp toward R · 2008: -7.2pp · 2024: -39.3pp
- All cycles
- 2024: R+39.3 2020: R+35.2 2016: R+27.4 2012: R+2.4 2008: R+7.2
Not yet ingested
- Civics
- —
Market trends
- HPI YoY
- ▼ -231.40%
- Current HPI
- 205.7051
- Rent YoY
- —
- Metro
- —
- State GDP YoY
- ▲ 1.98%
- F500 in state
- 48
Industry mix (Fortune 500 HQ in OH)
| Industry | F500 HQs | Revenue |
|---|---|---|
| Insurance | 3 | $145B |
|
||
| Industrial Machinery | 3 | $49B |
|
||
| Financial Services | 3 | $24B |
|
||
| Consumer Goods | 2 | $93B |
|
||
| Aerospace / Defense | 2 | $47B |
|
||
| Utilities | 2 | $33B |
|
||
Price history
-43.1% since first listed24 events — show timeline
- 2026-05-08 Pending — SVAR
- 2026-04-29 Price Changed $17,000 SVAR
- 2026-04-17 Price Changed $20,000 SVAR
- 2026-03-16 Price Changed $22,000 SVAR
- 2026-03-04 Listed $25,000 SVAR
- 2025-09-03 Contingent — SVAR
- 2025-07-30 Price Changed $70,000 SVAR
- 2025-06-13 Listed $75,000 SVAR
- 2025-01-02 Sold (MLS) $20,000 SVAR
- 2024-11-25 Relisted — SVAR
- 2024-11-19 Pending — SVAR
- 2024-11-08 Listed $45,000 SVAR
- 2021-09-13 Sold (MLS) $33,100 SVAR
- 2021-07-19 Listed $34,900 SVAR
- 2021-01-13 Sold (MLS) $27,000 SVAR
- 2020-11-30 Listed $28,900 SVAR
- 2020-08-12 Sold (MLS) $23,000 SVAR
- 2020-07-16 Listed $28,900 SVAR
- 2020-02-25 Listed $44,900 SVAR
- 2018-08-29 Listed $29,999 SVAR
- 2007-09-05 Listing Removed — CBRMLS
- 2006-09-01 Listed $29,900 CBRMLS
- 2006-03-09 Listing Removed — CBRMLS
- 2005-09-09 Listed $29,900 CBRMLS
Property tax history
+12.4%/yrLatest (2025): $35,958 · +312.4% YoY. Source: county tax records.
Cash-flow waterfall
monthlySold comps — $/sqft
last 12 mo · ≤1 miLoading sold comps…