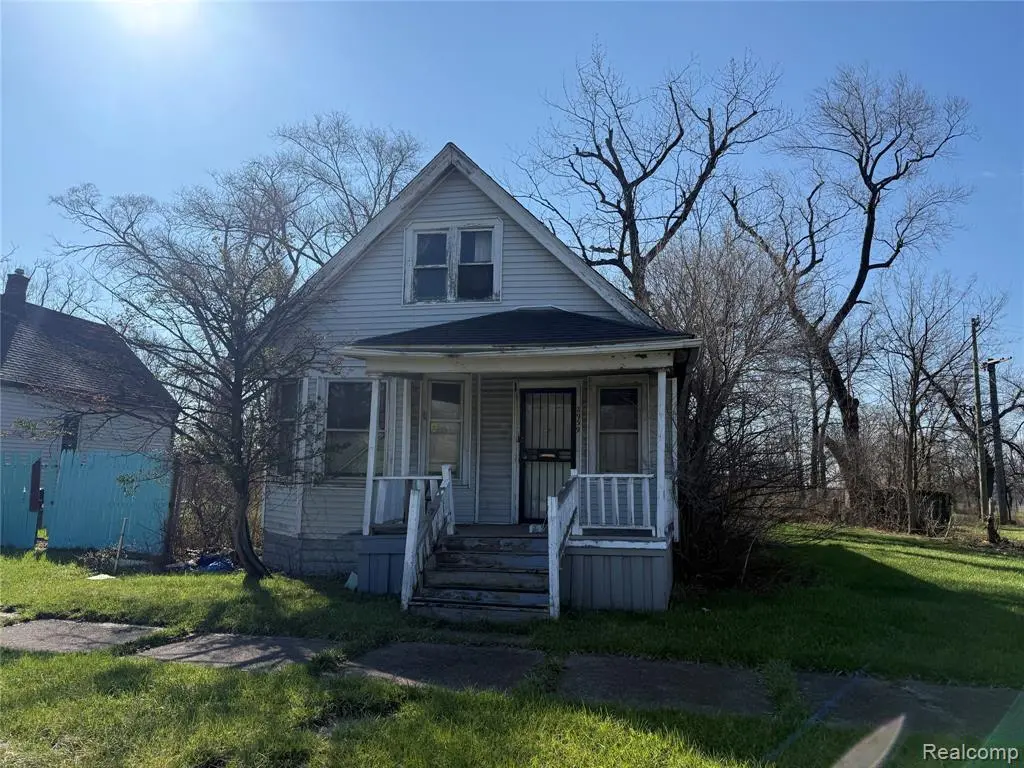
2939 Merrick St · Detroit, MI
Flood risk 1/10 · Minimal
- FEMA flood zone
- X (unshaded)
- Chance of flooding over 30 yrs
- 0.0%
- Est. flood insurance / yr
- $473 – $860
Fire risk 1/10 · Minimal
- Est. fire insurance / yr
- $784 – $1,456
Heat risk 3/10 · Minor
- Hot days now (above 97°F)
- 7 days/yr
- Hot days in 30 yrs
- 15 days/yr
Wind risk 2/10 · Minimal
- Chance of severe wind over 30 yrs
- —
Air-quality risk 4/10 · Minor
- Unhealthy air days now
- 6 days/yr
- Unhealthy air days in 30 yrs
- 8 days/yr
Risk factors via First Street. Map © Google.
Why this score? — see what drove the B grade
The composite is a weighted blend of 9 inputs, each scored 0–100. Each bar is that input's sub-score; the figure is the points it added to the 100-point composite (weight × sub-score).
- Cash flow +30.0/30.0
- ARV discount +15.0/15.0
- 1% rule +10.0/10.0
- DSCR +10.0/10.0
- Livability +3.7/5.0
- Rent growth +2.5/5.0
- Condition / age +2.5/5.0
- Schools +1.3/10.0
- Appreciation +0.0/10.0
$40,000
🖨 Deal sheet 📄 Offer letter ✓ Due diligence
Listing remarks MLS
Here is an investment opportunity in Detroit's Core City. 3BR bungalow in need of full rehab. Good candidate to flip or fix up and rent. Verdant block with very few structures. Lots of development happening in this area. Minutes from Corktown, Midtown, Downtown Detroit.
Key facts
- Full rehab
- Midtown
- Candidate to flip
Tags
Property features AI
Exterior
- Parking: No garage
- Utilities: Public water; Public sewer; Sewer and water available
- Home design: Single-family residence; Two levels; Ground-level entry with steps
- Construction: Aluminum siding
- Exterior features: Paved road access; Lot approximately 30 x 100.6 (0.07 acres)
Interior
- Bathrooms: 1 full bathroom
- Heating & cooling: Forced air heating (natural gas); No cooling
- Interior features: Crawl space basement; Total of 5 rooms
Neighborhood map
What this means for you Summary
Snapshot
- This is a 3-bed/1.0-bath single-family listed at $40k.
Deal economics
- At list price, monthly cash flow is $802 ($10k/yr) — positive.
- The deal already cash-flows at list — no discount required.
- Meets the 1% rule at list price ($2k rent vs $40k).
- Recommended offer: $39k (3.0% below list) — sets the bar for market timing.
- Cap rate 30.4% vs local median 10.2% in Detroit — top-decile yield for the area; either an underpriced asset or a hidden risk that comps aren't pricing in. Stress-test before assuming the spread holds.
Location & tenants
- Location reads 73/100 on livability (#218 in MI) — a middle-class / working-renter tenant base. Strengths: amenities A+, commute A+, cost of living A+; Watch: schools F, crime F, employment F.
- Detroit Public Schools Community District (urban): math 10% / reading 24% proficiency, ranked #499 of 540 in MI (top 92%) — low school quality limits family demand, transient renter base, plan for 1-2y turnover; 90% free/reduced lunch — lower-income household profile, screen leases tightly.
- Market conditions: 184 active listings in the ZIP; 40 comparable units currently listed for rent nearby; rentals at typical pace (median 24d on market — plan ~3-4 weeks tenant-placement turnaround); 48% of comp listings sitting > 30 days — soft ceiling on asking rent; lower-income renter base — watch delinquency; 2,639 units permitted in Wayne County in 2024 (1,216 in 5+ unit buildings).
- At $1,503/mo this rent would consume 50% of the median local household income ($36k/yr) (locally 601% of renters already pay >50% of income on rent) — very limited rent-growth headroom before tenants either downsize or default.
Forward outlook
- Local home prices are declining (-3.0%/yr); year-one equity from $277 of loan paydown is wiped out by about $1k of value loss. Plan a longer hold.
- Wayne County population projected at -17% by 2050 — secular population decline; favor cash flow + early exit over multi-decade hold.
- At projected returns (-3.0% appreciation + 3.0% rent growth), your $11k cash investment doubles in ~2 years — after that, you're playing with house money.
Negotiation context
- It's been on market 45 days — a 3% lower offer ($39k) is reasonable based on typical stale-listing flexibility.
- 2 sale attempts with the ask held roughly flat each time — persistent listings suggest the price (not the market) is what's stuck; bring a comps-based counter.
Risks & watch-outs
- Watch-outs: property tax is 4.8% of price; built in 1910 — expect roof / HVAC / electrical / plumbing capex.
Questions for the listing agent
- It's been on market 45 days. Have you received any prior offers? Is the seller open to a 3% concession, seller financing, or rate buy-down credit?
- Built in 1910 — when were the roof, HVAC, electrical panel, plumbing, and water heater last replaced?
- Property tax is high relative to price — has the assessment been appealed recently, and will the sale trigger a re-assessment?
- Is there a deadline driving the sale (1031 exchange, divorce, estate, relocation)? That informs how much negotiation room exists.
- Schools are F-rated, which usually means shorter tenancies and higher turnover. Who's the typical renter profile here, and what's been the actual vacancy rate?
- Crime grade is F in this area — have there been break-ins, vandalism, or insurance claims at this property in the last 3 years? What carrier currently insures it and at what premium?
- What's the average days-on-market for RENTAL listings here right now (not sales)? A rising rental-DOM trend means longer vacancies and softer asking-rent achievability than the comps imply.
- What's the recent tenant-quality profile in this submarket — average credit score on applications, eviction rate, late-payment / NSF rate, and stable-employment percentage? A property-management company in the area should have these aggregated.
- How much new for-sale + rental construction is in the pipeline within 1–3 miles? Heavy new supply typically softens prices + rents 12–24 months out; constrained supply supports both.
Investment metrics
- 1% rule
- 3.76% ✓
- Cap rate
- 30.36%
- Cash-on-cash
- 85.95%
- DSCR
- 4.82
- GRM
- 2.2
CMA / ARV
- ARV (median comp)
- $56,555
- List price
- $40,000
- Delta
- -29.27%
- Verdict
- UNDERPRICED
- Comps
- 20 within 1.0 mi
Show comp detail 7 sales within ~0.75 mi
| Address | Dist | Beds/Ba | Sqft | Sold | Price | $/sf | Match |
|---|---|---|---|---|---|---|---|
| 5261 24th St | 0.33mi | 3/1.0 | 1,132 (+5%) | 12mo | $87,000 | $77 | 67 |
| 6419 Roosevelt St | 0.57mi | 3/1.0 | 1,143 (+6%) | 1mo | $15,000 | $13 | 63 |
| 5043 Rosa Parks Blvd | 0.68mi | 3/1.0 | 1,100 (+2%) | 9mo | $124,900 | $114 | 58 |
| 3532 Moore Pl Pl | 0.54mi | 3/1.5 | 1,181 (+9%) | 1mo | $12,000 | $10 | 56 |
| 6050 16th St | 0.65mi | 2/2.0 (-1) | 1,086 (+0%) | 23mo | $265,000 | $244 | 40 |
| 6080 16th St | 0.67mi | 3/1.0 | 1,160 (+7%) | 23mo | $119,000 | $103 | 37 |
| 2681 Nebraska St | 0.65mi | 4/2.5 (+1) | 1,238 (+14%) | 20mo | $189,700 | $153 | 18 |
Match score weights: distance 35% · size 25% · config 20% · recency 20%. Top-matched comps best support the ARV.
Projected returns pro-forma
-3.0% appreciation · 3.0% rent growth · sell at horizon
- IRR
- 86.5%
- Equity multiple
- 4.99×
- Total profit
- $44,703
- Equity at exit
- $5,964
- IRR
- 89.6%
- Equity multiple
- 10.38×
- Total profit
- $105,083
- Equity at exit
- $3,458
Cash invested: $11,200 (down + closing). Projections, not guarantees.
Landlord ↔ Tenant lean methodology
- Overall (STATE)
- 62 Landlord-Friendly
- State Michigan
- 62 Landlord-Friendly · EVEN
- County
- — inherits STATE
- City
- — inherits STATE
ZIP-level market 48208
- Home prices YoY
- -5.9%
- Active inventory
- 184
- Price-to-rent
- 2.2×
Monthly cashflow live
- Estimated rent
- $1,503 high interval (Pro) →
- Mortgage (P&I)
- −$210
- Tax from tax record
- −$159 /mo · $1,903/yr
- Insurance
- −$17
- HOA
- −$0
- Vacancy / Maint / Mgmt
- −$316
- Net cashflow
- $802
Break-even live
UW: 25.0% down · 7.5% · 30yr · 1.5% tax · 5.0% vac · 8.0% maint · 8.0% mgmt
Financing live
Cash to close
- Down payment
- $10,000
- Closing costs
- $1,200
- Reserves months
- —
- Total cash needed
- —
Loan-product check · same deal, 3 products live
Conventional
25% down · 7.5% · 30yr
- Down + closing
- —
- Monthly P&I
- —
- Monthly cashflow
- —
- DSCR
- —
- Eligible?
- —
Personal DTI + credit; lowest rate.
DSCR
20% down · 8.5% · 30yr
- Down + closing
- —
- Monthly P&I
- —
- Monthly cashflow
- —
- DSCR
- —
- Eligible?
- —
No personal income docs; deal must DSCR.
Hard money
10% down · 12.0% · 12mo
- Down + closing
- —
- Monthly P&I
- —
- Monthly cashflow
- —
- DSCR
- —
- Eligible?
- —
Short-term bridge; refi at stabilization.
Rent comps 40 comps
| Address | Beds | Baths | Sqft | Rent | $/sqft | DOM | Units | Dist |
|---|---|---|---|---|---|---|---|---|
| 4619 16th St Detroit, MI | 3.0 | 1.0 | 1100 | $1,250 | $1.14 | 2d | 1 | 0.46mi |
| 6077 Linwood St Detroit, MI | 2.0 | 1.0 | 1200 | $2,000 | $1.67 | 43d | 1 | 0.55mi |
| 1493 W Grand Blvd Detroit, MI | 2.0 | 1.0 | 1250 | $1,145 | $0.92 | 43d | 1 | 0.70mi |
| 1565 W Grand Blvd Unit 1 Detroit, MI | 2.0 | 1.0 | 910 | $700 | $0.77 | 21d | 1 | 0.71mi |
| 1565 W Grand Blvd Unit 1 Detroit, MI | 2.0 | 1.0 | 910 | $700 | $0.77 | 24d | 1 | 0.71mi |
| 6144 16th St Detroit, MI | 3.0 | 1.0 | 1284 | $1,200 | $0.93 | 43d | 1 | 0.71mi |
| 3998 15th St Unit 1 Detroit, MI | 2.0 | 1.0 | 1200 | $1,300 | $1.08 | 43d | 1 | 0.72mi |
| 4848 Commonwealth St Unit 4 Detroit, MI | 2.0 | 1.0 | 710 | $1,245 | $1.75 | 43d | 1 | 0.86mi |
| 6183 Hecla St Detroit, MI | 3.0 | 1.0 | 1100 | $1,700 | $1.55 | 24d | 1 | 0.97mi |
| 4426 McGraw Ave Unit 1 Detroit, MI | 3.0 | 1.0 | 1400 | $1,200 | $0.86 | 43d | 1 | 0.99mi |
| 3984 Commonwealth St Unit B Detroit, MI | 3.0 | 2.0 | 1100 | $2,400 | $2.18 | 24d | 1 | 1.06mi |
| 3309 14th St Detroit, MI | 1.0–3.0 | 1.0–2.5 | 942 | $2,230 | $2.37 | 1d | 11 | 1.11mi |
| 4016 Hogarth St Unit 4018 Hogarth Lower Detroit, MI | 2.0 | 1.0 | 1200 | $1,100 | $0.92 | 3d | 1 | 1.11mi |
| 6307 Woodrow St Detroit, MI | 2.0 | 1.0 | 1000 | $750 | $0.75 | 43d | 1 | 1.13mi |
| 7340 Churchill St Unit 2 Detroit, MI | 2.0 | 1.0 | 1046 | $1,100 | $1.05 | 24d | 1 | 1.14mi |
| 2835 23rd St Unit 2 Detroit, MI | 3.0 | 2.0 | 1100 | $1,450 | $1.32 | 16d | 1 | 1.21mi |
| 1800 W Bethune St Unit 1228665P Detroit, MI | 2.0 | 1.0 | 904 | $3,135 | $3.47 | 43d | 1 | 1.24mi |
| 4566 Seebaldt St Detroit, MI | 2.0 | 1.0 | 1200 | $1,250 | $1.04 | 21d | 1 | 1.24mi |
| 1800 W Bethune St Detroit, MI | 2.0 | 1.0 | 656 | $1,645 | $2.51 | 24d | 3 | 1.24mi |
| 1800 W Bethune St Detroit, MI | 2.0 | 1.0 | 800 | $1,850 | $2.31 | 43d | 1 | 1.24mi |
| 2047 Seward St Detroit, MI | 3.0 | 1.0 | 1421 | $1,523 | $1.07 | 5d | 1 | 1.30mi |
| 7640 Woodrow Wilson St Unit 1 Detroit, MI | 3.0 | 1.5 | 1095 | $1,400 | $1.28 | 43d | 1 | 1.31mi |
| 2504 W Euclid St Unit 2504 Detroit, MI | 3.0 | 1.0 | 1475 | $1,650 | $1.12 | 43d | 1 | 1.36mi |
| 944 W Alexandrine St Unit 1 Detroit, MI | 3.0 | 1.0 | 1100 | $1,950 | $1.77 | 43d | 1 | 1.36mi |
| 2506 W Euclid St Detroit, MI | 3.0 | 1.0 | 1475 | $1,675 | $1.14 | 43d | 1 | 1.36mi |
| 2504 W Euclid St Unit 2506 Detroit, MI | 3.0 | 1.0 | 1475 | $1,675 | $1.14 | 43d | 1 | 1.36mi |
| 3143 Trumbull Unit 301 Detroit, MI | 2.0 | 1.0 | 1000 | $1,650 | $1.65 | 21d | 1 | 1.37mi |
| 3259 W Philadelphia St Detroit, MI | 3.0 | 1.0 | 1293 | $1,400 | $1.08 | 16d | 1 | 1.38mi |
| 5440 Milford St Unit 1 Detroit, MI | 2.0 | 1.0 | 850 | $1,150 | $1.35 | 43d | 1 | 1.41mi |
| 1974 Virginia Park St Detroit, MI | 2.0 | 2.0 | 1200 | $1,995 | $1.66 | 43d | 1 | 1.42mi |
| 701 W Canfield St Unit 4 Detroit, MI | 2.0 | 1.5 | 1094 | $3,000 | $2.74 | 43d | 1 | 1.43mi |
| 701 W Canfield St Unit 1 Detroit, MI | 2.0 | 1.5 | 1144 | $3,250 | $2.84 | 43d | 1 | 1.43mi |
| 677 W Canfield St Detroit, MI | 2.0 | 1.5 | 1200 | $2,750 | $2.29 | 17d | 1 | 1.45mi |
| 4345 W Euclid St Unit 2 Detroit, MI | 3.0 | 1.0 | 1300 | $1,450 | $1.12 | 24d | 1 | 1.45mi |
| 4345 W Euclid St Unit 1 Detroit, MI | 3.0 | 1.0 | 1300 | $1,400 | $1.08 | 24d | 1 | 1.45mi |
| 669 W Canfield St Unit 2 Detroit, MI | 2.0 | 2.0 | 1500 | $2,400 | $1.60 | 43d | 1 | 1.46mi |
| 2531 Pingree St Unit 2 (FL 2) Detroit, MI | 3.0 | 1.0 | 893 | $1,100 | $1.23 | 2d | 1 | 1.46mi |
| 4709 2nd Ave Detroit, MI | 1.0–2.0 | 1.0 | 672 | $1,350 | $2.01 | 1d | 2 | 1.46mi |
| 1710 Virginia Park St Detroit, MI | 2.0 | 2.0 | 1350 | $1,300 | $0.96 | 5d | 1 | 1.48mi |
| 675 W Willis St Detroit, MI | 1.0–3.0 | 1.0 | 631 | $1,695 | $2.69 | 1d | 4 | 1.48mi |
Listing history 16 events
-
2026-06-18days on market $40,000 Active 45 DOM
-
2026-06-17days on market $40,000 Active 44 DOM
-
2026-06-15days on market $40,000 Active 42 DOM
-
2026-06-13days on market $40,000 Active 40 DOM
-
2026-06-13days on market $40,000 Active 39 DOM
-
2026-06-09days on market $40,000 Active 36 DOM
-
2026-06-08days on market $40,000 Active 35 DOM
-
2026-06-07days on market $40,000 Active 34 DOM
-
2026-06-04days on market $40,000 Active 31 DOM
-
2026-06-03days on market $40,000 Active 30 DOM
-
2026-06-02days on market $40,000 Active 29 DOM
-
2026-06-01days on market $40,000 Active 28 DOM
-
2026-05-31days on market $40,000 Active 27 DOM
-
2026-05-04$40,000 Active 270-char remark
Show marketing remark (270 chars)
Here is an investment opportunity in Detroit's Core City. 3BR bungalow in need of full rehab. Good candidate to flip or fix up and rent. Verdant block with very few structures. Lots of development happening in this area. Minutes from Corktown, Midtown, Downtown Detroit.
-
2019-04-16soldstatus $50,000
ⓘ Source: listings_history table (triggers on properties + properties_extension) + one-shot
backfill from property_details.listing_events for pre-trigger history.
Tax reassessment forecast MI · Partial reset (capped growth)
- Current annual tax
- $1,903 · $159/mo
- Projected year-2 tax
- $1,903 · $159/mo
- Expected delta
- $0/yr ($0/mo · 0.0%)
ⓘ Screening estimate from a state-policy table — verify with the county assessor before closing.
Climate risk First Street
- Flood 1/10 Low FEMA zone X (unshaded) · 0% chance over 30 yrs
- Wildfire 1/10 Low
- Heat 3/10 Moderate 7 d/yr ≥97°F today · 15 d/yr by 30 yrs out
- Wind 2/10 Low
- Air quality 4/10 Moderate 6 unhealthy d/yr today · 8 by 30 yrs out
Nearby sold comps map
Loading sold comps map…
Walkable amenities ~0.75 mi
Loading nearby amenities…
Taxation est. · year 1
- Rental income
- $18,035
- − Mortgage interest
- −$2,241
- − Property taxes
- −$1,903
- − Insurance
- −$200
- − Repairs & maintenance
- −$1,443
- − Management
- −$1,443
- − Depreciation
- −$1,164
- Taxable income
- $9,642
- Est. tax owed @ 24.0%
- −$2,314
- After-tax cash flow
- $7,313/yr
For passive investors: Depreciation is non-cash, so a rental often shows a tax loss while cash-flowing — sheltering income. Rental losses are passive: they offset passive income freely, and up to $25,000/yr can offset ordinary (W-2) income if you actively participate and your MAGI is under $100k (phasing out to $0 by $150k); unused losses carry forward. On sale, claimed depreciation is recaptured at up to 25%, and gains may owe capital-gains tax (a 1031 exchange can defer both). Figures are a year-1 estimate at your 24.0% rate — not tax advice; consult a CPA.
Schools (NCES district)
- District
- Detroit Public Schools Community District
- NCES district ID
- 2601103
- Math proficiency
- 10% ▼ -2.00%
- Reading proficiency
- 24% ▲ 6.00%
- Median HH income
- $25,815
- Composite
- 13.06/100
- National rank
- #9564
- State rank
- #499 of 540 in MI
Livability — Detroit
- Score
- 73/100
- State rank
- #218
- US rank
- #5427
Category grades
Schools grade is shown separately in the Schools card above.
Census & demographics
- Census place
- Detroit, MI
- County
- Wayne County · 1,562,939 people
- City population
- 572,865
- Metro
- Detroit-Warren-Dearborn, MI
- Population (ZIP)
- 8,037
- Household income
- $36,194
- Rent vs Own
- Severe rent burden
- 601.0
Population outlook (Wayne County) Hauer SSP2
- Today (2025)
- 1,675,273 people
- By 2030
- 1,620,300 · -3.3%
- By 2040
- 1,502,341 · -10.3%
- By 2050
- 1,384,039 · -17.4%
- By 2075
- 1,124,592 · -32.9%
- By 2100
- 881,193 · -47.4%
Race, ethnicity, and origin ACS 2023
- Neighborhood character
- Predominantly Black (66%)
- Race & ethnicity
- Black 66% White 23% Two or more races 7% Hispanic / Latino 6% Asian 1%
- Hispanic origin (detail)
- Mexican 3% Puerto Rican 1%
- Common ancestry
- Romanian 3% Lithuanian 1% Slovak 1%
- Foreign-born
- 2% · Canada
- Languages at home
- 94% English-only · Spanish 5% Arabic 1%
Political lean MEDSL · Wayne
- 2024 margin
- Strong D (+29.0) · D 62.7% · R 33.7% · Other 3.6%
- 2008→2024 swing
- -20.5pp toward R · 2008: 49.5pp · 2024: 29.0pp
- All cycles
- 2024: D+29.0 2020: D+38.1 2016: D+37.3 2012: D+46.9 2008: D+49.5
Not yet ingested
- Civics
- —
Market trends
- HPI YoY
- ▼ -10.56%
- Current HPI
- 168.8907
- Rent YoY
- —
- Metro
- Detroit-Warren-Dearborn, MI
- State GDP YoY
- ▲ 1.37%
- F500 in state
- 28
Industry mix (Fortune 500 HQ in MI)
| Industry | F500 HQs | Revenue |
|---|---|---|
| Automotive Parts | 3 | $48B |
|
||
| Automotive | 2 | $372B |
|
||
| Chemicals | 1 | $45B |
|
||
| Automotive Retail | 1 | $29B |
|
||
| Healthcare / Medical Devices | 1 | $23B |
|
||
| Automotive Technology | 1 | $20B |
|
||
Price history
-20.0% since first listed3 events — show timeline
- 2026-05-04 Listed $40,000 MiRealSource-MiMLS
- 2026-05-04 Listed $40,000 REALCOMP
- 2019-04-16 Sold (Public Records) $50,000 Public Records
Property tax history
+11.9%/yrLatest (2025): $1,903 · +38.4% YoY. Source: county tax records.
Cash-flow waterfall
monthlySold comps — $/sqft
last 12 mo · ≤1 miLoading sold comps…