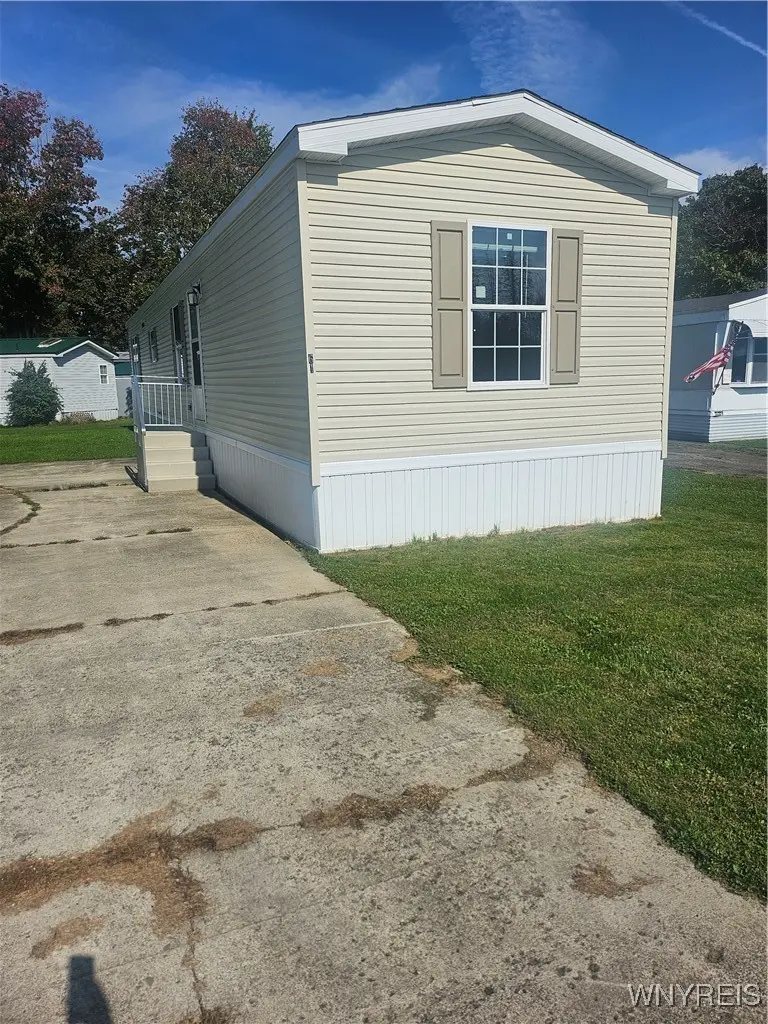
7930 Route 16 Lot 61 · Franklinville, NY
Flood risk No data
- FEMA flood zone
- —
- Chance of flooding over 30 yrs
- —
- Est. flood insurance / yr
- —
Fire risk No data
- Est. fire insurance / yr
- —
Heat risk No data
- Hot days now (above threshold)
- —
- Hot days in 30 yrs
- —
Wind risk No data
- Chance of severe wind over 30 yrs
- —
Air-quality risk No data
- Unhealthy air days now
- —
- Unhealthy air days in 30 yrs
- —
Risk factors via First Street. Map © Google.
Why this score? — see what drove the B- grade
The composite is a weighted blend of 9 inputs, each scored 0–100. Each bar is that input's sub-score; the figure is the points it added to the 100-point composite (weight × sub-score).
- Cash flow +23.8/30.0
- Appreciation +8.0/10.0
- DSCR +7.7/10.0
- ARV discount +7.5/15.0
- 1% rule +6.2/10.0
- Schools +4.9/10.0
- Livability +3.1/5.0
- Rent growth +2.5/5.0
- Condition / age +2.5/5.0
$79,900
🖨 Deal sheet (PDF) 📄 Offer letter ✓ Due diligence
Listing remarks MLS
NEW HOME, Move in Ready, 2 bedroom, 2 full bath Manufactured home. 2x6 Exterior walls, architectural shingles, thermal windows. Spacious living room, open to eat in kitchen. Gray flat panel cabinets, gas stove, refrigerator and dishwasher. Stainless Steel deep well sink. Owner bedroom with large closet. Owner Bath walk in shower, 36" high vanity. Main bath has tub/shower, vanity. Interior whole house water shut off, vinyl skirting, 20 ft awning, 8x10 storage shed. Located in well maintained, quiet community with a country setting, close to golf course, shopping. Star tax Credit eligible. 1 pet policy per home
Key facts
- Thermal windows
- 20 ft awning
- Gas stove
Tags
Neighborhood map
What this means for you Summary
Snapshot
- This is a 2-bed/2.0-bath manufactured listed at $80k.
Deal economics
- At list price, monthly cash flow is $154 ($2k/yr) — positive.
- The deal already cash-flows at list — no discount required.
- Meets the 1% rule at list price ($894 rent vs $80k).
- Recommended offer: $70k (12.0% below list) — sets the bar for market timing.
Location & tenants
- Location reads 62/100 on livability (#856 in NY) — a middle-class / working-renter tenant base. Strengths: cost of living A+, housing A+, crime A-; Watch: employment C-, amenities F, commute F.
- Franklinville Central School District (rural): math 60% / reading 57% proficiency, ranked #281 of 590 in NY (top 48%) — acceptable for families but not a draw, mixed tenant base, ~2y average lease.
- Zoned schools: Franklinville Elementary School (math 67% / reading 52%, grade B-, #745 of 2,108 statewide, top 39%, 286 students, 51% FRL); Franklinville Junior-Senior High School (math 57% / reading 62%, grade C+, #851 of 1,100 statewide, top 80%, 299 students, 50% FRL).
- Market conditions: 33 active listings in the ZIP; 128 units permitted in Cattaraugus County in 2024 (21 in 5+ unit buildings).
Forward outlook
- In year one you build about $5k of equity ($552 loan paydown + $5k appreciation (5.9% local appreciation)).
- Cattaraugus County population projected at -28% by 2050 — secular population decline; favor cash flow + early exit over multi-decade hold.
- At projected returns (5.9% appreciation + 3.0% rent growth), your $22k cash investment doubles in ~3 years — after that, you're playing with house money.
- By year 7, paydown + projected appreciation supports a ~$35k cash-out refi (75% LTV) — recoverable capital for the next deal without selling this one.
Negotiation context
- It's been on market 244 days — a 12% lower offer ($70k) is reasonable based on typical stale-listing flexibility.
- 4 sale attempts since 16y ago with the ask held roughly flat each time — persistent listings suggest the price (not the market) is what's stuck; bring a comps-based counter.
- Current owner paid $16k; list at $80k implies a 403% gain — meaningful room to come down on a strong offer.
Questions for the listing agent
- It's been on market 244 days. Have you received any prior offers? Is the seller open to a 12% concession, seller financing, or rate buy-down credit?
- Why hasn't it sold? Are there any deal-killer items the seller is aware of (foundation, flood, title, zoning, code violations)?
- Is there a deadline driving the sale (1031 exchange, divorce, estate, relocation)? That informs how much negotiation room exists.
- Schools are D-rated, which usually means shorter tenancies and higher turnover. Who's the typical renter profile here, and what's been the actual vacancy rate?
- What's the average days-on-market for RENTAL listings here right now (not sales)? A rising rental-DOM trend means longer vacancies and softer asking-rent achievability than the comps imply.
- What's the recent tenant-quality profile in this submarket — average credit score on applications, eviction rate, late-payment / NSF rate, and stable-employment percentage? A property-management company in the area should have these aggregated.
- How much new for-sale + rental construction is in the pipeline within 1–3 miles? Heavy new supply typically softens prices + rents 12–24 months out; constrained supply supports both.
Investment metrics
- 1% rule
- 1.12% ✓
- Cap rate
- 8.61%
- Cash-on-cash
- 8.26%
- DSCR
- 1.37
- GRM
- 7.4
CMA / ARV
- ARV (median comp)
- $22,750
- List price
- $79,900
- Delta
- 251.21%
- Verdict
- OVERPRICED
- Comps
- 2 within 1.0 mi
Show comp detail 3 sales within ~0.75 mi
| Address | Dist | Beds/Ba | Sqft | Sold | Price | $/sf | Match |
|---|---|---|---|---|---|---|---|
| 7930 Route 16 Lot# 40 Rd | 0.09mi | 2/1.0 | 980 (0%) | 22mo | $12,000 | $12 | 73 |
| 7930 Route 16 Lot 19 | 0.01mi | 3/1.0 (+1) | 980 (0%) | 24mo | $29,900 | $31 | 71 |
| 7930 Route 16 Lot 8 | 0.09mi | 2/2.0 | 924 (-6%) | 22mo | $19,900 | $22 | 68 |
Match score weights: distance 35% · size 25% · config 20% · recency 20%. Top-matched comps best support the ARV.
Projected returns pro-forma
5.93% appreciation · 3.0% rent growth · sell at horizon
- IRR
- 22.0%
- Equity multiple
- 2.46×
- Total profit
- $32,552
- Equity at exit
- $49,866
- IRR
- 21.0%
- Equity multiple
- 4.94×
- Total profit
- $88,184
- Equity at exit
- $90,119
Cash invested: $22,372 (down + closing). Projections, not guarantees.
Landlord ↔ Tenant lean methodology
- Overall (STATE)
- 15 Strongly Tenant-Friendly
- State New York
- 15 Strongly Tenant-Friendly · D+10
- County
- — inherits STATE
- City
- — inherits STATE
ZIP-level market 14737
- Home prices YoY
- 2.0%
- Active inventory
- 33
- Price-to-rent
- 7.4×
Monthly cashflow live
- Estimated rent
- $894 medium interval (Pro) →
- Mortgage (P&I)
- −$419
- Tax est. 1.5%
- −$100 /mo · $1,198/yr
- Insurance
- −$33
- HOA
- −$0
- Vacancy / Maint / Mgmt
- −$188
- Net cashflow
- $154
Break-even live
Sensitivity live
| Price | -10% $209 | -5% $182 | +0% $154 | +5% $126 | +10% $99 |
|---|---|---|---|---|---|
| Rent | -10% $83 | -5% $119 | +0% $154 | +5% $189 | +10% $225 |
| Rate | -1.0pp $194 | -0.5pp $174 | base $154 | +0.5pp $133 | +1.0pp $112 |
UW: 25.0% down · 7.5% · 30yr · 1.5% tax · 5.0% vac · 8.0% maint · 8.0% mgmt
Financing live
Cash to close
- Down payment
- $19,975
- Closing costs
- $2,397
- Reserves months
- —
- Total cash needed
- —
Loan-product check · same deal, 3 products live
Conventional
25% down · 7.5% · 30yr
- Down + closing
- —
- Monthly P&I
- —
- Monthly cashflow
- —
- DSCR
- —
- Eligible?
- —
Personal DTI + credit; lowest rate.
DSCR
20% down · 8.5% · 30yr
- Down + closing
- —
- Monthly P&I
- —
- Monthly cashflow
- —
- DSCR
- —
- Eligible?
- —
No personal income docs; deal must DSCR.
Hard money
10% down · 12.0% · 12mo
- Down + closing
- —
- Monthly P&I
- —
- Monthly cashflow
- —
- DSCR
- —
- Eligible?
- —
Short-term bridge; refi at stabilization.
Listing history 22 events
-
2026-06-21days on market $79,900 Active 244 DOM
-
2026-06-21days on market $79,900 Active 243 DOM
-
2026-06-18days on market $79,900 Active 241 DOM
-
2026-06-17days on market $79,900 Active 240 DOM
-
2026-06-16days on market $79,900 Active 239 DOM
-
2026-06-15days on market $79,900 Active 238 DOM
-
2026-06-13days on market $79,900 Active 236 DOM
-
2026-06-12days on market $79,900 Active 235 DOM
-
2026-06-09days on market $79,900 Active 232 DOM
-
2026-06-08days on market $79,900 Active 231 DOM
-
2026-06-07days on market $79,900 Active 230 DOM
-
2026-06-07days on market $79,900 Active 229 DOM
-
2026-06-04days on market $79,900 Active 226 DOM
-
2026-06-02days on market $79,900 Active 225 DOM
-
2026-06-01days on market $79,900 Active 224 DOM
-
2026-05-31days on market $79,900 Active 223 DOM
-
2025-10-20$79,900 Active 621-char remark
Show marketing remark (621 chars)
NEW HOME, Move in Ready, 2 bedroom, 2 full bath Manufactured home. 2x6 Exterior walls, architectural shingles, thermal windows. Spacious living room, open to eat in kitchen. Gray flat panel cabinets, gas stove, refrigerator and dishwasher. Stainless Steel deep well sink. Owner bedroom with large closet. Owner Bath walk in shower, 36" high vanity. Main bath has tub/shower, vanity. Interior whole house water shut off, vinyl skirting, 20 ft awning, 8x10 storage shed. Located in well maintained, quiet community with a country setting, close to golf course, shopping. Star tax Credit eligible. 1 pet policy per home
-
2025-10-12historical
-
2024-10-12$84,596 Active
-
2014-05-17$18,000
-
2012-05-11soldstatus $15,900
-
2010-05-28$15,900
ⓘ Source: listings_history table (triggers on properties + properties_extension) + one-shot
backfill from property_details.listing_events for pre-trigger history.
Nearby sold comps map
Loading sold comps map…
Walkable amenities ~0.75 mi
Loading nearby amenities…
Taxation est. · year 1
- Rental income
- $10,727
- − Mortgage interest
- −$4,476
- − Property taxes
- −$1,198
- − Insurance
- −$400
- − Repairs & maintenance
- −$858
- − Management
- −$858
- − Depreciation
- −$2,324
- Taxable income
- $613
- Est. tax owed @ 24.0%
- −$147
- After-tax cash flow
- $1,701/yr
For passive investors: Depreciation is non-cash, so a rental often shows a tax loss while cash-flowing — sheltering income. Rental losses are passive: they offset passive income freely, and up to $25,000/yr can offset ordinary (W-2) income if you actively participate and your MAGI is under $100k (phasing out to $0 by $150k); unused losses carry forward. On sale, claimed depreciation is recaptured at up to 25%, and gains may owe capital-gains tax (a 1031 exchange can defer both). Figures are a year-1 estimate at your 24.0% rate — not tax advice; consult a CPA.
Schools (NCES district)
- District
- Franklinville Central School District
- NCES district ID
- 3611490
- Math proficiency
- 60% ▲ 11.00%
- Reading proficiency
- 57% ▲ 16.00%
- Median HH income
- $41,110
- Composite
- 49.0/100
- National rank
- #2068
- State rank
- #281 of 590 in NY
Livability — Franklinville
- Score
- 62/100
- State rank
- #856
- US rank
- #16514
Category grades
Schools grade is shown separately in the Schools card above.
Census & demographics
- Population (ZIP)
- 4,071
Population outlook (Cattaraugus County) Hauer SSP2
- Today (2025)
- 71,623 people
- By 2030
- 67,751 · -5.4%
- By 2040
- 59,488 · -16.9%
- By 2050
- 51,601 · -28.0%
- By 2075
- 35,025 · -51.1%
- By 2100
- 21,243 · -70.3%
Race, ethnicity, and origin ACS 2023
- Neighborhood character
- Predominantly White (85%)
- Race & ethnicity
- White 85% Two or more races 9% Hispanic / Latino 5% Native American 1%
- Common ancestry
- Romanian 10% Iranian 2% Lithuanian 2%
- Foreign-born
- 2% · Canada
- Languages at home
- 97% English-only · German/W. Germanic 1%
Political lean MEDSL · Cattaraugus
- 2024 margin
- Solid R (+32.8) · D 33.6% · R 66.4%
- 2008→2024 swing
- -22.2pp toward R · 2008: -10.6pp · 2024: -32.8pp
- All cycles
- 2024: R+32.8 2020: R+29.5 2016: R+34.4 2012: R+13.4 2008: R+10.6
Not yet ingested
- Civics
- —
Market trends
- HPI YoY
- ▲ 5.93%
- Current HPI
- 305.4492
- Rent YoY
- —
- Metro
- —
- State GDP YoY
- ▲ 2.60%
- F500 in state
- 92
Industry mix (Fortune 500 HQ in NY)
| Industry | F500 HQs | Revenue |
|---|---|---|
| Financial Services | 10 | $950B |
|
||
| Consumer Goods | 9 | $162B |
|
||
| Insurance | 4 | $225B |
|
||
| Telecommunications | 2 | $144B |
|
||
| Pharmaceuticals | 2 | $112B |
|
||
| Media / Entertainment | 2 | $69B |
|
||
Price history
+402.5% since first listed6 events — show timeline
- 2025-10-20 Listed $79,900 WNYREIS
- 2025-10-12 Listing Removed — WNYREIS
- 2024-10-12 Listed $84,596 WNYREIS
- 2014-05-17 Listed $18,000 WNYREIS
- 2012-05-11 Sold (MLS) $15,900 WNYREIS
- 2010-05-28 Listed $15,900 WNYREIS
Property tax history
+0.5%/yrLatest (2015): $96 · +0.5% YoY. Source: county tax records.
Cash-flow waterfall
monthlySold comps — $/sqft
last 12 mo · ≤1 miLoading sold comps…