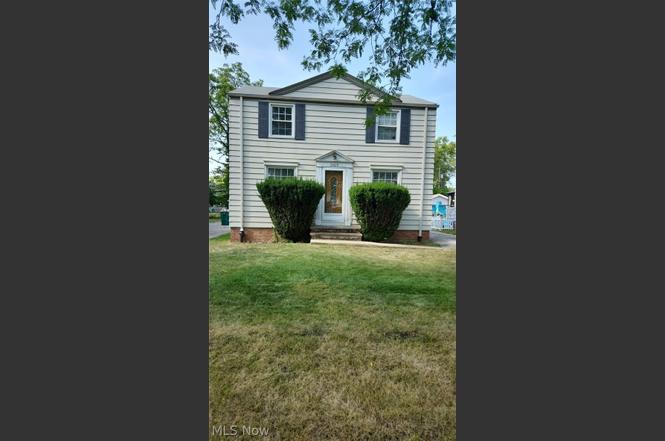
19409 Libby Rd · Maple Heights, OH
Flood risk 1/10 · Minimal
- FEMA flood zone
- X (unshaded)
- Chance of flooding over 30 yrs
- 0.0%
- Est. flood insurance / yr
- $473 – $860
Fire risk 1/10 · Minimal
- Est. fire insurance / yr
- $713 – $1,323
Heat risk 3/10 · Minor
- Hot days now (above 96°F)
- 7 days/yr
- Hot days in 30 yrs
- 17 days/yr
Wind risk 1/10 · Minimal
- Chance of severe wind over 30 yrs
- —
Air-quality risk 3/10 · Minor
- Unhealthy air days now
- 2 days/yr
- Unhealthy air days in 30 yrs
- 4 days/yr
Risk factors via First Street. Map © Google.
Why this score? — see what drove the D- grade
The composite is a weighted blend of 9 inputs, each scored 0–100. Each bar is that input's sub-score; the figure is the points it added to the 100-point composite (weight × sub-score).
- Cash flow +16.9/30.0
- DSCR +5.2/10.0
- Rent growth +5.0/5.0
- 1% rule +4.8/10.0
- Livability +3.5/5.0
- Condition / age +2.5/5.0
- Schools +1.6/10.0
- ARV discount +0.0/15.0
- Appreciation +0.0/10.0
$175,000
🖨 Deal sheet (PDF) 📄 Offer letter ✓ Due diligence
Listing remarks MLS
Look at this gorgeous 2 story colonial. Situated on a large suburban lot, this sturdy colonial has been well maintained by the owner. The property features 3 nice sized bedrooms, 1 full baths, a large 1 car garage and backyard. Two rear entrances to the property, one entrance leads you into the large dining/living room area and the second entrance lead you into the property's lovely kitchen. The property has a full usable unfinished basement with newer mechanicals. The backyard is very large and will accommodate any family gathering. The property is close to recreation, shopping, schools, police and fire. This property is being offered as-is, seller will not make any repairs. Buyer to assume Maple Heights POS. POS report and disclosures are in the supplements. No wholesaler's please, seller will not allow an assignment of the contract. All information deemed to be accurate but cannot be guaranteed. MULTIPLE OFFERS, HIGHEST AND BEST DUE Sunday 8/18/2024 by 6:00pm.
Key facts
- Fully remodeled
- New kitchen
- Finished basement
Tags
Property features AI
Exterior
- Parking: Detached garage (1 car)
- Utilities: Public water; Public sewer
- Home design: Two-story home; Shingle roof; Vinyl siding; Concrete perimeter foundation
- Construction: Built according to public records; Vinyl siding construction; Shingle roof; Concrete perimeter foundation
- Exterior features: Public water; Public sewer
Interior
- Kitchen: Range; Refrigerator
- Bedrooms: Four bedrooms — two on the lower level and two on the second level
- Bathrooms: One full bathroom
- Heating & cooling: Forced-air gas heating
- Interior features: Partial basement
- Laundry & utility: Laundry room on the lower level
Neighborhood map
What this means for you Summary
Snapshot
- This is a 3-bed/1.0-bath single-family listed at $175k.
Deal economics
- At list price, monthly cash flow is $114 ($1k/yr) — positive.
- The deal already cash-flows at list — no discount required.
- To meet the 1% rule (rent ≥ 1% of price), the offer needs to be $172k (1.7% below list).
- Recommended offer: $172k (1.7% below list) — sets the bar for 1% rule.
Location & tenants
- Location reads 70/100 on livability (#470 in OH) — a middle-class / working-renter tenant base. Strengths: cost of living A+, housing A, health & safety A-; Watch: crime D, employment D, amenities F.
- Maple Heights City (suburban): math 14% / reading 25% proficiency, ranked #630 of 656 in OH (top 96%) — low school quality limits family demand, transient renter base, plan for 1-2y turnover; 78% free/reduced lunch — lower-income household profile, screen leases tightly.
- Zoned schools: Abraham Lincoln School (479 students, 0% FRL); Milkovich Middle School (math 14% / reading 24%, grade F, #614 of 654 statewide, top 94%, 733 students, 0% FRL); Maple Heights High School (math 7% / reading 39%, grade F, #669 of 781 statewide, top 86%, 1,017 students, 0% FRL) — zoned schools average 0% FRL vs 78% district-wide (78 pts lower); this property's tenant base skews higher-income than the district average.
- Market conditions: Rents rising fast (+14.8%/yr); 86 active listings in the ZIP; 40 comparable units currently listed for rent nearby; rentals at typical pace (median 18d on market — plan ~3-4 weeks tenant-placement turnaround); 1,441 units permitted in Cuyahoga County in 2024 (700 in 5+ unit buildings).
- This rent runs 38% of the median local income ($54k/yr) — at the standard rent-burdened threshold; future hikes will face affordability resistance.
Forward outlook
- Local home prices are declining (-3.0%/yr); year-one equity from $1k of loan paydown is wiped out by about $5k of value loss. Plan a longer hold.
- Cuyahoga County population projected to shrink 8% by 2050 — rents likely to lag national; underwrite the cash flow, not the appreciation.
- At projected returns (-3.0% appreciation + 8.0% rent growth), your $49k cash investment doubles in ~10 years — after that, you're playing with house money.
Negotiation context
- Only 3 days on market — expect competitive offers; lowballing is unlikely to land.
- 2 sale attempts since 2y ago with the ask held roughly flat each time — persistent listings suggest the price (not the market) is what's stuck; bring a comps-based counter.
- Current owner paid $115k; list at $175k implies a 52% gain — meaningful room to come down on a strong offer.
Risks & watch-outs
- Watch-outs: built in 1942 — expect roof / HVAC / electrical / plumbing capex.
Questions for the listing agent
- Built in 1942 — when were the roof, HVAC, electrical panel, plumbing, and water heater last replaced?
- Is there a deadline driving the sale (1031 exchange, divorce, estate, relocation)? That informs how much negotiation room exists.
- Schools are D-rated, which usually means shorter tenancies and higher turnover. Who's the typical renter profile here, and what's been the actual vacancy rate?
- Crime grade is D in this area — have there been break-ins, vandalism, or insurance claims at this property in the last 3 years? What carrier currently insures it and at what premium?
- The area grade is low — what's the realistic commute time and amenity access for the typical tenant pool here? Any planned neighborhood developments (good or bad) we should know about?
- What's the average days-on-market for RENTAL listings here right now (not sales)? A rising rental-DOM trend means longer vacancies and softer asking-rent achievability than the comps imply.
- What's the recent tenant-quality profile in this submarket — average credit score on applications, eviction rate, late-payment / NSF rate, and stable-employment percentage? A property-management company in the area should have these aggregated.
- How much new for-sale + rental construction is in the pipeline within 1–3 miles? Heavy new supply typically softens prices + rents 12–24 months out; constrained supply supports both.
Investment metrics
- 1% rule
- 0.98% ✗
- Cap rate
- 7.08%
- Cash-on-cash
- 2.80%
- DSCR
- 1.12
- GRM
- 8.5
CMA / ARV
- ARV (on-the-fly)
- $126,672
- Comps found
- 12
Show comp detail 12 sales within ~0.75 mi
| Address | Dist | Beds/Ba | Sqft | Sold | Price | $/sf | Match |
|---|---|---|---|---|---|---|---|
| 19703 Fairway Ave | 0.46mi | 3/1.0 | 1,092 (0%) | 0mo | $151,000 | $138 | 78 |
| 18840 Nitra Ave | 0.31mi | 3/1.5 | 1,120 (+3%) | 2mo | $115,000 | $103 | 78 |
| 19312 Fairway Ave | 0.41mi | 3/1.5 | 1,092 (0%) | 1mo | $82,500 | $76 | 78 |
| 18811 Waterbury Ave | 0.52mi | 3/1.0 | 1,092 (0%) | 0mo | $168,500 | $154 | 75 |
| 18915 Longview Ave | 0.42mi | 3/1.0 | 1,040 (-5%) | 1mo | $110,000 | $106 | 72 |
| 20004 Libby Rd | 0.25mi | 3/1.0 | 1,240 (+14%) | 1mo | $129,000 | $104 | 65 |
| 5435 Beechwood Ave | 0.40mi | 3/1.5 | 1,184 (+8%) | 1mo | $137,100 | $116 | 64 |
| 20648 Donny Brook Rd | 0.72mi | 3/2.0 | 1,094 (+0%) | 1mo | $235,000 | $215 | 61 |
| 5234 Erwin St | 0.41mi | 4/1.5 (+1) | 1,204 (+10%) | 1mo | $185,000 | $154 | 56 |
| 5100 Erwin St | 0.51mi | 3/2.0 | 1,192 (+9%) | 1mo | $149,000 | $125 | 56 |
| 339 Grand Blvd | 0.70mi | 3/1.0 | 1,193 (+9%) | 1mo | $125,000 | $105 | 51 |
| 5585 South Blvd | 0.73mi | 3/2.0 | 1,251 (+15%) | 1mo | $138,000 | $110 | 37 |
Match score weights: distance 35% · size 25% · config 20% · recency 20%. Top-matched comps best support the ARV.
Projected returns pro-forma
-3.0% appreciation · 8.0% rent growth · sell at horizon
- IRR
- -6.2%
- Equity multiple
- 0.76×
- Total profit
- $-11,932
- Equity at exit
- $26,093
- IRR
- 8.8%
- Equity multiple
- 1.83×
- Total profit
- $40,555
- Equity at exit
- $15,131
Cash invested: $49,000 (down + closing). Projections, not guarantees.
Landlord ↔ Tenant lean methodology
- Overall (STATE)
- 73 Landlord-Friendly
- State Ohio
- 73 Landlord-Friendly · R+6
- County
- — inherits STATE
- City
- — inherits STATE
ZIP-level market 44137
- Home prices YoY
- -34.7%
- Rents YoY
- 14.8%
- Active inventory
- 86
- Price-to-rent
- 8.5×
Monthly cashflow live
- Estimated rent
- $1,720 high interval (Pro) →
- Mortgage (P&I)
- −$918
- Tax from tax record
- −$254 /mo · $3,042/yr
- Insurance
- −$73
- HOA
- −$0
- Vacancy / Maint / Mgmt
- −$361
- Net cashflow
- $114
Break-even live
Sensitivity live
| Price | -10% $214 | -5% $164 | +0% $114 | +5% $65 | +10% $15 |
|---|---|---|---|---|---|
| Rent | -10% $-21 | -5% $47 | +0% $114 | +5% $182 | +10% $250 |
| Rate | -1.0pp $203 | -0.5pp $159 | base $114 | +0.5pp $69 | +1.0pp $23 |
UW: 25.0% down · 7.5% · 30yr · 1.5% tax · 5.0% vac · 8.0% maint · 8.0% mgmt
Financing live
Cash to close
- Down payment
- $43,750
- Closing costs
- $5,250
- Reserves months
- —
- Total cash needed
- —
Loan-product check · same deal, 3 products live
Conventional
25% down · 7.5% · 30yr
- Down + closing
- —
- Monthly P&I
- —
- Monthly cashflow
- —
- DSCR
- —
- Eligible?
- —
Personal DTI + credit; lowest rate.
DSCR
20% down · 8.5% · 30yr
- Down + closing
- —
- Monthly P&I
- —
- Monthly cashflow
- —
- DSCR
- —
- Eligible?
- —
No personal income docs; deal must DSCR.
Hard money
10% down · 12.0% · 12mo
- Down + closing
- —
- Monthly P&I
- —
- Monthly cashflow
- —
- DSCR
- —
- Eligible?
- —
Short-term bridge; refi at stabilization.
Rent comps 40 comps
| Address | Beds | Baths | Sqft | Rent | $/sqft | DOM | Units | Dist |
|---|---|---|---|---|---|---|---|---|
| 19500 Libby Rd Maple Heights, OH | 3.0 | 1.5 | 1092 | $2,300 | $2.11 | 3d | 1 | 0.02mi |
| 5333 Hollywood Ave Maple Heights, OH | 3.0 | 1.0 | 1092 | $1,450 | $1.33 | 45d | 1 | 0.22mi |
| 19758 Maple Heights Blvd Unit UP Maple Heights, OH | 3.0 | 1.0 | 1095 | $1,495 | $1.37 | 4d | 1 | 0.28mi |
| 20115 Libby Rd Maple Heights, OH | 3.0 | 1.0 | 1365 | $1,995 | $1.46 | 3d | 1 | 0.30mi |
| 19203 Nitra Ave Maple Heights, OH | 3.0 | 1.0 | 1050 | $1,350 | $1.29 | 6d | 1 | 0.30mi |
| 19101 Nitra Ave Maple Heights, OH | 3.0 | 1.0 | 1200 | $1,295 | $1.08 | 16d | 1 | 0.31mi |
| 19001 Nitra Ave Maple Heights, OH | 3.0 | 1.0 | 1170 | $1,450 | $1.24 | 17d | 1 | 0.33mi |
| 5440 Hollywood Ave Maple Heights, OH | 3.0 | 1.0 | 1080 | $1,445 | $1.34 | 22d | 1 | 0.34mi |
| 19409 Raymond St Maple Heights, OH | 3.0 | 1.0 | 1180 | $1,656 | $1.40 | 3d | 1 | 0.35mi |
| 18990 Raymond St Maple Heights, OH | 4.0 | 1.5 | 1480 | $1,750 | $1.18 | 3d | 1 | 0.36mi |
| 18512 Lewis Dr Maple Heights, OH | 3.0 | 2.0 | 1200 | $1,995 | $1.66 | 4d | 1 | 0.37mi |
| 5470 Hollywood Ave Maple Heights, OH | 3.0 | 1.0 | 1150 | $1,375 | $1.20 | 45d | 1 | 0.38mi |
| 18851 Raymond St Maple Heights, OH | 4.0 | 2.0 | 1330 | $2,500 | $1.88 | 9d | 1 | 0.40mi |
| 20510 Mountville Dr Maple Heights, OH | 3.0 | 1.0 | 1131 | $1,850 | $1.64 | 45d | 1 | 0.40mi |
| 18505 Maple Heights Blvd Maple Heights, OH | 3.0 | 1.0 | 989 | $1,411 | $1.43 | 45d | 1 | 0.40mi |
| 20517 Mountville Dr Maple Heights, OH | 3.0 | 3.0 | 1329 | $1,731 | $1.30 | 45d | 1 | 0.41mi |
| 5535 Oakwood Ave Maple Heights, OH | 3.0 | 1.0 | 1116 | $1,350 | $1.21 | 6d | 1 | 0.42mi |
| 5535 Oakwood Ave Maple Heights, OH | 3.0 | 1.0 | 1116 | $1,350 | $1.21 | 9d | 1 | 0.42mi |
| 5331 South Blvd Maple Heights, OH | 3.0 | 2.0 | 1078 | $1,500 | $1.39 | 17d | 1 | 0.46mi |
| 18509 Raymond St Maple Heights, OH | 3.0 | 1.0 | 1083 | $1,395 | $1.29 | 45d | 1 | 0.47mi |
| 5246 Joseph St Maple Heights, OH | 3.0 | 1.5 | 890 | $1,300 | $1.46 | 4d | 1 | 0.49mi |
| 18107 North Blvd Maple Heights, OH | 3.0 | 1.0 | 1190 | $1,350 | $1.13 | 45d | 1 | 0.50mi |
| 18004 North Blvd Maple Heights, OH | 3.0 | 1.0 | 1396 | $1,700 | $1.22 | 45d | 1 | 0.54mi |
| 18308 Edinboro Ave Maple Heights, OH | 3.0 | 1.0 | 1200 | $1,349 | $1.12 | 9d | 1 | 0.56mi |
| 5566 Beechwood Ave Maple Heights, OH | 2.0 | 1.0 | 1000 | $1,800 | $1.80 | 20d | 1 | 0.56mi |
| 20600 Watson Rd Maple Heights, OH | 3.0 | 1.5 | 1092 | $1,953 | $1.79 | 3d | 1 | 0.56mi |
| 18413 Waterbury Ave Maple Heights, OH | 3.0 | 1.5 | 1175 | $1,850 | $1.57 | 3d | 1 | 0.59mi |
| 20605 Hansen Rd Maple Heights, OH | 4.0 | 1.0 | 1164 | $1,850 | $1.59 | 45d | 1 | 0.63mi |
| 21106 Gardenview Dr Maple Heights, OH | 3.0 | 2.0 | 1188 | $1,600 | $1.35 | 3d | 1 | 0.63mi |
| 5383 Sunnyslope Rd Maple Heights, OH | 1.0–2.0 | 1.0–1.5 | 847 | $1,075 | $1.27 | 6d | 2 | 0.64mi |
| 18123 McCracken Rd Maple Heights, OH | 3.0 | 1.0 | 1215 | $1,600 | $1.32 | 9d | 1 | 0.69mi |
| 21206 Hillgrove Ave Maple Heights, OH | 3.0 | 1.5 | 1056 | $1,375 | $1.30 | 45d | 1 | 0.70mi |
| 21303 Kenyon Dr Maple Heights, OH | 3.0 | 1.0 | 1215 | $1,400 | $1.15 | 45d | 1 | 0.71mi |
| 21111 Raymond St Maple Heights, OH | 3.0 | 1.0 | 1100 | $1,275 | $1.16 | 45d | 1 | 0.73mi |
| 5107 Philip Ave Maple Heights, OH | 3.0 | 1.0 | 1188 | $1,800 | $1.52 | 9d | 1 | 0.76mi |
| 243 Grand Blvd Bedford, OH | 3.0 | 2.0 | 1170 | $1,500 | $1.28 | 45d | 1 | 0.82mi |
| 21418 Raymond St Maple Heights, OH | 3.0 | 2.0 | 1158 | $1,695 | $1.46 | 16d | 1 | 0.84mi |
| 17206 Mapleboro Ave Maple Heights, OH | 3.0 | 1.0 | 1020 | $1,325 | $1.30 | 25d | 1 | 0.84mi |
| 17204 Mapleboro Ave Maple Heights, OH | 3.0 | 1.0 | 1074 | $1,475 | $1.37 | 45d | 1 | 0.85mi |
| 5461 Clement Ave Maple Heights, OH | 3.0 | 1.5 | 1260 | $1,350 | $1.07 | 17d | 1 | 0.86mi |
Listing history 3 events
-
2026-06-21days on market $175,000 Active 3 DOM
-
2026-06-19remarks 681-char remark
-
2026-06-19$175,000 Active 1 DOM
ⓘ Source: listings_history table (triggers on properties + properties_extension) + one-shot
backfill from property_details.listing_events for pre-trigger history.
Tax reassessment forecast OH · Partial reset (capped growth)
- Current annual tax
- $3,042 · $254/mo
- Projected year-2 tax
- $3,042 · $254/mo
- Expected delta
- $0/yr ($0/mo · -0.0%)
ⓘ Screening estimate from a state-policy table — verify with the county assessor before closing.
Climate risk First Street
- Flood 1/10 Low FEMA zone X (unshaded) · 0% chance over 30 yrs
- Wildfire 1/10 Low
- Heat 3/10 Moderate 7 d/yr ≥96°F today · 17 d/yr by 30 yrs out
- Wind 1/10 Low
- Air quality 3/10 Moderate 2 unhealthy d/yr today · 4 by 30 yrs out
Nearby sold comps map
Loading sold comps map…
Walkable amenities ~0.75 mi
Loading nearby amenities…
Taxation est. · year 1
- Rental income
- $20,637
- − Mortgage interest
- −$9,803
- − Property taxes
- −$3,042
- − Insurance
- −$875
- − Repairs & maintenance
- −$1,651
- − Management
- −$1,651
- − Depreciation
- −$5,091
- Taxable loss
- −$1,476
- Est. tax savings @ 24.0%
- +$354
- After-tax cash flow
- $1,728/yr
For passive investors: Depreciation is non-cash, so a rental often shows a tax loss while cash-flowing — sheltering income. Rental losses are passive: they offset passive income freely, and up to $25,000/yr can offset ordinary (W-2) income if you actively participate and your MAGI is under $100k (phasing out to $0 by $150k); unused losses carry forward. On sale, claimed depreciation is recaptured at up to 25%, and gains may owe capital-gains tax (a 1031 exchange can defer both). Figures are a year-1 estimate at your 24.0% rate — not tax advice; consult a CPA.
Schools (NCES district)
- District
- Maple Heights City
- NCES district ID
- 3904430
- Math proficiency
- 14% ▼ -22.00%
- Reading proficiency
- 25% ▼ -11.00%
- Median HH income
- $38,856
- Composite
- 16.39/100
- National rank
- #9197
- State rank
- #630 of 656 in OH
Livability — Maple Heights
- Score
- 70/100
- State rank
- #470
- US rank
- #7818
Category grades
Schools grade is shown separately in the Schools card above.
Census & demographics
- Census place
- Maple Heights, OH
- County
- Cuyahoga County · 1,090,369 people
- City population
- 23,285
- Metro
- Cleveland-Elyria, OH
- Population (ZIP)
- 23,285
- Household income
- $53,918
- Rent vs Own
- Severe rent burden
- 971.0
Population outlook (Cuyahoga County) Hauer SSP2
- Today (2025)
- 1,244,621 people
- By 2030
- 1,230,093 · -1.2%
- By 2040
- 1,189,108 · -4.5%
- By 2050
- 1,145,706 · -7.9%
- By 2075
- 1,076,557 · -13.5%
- By 2100
- 978,987 · -21.3%
Race, ethnicity, and origin ACS 2023
- Neighborhood character
- Predominantly Black (74%)
- Race & ethnicity
- Black 74% White 20% Two or more races 4% Hispanic / Latino 2%
- Common ancestry
- Romanian 3% Scotch-Irish 2%
- Foreign-born
- 2% · Canada, China
- Languages at home
- 98% English-only · Spanish 1%
Political lean MEDSL · Cuyahoga
- 2024 margin
- Solid D (+31.5) · D 65.4% · R 33.9%
- 2008→2024 swing
- -7.4pp toward R · 2008: 38.9pp · 2024: 31.5pp
- All cycles
- 2024: D+31.5 2020: D+34.1 2016: D+35.0 2012: D+38.7 2008: D+38.9
Not yet ingested
- Civics
- —
Market trends
- HPI YoY
- ▼ -87.37%
- Current HPI
- 164.4326
- Rent YoY
- ▲ 14.82%
- Metro
- Cleveland-Elyria, OH
- State GDP YoY
- ▲ 1.98%
- F500 in state
- 48
Industry mix (Fortune 500 HQ in OH)
| Industry | F500 HQs | Revenue |
|---|---|---|
| Insurance | 3 | $145B |
|
||
| Industrial Machinery | 3 | $49B |
|
||
| Financial Services | 3 | $24B |
|
||
| Consumer Goods | 2 | $93B |
|
||
| Aerospace / Defense | 2 | $47B |
|
||
| Utilities | 2 | $33B |
|
||
Price history
+46.0% since first listed5 events — show timeline
- 2026-06-18 Listed $175,000 MLSNOW
- 2024-09-03 Sold (Public Records) $115,000 Public Records
- 2024-08-29 Sold (MLS) $115,000 MLSNOW
- 2024-08-08 Pending — MLSNOW
- 2024-07-25 Listed $119,900 MLSNOW
Property tax history
+4.3%/yrLatest (2025): $3,042 · -10.1% YoY. Source: county tax records.
Cash-flow waterfall
monthlySold comps — $/sqft
last 12 mo · ≤1 miLoading sold comps…