 Triplex
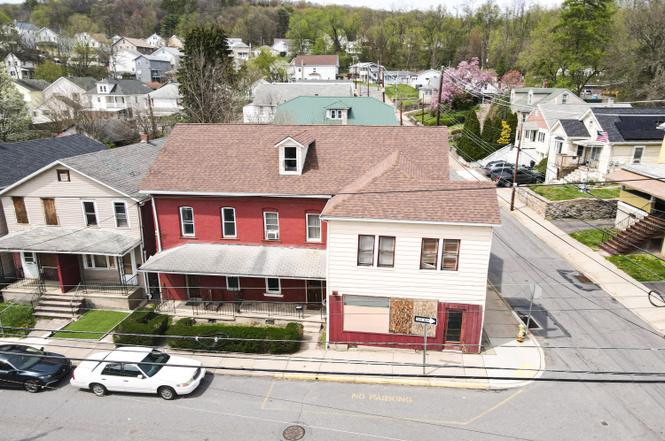
163-167 Willow St · Plymouth, PA
Flood risk No data
- FEMA flood zone
- —
- Chance of flooding over 30 yrs
- —
- Est. flood insurance / yr
- —
Fire risk No data
- Est. fire insurance / yr
- —
Heat risk No data
- Hot days now (above threshold)
- —
- Hot days in 30 yrs
- —
Wind risk No data
- Chance of severe wind over 30 yrs
- —
Air-quality risk No data
- Unhealthy air days now
- —
- Unhealthy air days in 30 yrs
- —
Risk factors via First Street. Map © Google.
Why this score? — see what drove the B- grade
The composite is a weighted blend of 9 inputs, each scored 0–100. Each bar is that input's sub-score; the figure is the points it added to the 100-point composite (weight × sub-score).
- Cash flow +30.0/30.0
- DSCR +10.0/10.0
- 1% rule +9.3/10.0
- ARV discount +7.5/15.0
- Livability +3.3/5.0
- Rent growth +2.5/5.0
- Schools +2.5/10.0
- Condition / age +1.0/5.0
- Appreciation +0.0/10.0
$289,000
🖨 Deal sheet (PDF) 📄 Offer letter ✓ Due diligence
Multi-family units
County records classify this as Multi-Family (2-4 Unit). Listing-text estimate: 3 units. confirmed
Listing remarks MLS
Great Investment! Own 2 Lots - 4 Units with 3 Residential Units, 1 Previous Corner Market and a Large Parking Lot across the Street for 10+ Cars. Each Residential Unit has 3 Bedrooms for an Outstanding Income Potential. So many Opportunities with a Corner Market or Any other Business that is Centrally Located. All Units are Vacant Priced to Sale. Don't Miss Out!
Key facts
- 4 units
- Large parking lot
- Centrally located
Tags
Property features AI
Finance
- Other: Four total units; Unit descriptions: Unit 1 — Vacant; Unit 2 — Vacant - Fixer Upper; Unit 3 — Vacant Fixer Upper; Unit 4 — Vacant Fixer Upper
- Financial info: Taxes reported for 2025 (tax amounts provided)
Exterior
- Parking: Ten parking spaces
- Home design: Built in 1926; Property type: Residential income (Multi Family); Total above-grade finished area reported as 4,900
- Construction: Year built 1926
- Exterior features: Lot measures approximately 2.04 acres; Lot dimensions approx. 81 x 59 + 92 x 56
Interior
- Kitchen: Unit 1 has a kitchen; Units 2, 3 and 4 listed without kitchens
- Bedrooms: Total of 9 bedrooms across the building; Unit 1: 3 bedrooms; Unit 2: 3 bedrooms; Unit 3: 3 bedrooms
- Bathrooms: One full bathroom in the building (count listed as 1); Unit 1: 1 bathroom; Unit 4: 1 bathroom
- Interior features: Multi-family residential income property
Neighborhood map
What this means for you Summary
Snapshot
- This is a 3 × 3-bed/0.3-bath units multifamily listed at $289k. Condition is rated poor.
Deal economics
- At list price, monthly cash flow is $1k ($15k/yr) — positive. Per door: $421/mo.
- The deal already cash-flows at list — no discount required.
- Meets the 1% rule at list price ($4k rent vs $289k).
- Cap rate 11.5% vs local median 8.3% in Plymouth — top-decile yield for the area; either an underpriced asset or a hidden risk that comps aren't pricing in. Stress-test before assuming the spread holds.
Location & tenants
- Location reads 66/100 on livability (#1,068 in PA) — a middle-class / working-renter tenant base. Strengths: cost of living A+, health & safety A+, housing B+; Watch: employment D, crime F, amenities F.
- Wyoming Valley West SD (suburban): math 18% / reading 42% proficiency, ranked #445 of 539 in PA (top 83%) — families likely to look elsewhere, expect single-tenant / working-renter base with shorter leases.
- Zoned schools: State El Ctr (math 8% / reading 32%, grade F, #1,248 of 1,518 statewide, top 83%, 1,353 students, 100% FRL); Wyoming Valley West Ms (math 13% / reading 41%, grade F, #404 of 512 statewide, top 80%, 1,191 students, 100% FRL); Wyoming Valley West Shs (math 57% / reading 24%, grade F, #255 of 437 statewide, top 60%, 1,357 students, 100% FRL) — zoned schools average 100% FRL vs 56% district-wide (44 pts higher); higher-poverty schools than district average — tighter screening recommended.
- Market conditions: 61 active listings in the ZIP; 349 units permitted in Luzerne County in 2024 (16 in 5+ unit buildings).
Forward outlook
- Local home prices are declining (-3.0%/yr); year-one equity from $2k of loan paydown is wiped out by about $9k of value loss. Plan a longer hold.
- Luzerne County population projected at +4% by 2050 — modest demand growth; plan on rents tracking national, not racing it.
- At projected returns (-3.0% appreciation + 3.0% rent growth), your $81k cash investment doubles in ~7 years — after that, you're playing with house money.
Negotiation context
- Only 4 days on market — expect competitive offers; lowballing is unlikely to land.
- 2 sale attempts with the ask held roughly flat each time — persistent listings suggest the price (not the market) is what's stuck; bring a comps-based counter.
Risks & watch-outs
- Watch-outs: built in 1926 — expect roof / HVAC / electrical / plumbing capex.
Questions for the listing agent
- Can we see the unit-by-unit rent roll, current vacancy, and any below-market leases? What's the average tenancy length?
- What capital expenditures (roof, boiler, parking lot, exteriors) have been made in the last 5 years, and what's planned in the next 2?
- Have any recent inspections been done? Can we get a copy of the seller's disclosures and any deferred-maintenance estimates?
- Built in 1926 — when were the roof, HVAC, electrical panel, plumbing, and water heater last replaced?
- Is there a deadline driving the sale (1031 exchange, divorce, estate, relocation)? That informs how much negotiation room exists.
- Crime grade is F in this area — have there been break-ins, vandalism, or insurance claims at this property in the last 3 years? What carrier currently insures it and at what premium?
- What's the average days-on-market for RENTAL listings here right now (not sales)? A rising rental-DOM trend means longer vacancies and softer asking-rent achievability than the comps imply.
- What's the recent tenant-quality profile in this submarket — average credit score on applications, eviction rate, late-payment / NSF rate, and stable-employment percentage? A property-management company in the area should have these aggregated.
- How much new apartment / multifamily construction is in the pipeline within 1–3 miles? Heavy new supply (>2% of stock underway) typically softens rents 12–24 months out; light construction supports rent growth.
Investment metrics
- 1% rule
- 1.43% ✓
- Cap rate
- 11.54%
- Cash-on-cash
- 18.73%
- DSCR
- 1.83
- GRM
- 5.8
CMA / ARV
No comps found within radius.
Projected returns pro-forma
-3.0% appreciation · 3.0% rent growth · sell at horizon
- IRR
- 10.5%
- Equity multiple
- 1.42×
- Total profit
- $33,680
- Equity at exit
- $43,091
- IRR
- 19.6%
- Equity multiple
- 2.65×
- Total profit
- $133,172
- Equity at exit
- $24,987
Cash invested: $80,920 (down + closing). Projections, not guarantees.
Landlord ↔ Tenant lean methodology
- Overall (STATE)
- 62 Landlord-Friendly
- State Pennsylvania
- 62 Landlord-Friendly · EVEN
- County
- — inherits STATE
- City
- — inherits STATE
ZIP-level market 18651
- Home prices YoY
- -11.5%
- Active inventory
- 61
- Price-to-rent
- 17.5×
Monthly cashflow live
- Estimated rent
- $4,127 high interval (Pro) →
- Mortgage (P&I)
- −$1,516
- Tax est. 1.5%
- −$361 /mo · $4,335/yr
- Insurance
- −$120
- HOA
- −$0
- Vacancy / Maint / Mgmt
- −$867
- Net cashflow
- $1,263
Break-even live
Sensitivity live
| Price | -10% $1,463 | -5% $1,363 | +0% $1,263 | +5% $1,163 | +10% $1,063 |
|---|---|---|---|---|---|
| Rent | -10% $937 | -5% $1,100 | +0% $1,263 | +5% $1,426 | +10% $1,589 |
| Rate | -1.0pp $1,409 | -0.5pp $1,337 | base $1,263 | +0.5pp $1,188 | +1.0pp $1,112 |
3-unit breakdown (identical units grouped — click to expand)
| Units | Beds | Baths | Est. rent |
|---|---|---|---|
| 3× units | 3 | 0.3 | $4,128 |
| #1 | 3 | 0.3 | $1,376 |
| #2 | 3 | 0.3 | $1,376 |
| #3 | 3 | 0.3 | $1,376 |
| Total (3 units) | $4,127 | ||
UW: 25.0% down · 7.5% · 30yr · 1.5% tax · 5.0% vac · 8.0% maint · 8.0% mgmt
Financing live
Cash to close
- Down payment
- $72,250
- Closing costs
- $8,670
- Reserves months
- —
- Total cash needed
- —
Loan-product check · same deal, 3 products live
Conventional
25% down · 7.5% · 30yr
- Down + closing
- —
- Monthly P&I
- —
- Monthly cashflow
- —
- DSCR
- —
- Eligible?
- —
Personal DTI + credit; lowest rate.
DSCR
20% down · 8.5% · 30yr
- Down + closing
- —
- Monthly P&I
- —
- Monthly cashflow
- —
- DSCR
- —
- Eligible?
- —
No personal income docs; deal must DSCR.
Hard money
10% down · 12.0% · 12mo
- Down + closing
- —
- Monthly P&I
- —
- Monthly cashflow
- —
- DSCR
- —
- Eligible?
- —
Short-term bridge; refi at stabilization.
Listing history 5 events
-
2026-06-18days on market $289,000 Active 4 DOM
-
2026-06-17days on market $289,000 Active 3 DOM
-
2026-06-16days on market $289,000 Active 2 DOM
-
2026-06-15remarks 364-char remark
-
2026-06-15$289,000 Active 1 DOM
ⓘ Source: listings_history table (triggers on properties + properties_extension) + one-shot
backfill from property_details.listing_events for pre-trigger history.
Nearby sold comps map
Loading sold comps map…
Walkable amenities ~0.75 mi
Loading nearby amenities…
Taxation est. · year 1
- Rental income
- $49,524
- − Mortgage interest
- −$16,188
- − Property taxes
- −$4,335
- − Insurance
- −$1,445
- − Repairs & maintenance
- −$3,962
- − Management
- −$3,962
- − Depreciation
- −$8,407
- Taxable income
- $11,224
- Est. tax owed @ 24.0%
- −$2,694
- After-tax cash flow
- $12,464/yr
For passive investors: Depreciation is non-cash, so a rental often shows a tax loss while cash-flowing — sheltering income. Rental losses are passive: they offset passive income freely, and up to $25,000/yr can offset ordinary (W-2) income if you actively participate and your MAGI is under $100k (phasing out to $0 by $150k); unused losses carry forward. On sale, claimed depreciation is recaptured at up to 25%, and gains may owe capital-gains tax (a 1031 exchange can defer both). Figures are a year-1 estimate at your 24.0% rate — not tax advice; consult a CPA.
Condition & rehab AI · 12 photos
This multi-family property requires extensive repairs and renovations to bring it up to a livable condition. Immediate attention is needed to address the deteriorating roof, exterior, and interior conditions to increase its resale and rental value.
Repairs flagged
- Major roof — Aging and weathered
- Major exterior siding — Worn and in need of repair
- Major flooring — Worn and in need of replacement
- Major interior walls/paint — Chipped and peeling
- Major windows — Old and may need replacement
- Major HVAC/mechanicals — Old and may need replacement
- Major foundation/structure — Unstable and may need repair
Value-add opportunities
- Both Clean and organize living areas — Improves aesthetics and functionality
- Both Replace worn flooring — Enhances comfort and durability
- Both Repair and paint interior walls — Enhances appearance and value
- Both Replace old windows — Improves energy efficiency and curb appeal
- Both Replace HVAC units — Improves comfort and energy efficiency
- Both Repair foundation and structure — Ensures structural integrity and safety
Renovation cost estimate screening
| Repair item | Severity | Est. cost |
|---|---|---|
| roof · Aging and weathered | Major | $15,000–50,000 |
| exterior siding · Worn and in need of repair | Major | $15,000–50,000 |
| flooring · Worn and in need of replacement | Major | $15,000–50,000 |
| interior walls/paint · Chipped and peeling | Major | $15,000–50,000 |
| windows · Old and may need replacement | Major | $15,000–50,000 |
| HVAC/mechanicals · Old and may need replacement | Major | $15,000–50,000 |
| foundation/structure · Unstable and may need repair | Major | $15,000–50,000 |
| Total estimated repair cost · 7 items | $105,000–350,000 |
Value-add ROI direction
- Both Clean and organize living areas — Improves aesthetics and functionality ↑
- Both Replace worn flooring — Enhances comfort and durability ↑
- Both Repair and paint interior walls — Enhances appearance and value ↑
- Both Replace old windows — Improves energy efficiency and curb appeal ↑
- Both Replace HVAC units — Improves comfort and energy efficiency ↑
- Both Repair foundation and structure — Ensures structural integrity and safety ↑
ⓘ Cost ranges are severity-bucket heuristics (US national rule-of-thumb). Get contractor quotes + a written scope before underwriting a rehab budget.
Schools (NCES district)
- District
- Wyoming Valley West SD
- NCES district ID
- 4225950
- Math proficiency
- 18% ▼ -11.00%
- Reading proficiency
- 42% ▼ -12.00%
- Median HH income
- $42,437
- Composite
- 25.38/100
- National rank
- #7470
- State rank
- #445 of 539 in PA
Livability — Plymouth
- Score
- 66/100
- State rank
- #1068
- US rank
- #12056
Category grades
Schools grade is shown separately in the Schools card above.
Census & demographics
- Census place
- Plymouth, PA
- Population (ZIP)
- 8,672
Population outlook (Luzerne County) Hauer SSP2
- Today (2025)
- 319,505 people
- By 2030
- 319,943 · +0.1%
- By 2040
- 322,643 · +1.0%
- By 2050
- 330,817 · +3.5%
- By 2075
- 379,145 · +18.7%
- By 2100
- 431,908 · +35.2%
Race, ethnicity, and origin ACS 2023
- Neighborhood character
- Predominantly White (82%)
- Race & ethnicity
- White 82% Hispanic / Latino 10% Black 5% Two or more races 4%
- Hispanic origin (detail)
- Mexican 3% Dominican 5%
- Common ancestry
- Romanian 19% Scotch-Irish 2% Iranian 2%
- Foreign-born
- 5% · Canada
- Languages at home
- 91% English-only · Spanish 7% Other Indo-European 1%
Political lean MEDSL · Luzerne
- 2024 margin
- R (+19.2) · D 40.0% · R 59.2%
- 2008→2024 swing
- -27.6pp toward R · 2008: 8.4pp · 2024: -19.2pp
- All cycles
- 2024: R+19.2 2020: R+14.4 2016: R+19.6 2012: D+4.8 2008: D+8.4
Not yet ingested
- Civics
- —
Market trends
- HPI YoY
- ▼ -29.78%
- Current HPI
- 229.6791
- Rent YoY
- —
- Metro
- —
- State GDP YoY
- ▲ 1.68%
- F500 in state
- 34
Industry mix (Fortune 500 HQ in PA)
| Industry | F500 HQs | Revenue |
|---|---|---|
| Healthcare | 2 | $309B |
|
||
| Insurance | 2 | $27B |
|
||
| Telecommunications / Media | 1 | $124B |
|
||
| Industrial Distribution | 1 | $22B |
|
||
| Financial Services | 1 | $20B |
|
||
| Chemicals / Materials | 1 | $18B |
|
||
Price history
+0.0% since first listed2 events — show timeline
- 2026-06-16 Listed $289,000 GSBR as distributed by MLS GRID
- 2026-06-14 Listed $289,000 LCAR
Cash-flow waterfall
monthlySold comps — $/sqft
last 12 mo · ≤1 miLoading sold comps…