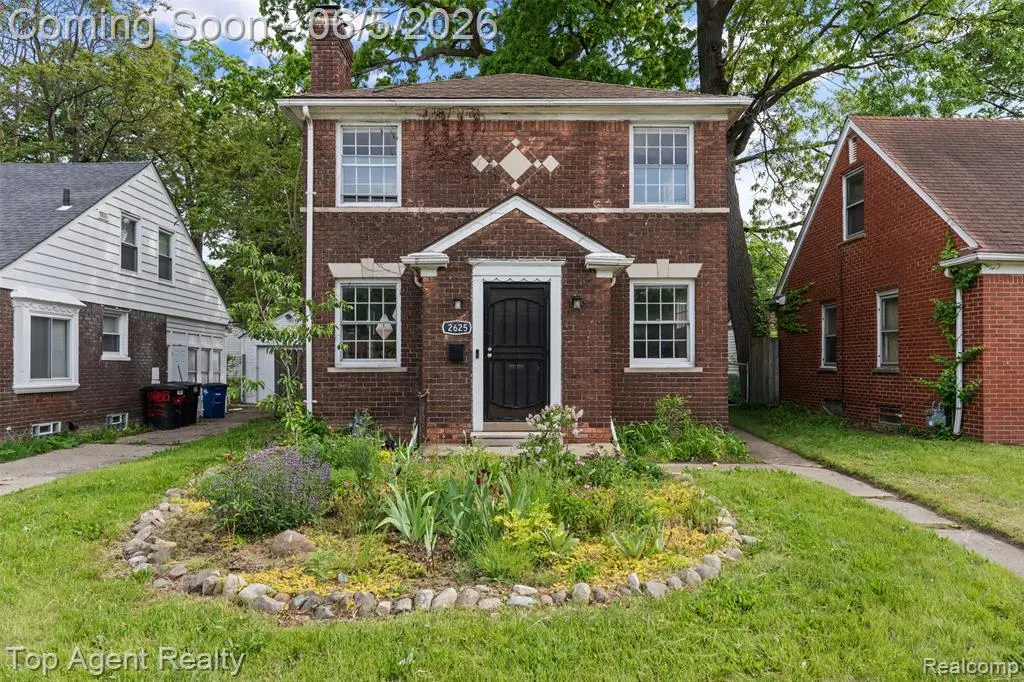
2625 W 8 Mile Rd · Detroit, MI
Flood risk 1/10 · Minimal
- FEMA flood zone
- X (unshaded)
- Chance of flooding over 30 yrs
- 0.0%
- Est. flood insurance / yr
- $473 – $860
Fire risk 2/10 · Minimal
- Est. fire insurance / yr
- $784 – $1,456
Heat risk 3/10 · Minor
- Hot days now (above 97°F)
- 7 days/yr
- Hot days in 30 yrs
- 15 days/yr
Wind risk 2/10 · Minimal
- Chance of severe wind over 30 yrs
- —
Air-quality risk 4/10 · Minor
- Unhealthy air days now
- 4 days/yr
- Unhealthy air days in 30 yrs
- 6 days/yr
Risk factors via First Street. Map © Google.
Why this score? — see what drove the C+ grade
The composite is a weighted blend of 9 inputs, each scored 0–100. Each bar is that input's sub-score; the figure is the points it added to the 100-point composite (weight × sub-score).
- Cash flow +23.9/30.0
- ARV discount +15.0/15.0
- DSCR +7.7/10.0
- 1% rule +6.2/10.0
- Livability +3.7/5.0
- Rent growth +3.4/5.0
- Condition / age +2.5/5.0
- Schools +1.3/10.0
- Appreciation +0.0/10.0
$139,900
🖨 Deal sheet (PDF) 📄 Offer letter ✓ Due diligence
Listing remarks MLS
Step into charm and comfort with this beautifully updated all-brick colonial! Inside, you'll find two spacious bedrooms, a generous living room, and a stunning brand-new kitchen - perfect for both everyday living and entertaining. The main level features all-new vinyl flooring, while the upper level features warm wood floors that add a classic touch. Downstairs, the full basement houses a new furnace and water heater, with plenty of room for storage or future finishing. Outside, enjoy a private backyard patio ideal for relaxing or hosting. Conveniently located near major freeways for a smooth and easy commute.
Key facts
- 3,920 sq ft lot
- Built 1939
- Listed 16 days
Property features AI
Exterior
- Utilities: Public water; Natural gas
- Home design: Residential 2-story home built in 1939; Frontage approximately 50 feet
- Construction: Basement foundation; Below-grade area approximately 506
- Exterior features: Brick exterior; Paved street access
Interior
- Bedrooms: Two bedrooms located on the second floor (17 x 11; 10 x 11)
- Bathrooms: One full bathroom (located on the second floor)
- Heating & cooling: Forced air heating; Central A/C; Gas water heater
- Interior features: Total of 3 rooms; Unfinished basement
Neighborhood map
What this means for you Summary
Snapshot
- This is a 2-bed/1.0-bath single-family listed at $140k.
Deal economics
- At list price, monthly cash flow is $271 ($3k/yr) — positive.
- The deal already cash-flows at list — no discount required.
- Meets the 1% rule at list price ($2k rent vs $140k).
- Recommended offer: $138k (1.5% below list) — sets the bar for market timing.
Location & tenants
- Location reads 73/100 on livability (#218 in MI) — a middle-class / working-renter tenant base. Strengths: amenities A+, commute A+, cost of living A+; Watch: crime F, employment F.
- Detroit Public Schools Community District (urban): math 10% / reading 24% proficiency, ranked #499 of 540 in MI (top 92%) — low school quality limits family demand, transient renter base, plan for 1-2y turnover; 90% free/reduced lunch — lower-income household profile, screen leases tightly.
- Zoned schools: Pasteur Elementary School (math 10% / reading 10%, grade F, #1,230 of 1,397 statewide, top 91%, 312 students, 88% FRL); Mumford High School (math 24% / reading 24%, grade F, #481 of 713 statewide, top 81%, 889 students, 86% FRL) — zoned schools at 87% FRL track the district average.
- Market conditions: Rents rising (+3.4%/yr); 349 active listings in the ZIP; 40 comparable units currently listed for rent nearby; rentals at typical pace (median 26d on market — plan ~3-4 weeks tenant-placement turnaround); 2,639 units permitted in Wayne County in 2024 (1,216 in 5+ unit buildings).
- This rent runs 32% of the median local income ($58k/yr) — at the standard rent-burdened threshold; future hikes will face affordability resistance.
Forward outlook
- Local home prices are declining (-3.0%/yr); year-one equity from $967 of loan paydown is wiped out by about $4k of value loss. Plan a longer hold.
- Wayne County population projected at -17% by 2050 — secular population decline; favor cash flow + early exit over multi-decade hold.
Negotiation context
- It's been on market 17 days — a 2% lower offer ($138k) is reasonable based on typical stale-listing flexibility.
- 14 sale attempts since 9y ago; this cycle's ask is 12% above the opening price — seller raised mid-cycle; expect resistance to lowballs.
- Current owner paid $115k; 22% above their basis — modest negotiation headroom, anchor on the comps not their cost.
Risks & watch-outs
- Watch-outs: built in 1939 — expect roof / HVAC / electrical / plumbing capex.
Questions for the listing agent
- Built in 1939 — when were the roof, HVAC, electrical panel, plumbing, and water heater last replaced?
- Is there a deadline driving the sale (1031 exchange, divorce, estate, relocation)? That informs how much negotiation room exists.
- Schools are F-rated, which usually means shorter tenancies and higher turnover. Who's the typical renter profile here, and what's been the actual vacancy rate?
- Crime grade is F in this area — have there been break-ins, vandalism, or insurance claims at this property in the last 3 years? What carrier currently insures it and at what premium?
- What's the average days-on-market for RENTAL listings here right now (not sales)? A rising rental-DOM trend means longer vacancies and softer asking-rent achievability than the comps imply.
- What's the recent tenant-quality profile in this submarket — average credit score on applications, eviction rate, late-payment / NSF rate, and stable-employment percentage? A property-management company in the area should have these aggregated.
- How much new for-sale + rental construction is in the pipeline within 1–3 miles? Heavy new supply typically softens prices + rents 12–24 months out; constrained supply supports both.
Investment metrics
- 1% rule
- 1.12% ✓
- Cap rate
- 8.61%
- Cash-on-cash
- 8.29%
- DSCR
- 1.37
- GRM
- 7.4
CMA / ARV
- ARV (on-the-fly)
- $250,472
- Comps found
- 12
Show comp detail 12 sales within ~0.75 mi
| Address | Dist | Beds/Ba | Sqft | Sold | Price | $/sf | Match |
|---|---|---|---|---|---|---|---|
| 207 Saint Louis St | 0.20mi | 3/2.0 (+1) | 1,014 (-3%) | 2mo | $255,000 | $251 | 74 |
| 808 Laprairie St | 0.56mi | 2/1.0 | 1,050 (+0%) | 2mo | $210,000 | $200 | 72 |
| 321 E Webster St | 0.40mi | 3/2.0 (+1) | 1,057 (+1%) | 1mo | $315,000 | $298 | 70 |
| 186 Jewell St | 0.39mi | 3/1.0 (+1) | 1,100 (+5%) | 1mo | $250,000 | $227 | 68 |
| 774 Gardendale St | 0.67mi | 2/1.0 | 1,058 (+1%) | 2mo | $221,000 | $209 | 66 |
| 918 Saint Louis St | 0.57mi | 2/1.0 | 1,007 (-4%) | 3mo | $140,000 | $139 | 64 |
| 384 E Chesterfield St | 0.47mi | 3/2.0 (+1) | 1,006 (-4%) | 2mo | $252,500 | $251 | 61 |
| 486 University St | 0.74mi | 3/2.0 (+1) | 1,054 (+1%) | 1mo | $307,000 | $291 | 54 |
| 791 Wordsworth St | 0.71mi | 3/1.0 (+1) | 1,006 (-4%) | 2mo | $240,000 | $239 | 54 |
| 201 E Bennett Ave | 0.33mi | 3/2.0 (+1) | 1,200 (+14%) | 3mo | $199,900 | $167 | 49 |
| 448 Wordsworth St | 0.61mi | 3/1.0 (+1) | 1,182 (+13%) | 1mo | $255,000 | $216 | 44 |
| 718 Meadowdale St | 0.60mi | 3/1.0 (+1) | 1,200 (+14%) | 2mo | $290,000 | $242 | 41 |
Match score weights: distance 35% · size 25% · config 20% · recency 20%. Top-matched comps best support the ARV.
Projected returns pro-forma
-3.0% appreciation · 3.44% rent growth · sell at horizon
- IRR
- -3.2%
- Equity multiple
- 0.88×
- Total profit
- $-4,717
- Equity at exit
- $20,860
- IRR
- 7.0%
- Equity multiple
- 1.54×
- Total profit
- $21,062
- Equity at exit
- $12,096
Cash invested: $39,172 (down + closing). Projections, not guarantees.
Landlord ↔ Tenant lean methodology
- Overall (STATE)
- 62 Landlord-Friendly
- State Michigan
- 62 Landlord-Friendly · EVEN
- County
- — inherits STATE
- City
- — inherits STATE
ZIP-level market 48221
- Rents YoY
- 3.4%
- Active inventory
- 349
- Price-to-rent
- 7.4×
Monthly cashflow live
- Estimated rent
- $1,566 high interval (Pro) →
- Mortgage (P&I)
- −$734
- Tax est. 1.5%
- −$175 /mo · $2,098/yr
- Insurance
- −$58
- HOA
- −$0
- Vacancy / Maint / Mgmt
- −$329
- Net cashflow
- $271
Break-even live
Sensitivity live
| Price | -10% $367 | -5% $319 | +0% $271 | +5% $222 | +10% $174 |
|---|---|---|---|---|---|
| Rent | -10% $147 | -5% $209 | +0% $271 | +5% $332 | +10% $394 |
| Rate | -1.0pp $341 | -0.5pp $306 | base $271 | +0.5pp $234 | +1.0pp $197 |
UW: 25.0% down · 7.5% · 30yr · 1.5% tax · 5.0% vac · 8.0% maint · 8.0% mgmt
Financing live
Cash to close
- Down payment
- $34,975
- Closing costs
- $4,197
- Reserves months
- —
- Total cash needed
- —
Loan-product check · same deal, 3 products live
Conventional
25% down · 7.5% · 30yr
- Down + closing
- —
- Monthly P&I
- —
- Monthly cashflow
- —
- DSCR
- —
- Eligible?
- —
Personal DTI + credit; lowest rate.
DSCR
20% down · 8.5% · 30yr
- Down + closing
- —
- Monthly P&I
- —
- Monthly cashflow
- —
- DSCR
- —
- Eligible?
- —
No personal income docs; deal must DSCR.
Hard money
10% down · 12.0% · 12mo
- Down + closing
- —
- Monthly P&I
- —
- Monthly cashflow
- —
- DSCR
- —
- Eligible?
- —
Short-term bridge; refi at stabilization.
Rent comps 40 comps
| Address | Beds | Baths | Sqft | Rent | $/sqft | DOM | Units | Dist |
|---|---|---|---|---|---|---|---|---|
| 353 W Webster St Ferndale, MI | 2.0 | 1.0 | 900 | $1,525 | $1.69 | 18d | 1 | 0.19mi |
| 226 Fielding St Ferndale, MI | 2.0 | 1.0 | 1000 | $1,500 | $1.50 | 26d | 1 | 0.27mi |
| 224 Fielding St Ferndale, MI | 2.0 | 1.0 | 1000 | $1,800 | $1.80 | 26d | 1 | 0.28mi |
| 20643 Stratford Rd Unit 1 Detroit, MI | 2.0 | 1.5 | 1000 | $1,250 | $1.25 | 45d | 1 | 0.35mi |
| 20129 Stratford Rd Unit 2 Detroit, MI | 2.0 | 1.0 | 1100 | $1,223 | $1.11 | 26d | 1 | 0.44mi |
| 901 Saint Louis St Ferndale, MI | 2.0 | 1.0 | 800 | $1,395 | $1.74 | 45d | 1 | 0.59mi |
| 901 Saint Louis St Unit 901-02 Ferndale, MI | 2.0 | 1.0 | 800 | $1,395 | $1.74 | 26d | 1 | 0.59mi |
| 900 Laprairie St Ferndale, MI | 1.0 | 1.0 | 700 | $1,015 | $1.45 | 45d | 1 | 0.61mi |
| 790 Jewell St Ferndale, MI | 2.0 | 1.0 | 800 | $1,445 | $1.81 | 26d | 1 | 0.67mi |
| 22111 Woodward Ave Ferndale, MI | 2.0 | 1.0 | 816 | $3,355 | $4.11 | 18d | 1 | 0.69mi |
| 690 E Marshall St Unit Lower Ferndale, MI | 1.0 | 1.0 | 700 | $1,295 | $1.85 | 12d | 1 | 0.70mi |
| 851 Gardendale St Ferndale, MI | 2.0 | 1.0 | 933 | $1,625 | $1.74 | 26d | 1 | 0.74mi |
| 1291 W State Fair Ave Detroit, MI | 1.0–2.0 | 1.0 | 700 | $950 | $1.36 | 14d | 2 | 0.74mi |
| 510 Stratford Rd Ferndale, MI | 2.0 | 1.0 | 965 | $1,750 | $1.81 | 45d | 1 | 0.74mi |
| 695 Livernois St Unit 2 Ferndale, MI | 2.0 | 1.0 | 950 | $2,350 | $2.47 | 6d | 1 | 0.78mi |
| 695 Livernois St Unit 1 Ferndale, MI | 2.0 | 2.0 | 1500 | $2,750 | $1.83 | 14d | 1 | 0.78mi |
| 695 Livernois St Unit 3 Ferndale, MI | 1.0 | 1.0 | 830 | $2,150 | $2.59 | 14d | 1 | 0.78mi |
| 20038 Santa Rosa Dr Detroit, MI | 3.0 | 1.0 | 927 | $1,300 | $1.40 | 19d | 1 | 0.79mi |
| 578 Kensington Ave Ferndale, MI | 2.0 | 1.0 | 860 | $1,600 | $1.86 | 7d | 1 | 0.82mi |
| 631 Shasta Pl Ferndale, MI | 3.0 | 2.0 | 1317 | $2,100 | $1.59 | 45d | 1 | 0.91mi |
| 552 E Saratoga St Unit Upper Unit Ferndale, MI | 2.0 | 1.0 | 700 | $1,300 | $1.86 | 26d | 1 | 0.92mi |
| 1561 E Webster St Ferndale, MI | 2.0 | 1.0 | 939 | $1,600 | $1.70 | 26d | 1 | 1.02mi |
| 413 W Nine Mile Rd Ste B Ferndale, MI | 1.0 | 1.0 | 897 | $1,850 | $2.06 | 20d | 1 | 1.10mi |
| 415 W Nine Mile Rd Ferndale, MI | 1.0 | 1.0 | 912 | $2,500 | $2.74 | 20d | 1 | 1.10mi |
| 430 W 9 Mile Rd Ferndale, MI | 1.0–2.0 | 2.0 | 826 | $2,827 | $3.42 | 0d | 2 | 1.13mi |
| 226 Withington St Apt 10 Ferndale, MI | 1.0 | 1.0 | 800 | $1,325 | $1.66 | 20d | 1 | 1.14mi |
| 501 E Breckenridge St Ferndale, MI | 3.0 | 1.0 | 946 | $1,800 | $1.90 | 26d | 1 | 1.17mi |
| 19031 Livernois Unit F Detroit, MI | 2.0 | 2.0 | 1100 | $2,135 | $1.94 | 45d | 1 | 1.19mi |
| 400 E Cambourne St Unit 1 Ferndale, MI | 2.0 | 1.0 | 1000 | $1,400 | $1.40 | 12d | 1 | 1.19mi |
| 20045 Greenlawn St Detroit, MI | 3.0 | 1.0 | 925 | $1,350 | $1.46 | 45d | 1 | 1.20mi |
| 453 E Cambourne St Unit 1 Ferndale, MI | 2.0 | 1.0 | 1000 | $2,500 | $2.50 | 5d | 1 | 1.22mi |
| 455 E Cambourne St Unit 2 Ferndale, MI | 2.0 | 1.0 | 900 | $2,400 | $2.67 | 5d | 1 | 1.22mi |
| 155 W George Ave Hazel Park, MI | 2.0 | 1.0 | 725 | $1,000 | $1.38 | 26d | 1 | 1.24mi |
| 20110 Northlawn St Detroit, MI | 3.0 | 1.0 | 1100 | $1,350 | $1.23 | 19d | 1 | 1.29mi |
| 1820 E Troy St Ferndale, MI | 3.0 | 1.0 | 1167 | $1,500 | $1.29 | 6d | 1 | 1.32mi |
| 2023 Ardmore Dr Ferndale, MI | 2.0 | 1.0 | 771 | $1,250 | $1.62 | 26d | 1 | 1.34mi |
| 1557 Leroy St Ferndale, MI | 3.0 | 2.0 | 1380 | $2,523 | $1.83 | 7d | 1 | 1.40mi |
| 90 W Meyers Ave Hazel Park, MI | 2.0 | 1.0 | 831 | $1,800 | $2.17 | 26d | 1 | 1.41mi |
| 150 E Woodland St Unit 2 Ferndale, MI | 1.0 | 1.0 | 700 | $1,500 | $2.14 | 45d | 1 | 1.41mi |
| 150 E Woodland St Unit 1 Ferndale, MI | 1.0 | 1.0 | 700 | $1,600 | $2.29 | 45d | 1 | 1.41mi |
Listing history 13 events
-
2026-06-21days on market $139,900 Active 17 DOM
-
2026-06-18days on market $139,900 Active 14 DOM
-
2026-06-17days on market $139,900 Active 13 DOM
-
2026-06-16days on market $139,900 Active 12 DOM
-
2026-06-15days on market $139,900 Active 11 DOM
-
2026-06-13days on market $139,900 Active 9 DOM
-
2026-06-13days on market $139,900 Active 8 DOM
-
2026-06-09days on market $139,900 Active 5 DOM
-
2026-06-08days on market $139,900 Active 4 DOM
-
2026-06-07statusdays on market $139,900 Active 3 DOM
-
2026-06-04days on market $139,900 Coming Soon 2 DOM
-
2026-06-02remarks 699-char remark
-
2026-06-02$139,900 Coming Soon 1 DOM
ⓘ Source: listings_history table (triggers on properties + properties_extension) + one-shot
backfill from property_details.listing_events for pre-trigger history.
Climate risk First Street
- Flood 1/10 Low FEMA zone X (unshaded) · 0% chance over 30 yrs
- Wildfire 2/10 Low
- Heat 3/10 Moderate 7 d/yr ≥97°F today · 15 d/yr by 30 yrs out
- Wind 2/10 Low
- Air quality 4/10 Moderate 4 unhealthy d/yr today · 6 by 30 yrs out
Nearby sold comps map
Loading sold comps map…
Walkable amenities ~0.75 mi
Loading nearby amenities…
Taxation est. · year 1
- Rental income
- $18,796
- − Mortgage interest
- −$7,837
- − Property taxes
- −$2,098
- − Insurance
- −$700
- − Repairs & maintenance
- −$1,504
- − Management
- −$1,504
- − Depreciation
- −$4,070
- Taxable income
- $1,084
- Est. tax owed @ 24.0%
- −$260
- After-tax cash flow
- $2,987/yr
For passive investors: Depreciation is non-cash, so a rental often shows a tax loss while cash-flowing — sheltering income. Rental losses are passive: they offset passive income freely, and up to $25,000/yr can offset ordinary (W-2) income if you actively participate and your MAGI is under $100k (phasing out to $0 by $150k); unused losses carry forward. On sale, claimed depreciation is recaptured at up to 25%, and gains may owe capital-gains tax (a 1031 exchange can defer both). Figures are a year-1 estimate at your 24.0% rate — not tax advice; consult a CPA.
Schools (NCES district)
- District
- Detroit Public Schools Community District
- NCES district ID
- 2601103
- Math proficiency
- 10% ▼ -2.00%
- Reading proficiency
- 24% ▲ 6.00%
- Median HH income
- $25,815
- Composite
- 13.06/100
- National rank
- #9564
- State rank
- #499 of 540 in MI
Livability — Detroit
- Score
- 73/100
- State rank
- #218
- US rank
- #5427
Category grades
Schools grade is shown separately in the Schools card above.
Census & demographics
- Census place
- Detroit, MI
- County
- Wayne County · 1,562,939 people
- City population
- 572,865
- Metro
- Detroit-Warren-Dearborn, MI
- Population (ZIP)
- 41,392
- Household income
- $57,878
- Rent vs Own
- Severe rent burden
- 1646.0
Population outlook (Wayne County) Hauer SSP2
- Today (2025)
- 1,675,273 people
- By 2030
- 1,620,300 · -3.3%
- By 2040
- 1,502,341 · -10.3%
- By 2050
- 1,384,039 · -17.4%
- By 2075
- 1,124,592 · -32.9%
- By 2100
- 881,193 · -47.4%
Race, ethnicity, and origin ACS 2023
- Neighborhood character
- Predominantly Black (85%)
- Race & ethnicity
- Black 85% White 8% Two or more races 4% Asian 1%
- Common ancestry
- Romanian 1% Lithuanian 1%
- Foreign-born
- 2% · Canada
- Languages at home
- 97% English-only · Spanish 1% Other Indo-European 1%
Political lean MEDSL · Wayne
- 2024 margin
- Strong D (+29.0) · D 62.7% · R 33.7% · Other 3.6%
- 2008→2024 swing
- -20.5pp toward R · 2008: 49.5pp · 2024: 29.0pp
- All cycles
- 2024: D+29.0 2020: D+38.1 2016: D+37.3 2012: D+46.9 2008: D+49.5
Not yet ingested
- Civics
- —
Market trends
- HPI YoY
- ▼ -433.14%
- Current HPI
- 280.5434
- Rent YoY
- ▲ 3.44%
- Metro
- Detroit-Warren-Dearborn, MI
- State GDP YoY
- ▲ 1.37%
- F500 in state
- 28
Industry mix (Fortune 500 HQ in MI)
| Industry | F500 HQs | Revenue |
|---|---|---|
| Automotive Parts | 3 | $48B |
|
||
| Automotive | 2 | $372B |
|
||
| Chemicals | 1 | $45B |
|
||
| Automotive Retail | 1 | $29B |
|
||
| Healthcare / Medical Devices | 1 | $23B |
|
||
| Automotive Technology | 1 | $20B |
|
||
Price history
+258.7% since first listed53 events — show timeline
- 2026-06-02 Coming Soon $139,900 MiRealSource-MiMLS
- 2025-05-28 Sold (Public Records) $115,000 Public Records
- 2025-05-15 Sold (MLS) $115,000 REALCOMP
- 2025-05-15 Sold (MLS) $115,000 MiRealSource-MiMLS
- 2025-05-07 Pending — MiRealSource-MiMLS
- 2025-05-07 Pending — REALCOMP
- 2025-04-10 Listed $125,000 REALCOMP
- 2025-04-10 Listed $125,000 MiRealSource-MiMLS
- 2025-02-05 Listing Removed — MiRealSource-MiMLS
- 2025-02-05 Listing Removed — REALCOMP
- 2024-10-21 Price Changed $125,000 MiRealSource-MiMLS
- 2024-10-21 Price Changed $125,000 REALCOMP
- 2024-07-04 Listed $139,900 REALCOMP
- 2024-07-04 Listed $139,900 MiRealSource-MiMLS
- 2022-05-31 Sold (Public Records) $125,500 Public Records
- 2022-05-20 Sold (MLS) $125,500 MiRealSource-MiMLS
- 2022-05-20 Sold (MLS) $125,500 REALCOMP
- 2022-04-26 Pending — MiRealSource-MiMLS
- 2022-04-26 Pending — REALCOMP
- 2022-04-09 Price Changed $123,000 MiRealSource-MiMLS
- 2022-04-08 Price Changed $123,000 REALCOMP
- 2022-04-08 Relisted — MiRealSource-MiMLS
- 2022-04-08 Relisted — REALCOMP
- 2022-02-18 Pending — MiRealSource-MiMLS
- 2022-02-18 Pending — REALCOMP
- 2022-02-10 Contingent — MiRealSource-MiMLS
- 2022-02-10 Contingent — REALCOMP
- 2022-01-31 Relisted — MiRealSource-MiMLS
- 2022-01-31 Relisted — REALCOMP
- 2022-01-24 Contingent — MiRealSource-MiMLS
- 2022-01-24 Contingent — REALCOMP
- 2022-01-11 Price Changed $119,850 MiRealSource-MiMLS
- 2022-01-10 Price Changed $119,850 REALCOMP
- 2021-12-15 Relisted — MiRealSource-MiMLS
- 2021-12-15 Relisted — REALCOMP
- 2021-12-08 Listing Removed — REALCOMP
- 2021-12-08 Listing Removed — MiRealSource-MiMLS
- 2021-12-07 Listed $129,850 MiRealSource-MiMLS
- 2021-12-07 Listed $129,850 REALCOMP
- 2021-12-02 Coming Soon $129,850 MiRealSource-MiMLS
- 2021-12-02 Coming Soon $129,850 REALCOMP
- 2017-09-22 Sold (MLS) $30,000 MiRealSource-MiMLS
- 2017-09-22 Sold (MLS) $30,000 REALCOMP
- 2017-09-18 Pending — MiRealSource-MiMLS
- 2017-09-18 Pending — REALCOMP
- 2017-09-12 Price Changed $30,000 MiRealSource-MiMLS
- 2017-09-12 Price Changed $30,000 REALCOMP
- 2017-09-02 Price Changed $34,500 MiRealSource-MiMLS
- 2017-09-01 Price Changed $34,500 REALCOMP
- 2017-08-30 Price Changed $37,000 MiRealSource-MiMLS
- 2017-08-30 Price Changed $37,000 REALCOMP
- 2017-08-18 Listed $39,000 MiRealSource-MiMLS
- 2017-08-18 Listed $39,000 REALCOMP
Property tax history
+12.7%/yrLatest (2025): $7,201 · +33.7% YoY. Source: county tax records.
Cash-flow waterfall
monthlySold comps — $/sqft
last 12 mo · ≤1 miLoading sold comps…