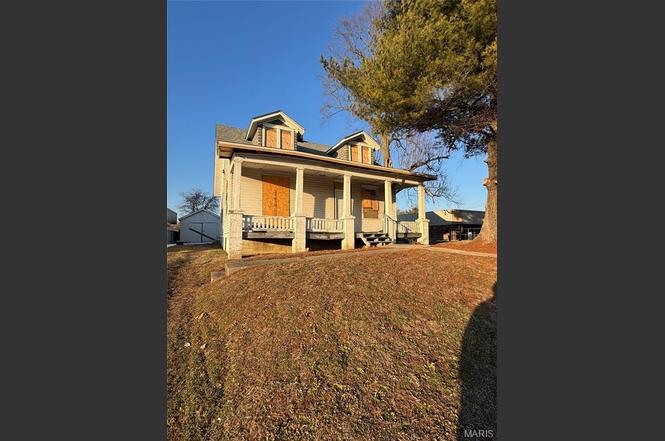
4521 N Belt West · Belleville, IL
Flood risk 1/10 · Minimal
- FEMA flood zone
- X
- Chance of flooding over 30 yrs
- 0.0%
- Est. flood insurance / yr
- $473 – $860
Fire risk 1/10 · Minimal
- Est. fire insurance / yr
- $804 – $1,492
Heat risk 5/10 · Moderate
- Hot days now (above 107°F)
- 7 days/yr
- Hot days in 30 yrs
- 22 days/yr
Wind risk 2/10 · Minimal
- Chance of severe wind over 30 yrs
- 1.0%
Air-quality risk 4/10 · Minor
- Unhealthy air days now
- 3 days/yr
- Unhealthy air days in 30 yrs
- 6 days/yr
Risk factors via First Street. Map © Google.
Why this score? — see what drove the B grade
The composite is a weighted blend of 9 inputs, each scored 0–100. Each bar is that input's sub-score; the figure is the points it added to the 100-point composite (weight × sub-score).
- Cash flow +28.4/30.0
- ARV discount +13.3/15.0
- 1% rule +10.0/10.0
- DSCR +10.0/10.0
- Livability +3.9/5.0
- Rent growth +3.6/5.0
- Condition / age +2.5/5.0
- Schools +2.2/10.0
- Appreciation +0.0/10.0
$65,000
🖨 Deal sheet 📄 Offer letter ✓ Due diligence
Listing remarks MLS
**Selling As-Is** Home is not cleaned out. Needs a lot of work to become livable. Great investment opportunity! **Broker Owned**
Key facts
- 0.32 acre lot
- Garage
- Built 1923
Property features AI
Exterior
- Parking: 1-car garage
- Utilities: Shared well water; Public sewer; Electric service listed as other
- Home design: Single-family residence; One and one-half levels; House structure; Property listed in fixer condition
- Construction: Frame construction
- Exterior features: Back yard
Interior
- Bedrooms: 2 bedrooms on the main level
- Bathrooms: 1 full bathroom (main level)
- Heating & cooling: Forced air heating; No cooling
- Interior features: Unfinished walk-up basement; Wood-burning fireplace in the living room; Forced air heating; No central cooling
Neighborhood map
What this means for you Summary
Snapshot
- This is a 2-bed/2.0-bath single-family listed at $65k.
Deal economics
- At list price, monthly cash flow is $211 ($3k/yr) — positive.
- The deal already cash-flows at list — no discount required.
- Meets the 1% rule at list price ($1k rent vs $65k).
- Recommended offer: $57k (12.0% below list) — sets the bar for market timing.
- Cap rate 10.2% vs local median 5.6% in Belleville — top-decile yield for the area; either an underpriced asset or a hidden risk that comps aren't pricing in. Stress-test before assuming the spread holds.
Location & tenants
- Location reads 78/100 on livability (#142 in IL, #2,604 nationally) — a middle-class / working-renter tenant base. Strengths: commute A+, cost of living A+, housing A+; Watch: crime F, amenities D-.
- Belleville Twp Hsd 201 (suburban): math 21% / reading 28% proficiency, ranked #308 of 620 in IL (top 50%) — low school quality limits family demand, transient renter base, plan for 1-2y turnover.
- Zoned schools: Belleville High School-West (math 19% / reading 26%, grade F, #317 of 693 statewide, top 46%, 2,234 students, 0% FRL).
- Market conditions: Rents rising fast (+4.6%/yr); 190 active listings in the ZIP; 19 comparable units currently listed for rent nearby; rentals at typical pace (median 24d on market — plan ~3-4 weeks tenant-placement turnaround); 783 units permitted in St. Clair County in 2024 (378 in 5+ unit buildings).
- This rent is only 18% of the median local income ($71k/yr) — well below the 30% rent-burden line; pricing power to push rent on renewal without tenant pushback.
Forward outlook
- Local home prices are declining (-3.0%/yr); year-one equity from $449 of loan paydown is wiped out by about $2k of value loss. Plan a longer hold.
- St. Clair County population projected at -23% by 2050 — secular population decline; favor cash flow + early exit over multi-decade hold.
- At projected returns (-3.0% appreciation + 4.6% rent growth), your $18k cash investment doubles in ~8 years — after that, you're playing with house money.
Negotiation context
- It's been on market 129 days — a 12% lower offer ($57k) is reasonable based on typical stale-listing flexibility.
- 3 sale attempts since 2y ago with the ask held roughly flat each time — persistent listings suggest the price (not the market) is what's stuck; bring a comps-based counter.
Risks & watch-outs
- Watch-outs: property tax is 4.5% of price; built in 1923 — expect roof / HVAC / electrical / plumbing capex.
- Climate carrying-cost: extreme-heat days projected 7→22/yr by 2055 (HVAC capex compounding) — expect insurance premiums to compound above CPI over the hold.
Questions for the listing agent
- It's been on market 129 days. Have you received any prior offers? Is the seller open to a 12% concession, seller financing, or rate buy-down credit?
- Built in 1923 — when were the roof, HVAC, electrical panel, plumbing, and water heater last replaced?
- Property tax is high relative to price — has the assessment been appealed recently, and will the sale trigger a re-assessment?
- Why hasn't it sold? Are there any deal-killer items the seller is aware of (foundation, flood, title, zoning, code violations)?
- Is there a deadline driving the sale (1031 exchange, divorce, estate, relocation)? That informs how much negotiation room exists.
- Crime grade is F in this area — have there been break-ins, vandalism, or insurance claims at this property in the last 3 years? What carrier currently insures it and at what premium?
- What's the average days-on-market for RENTAL listings here right now (not sales)? A rising rental-DOM trend means longer vacancies and softer asking-rent achievability than the comps imply.
- What's the recent tenant-quality profile in this submarket — average credit score on applications, eviction rate, late-payment / NSF rate, and stable-employment percentage? A property-management company in the area should have these aggregated.
- How much new for-sale + rental construction is in the pipeline within 1–3 miles? Heavy new supply typically softens prices + rents 12–24 months out; constrained supply supports both.
Investment metrics
- 1% rule
- 1.61% ✓
- Cap rate
- 10.19%
- Cash-on-cash
- 13.90%
- DSCR
- 1.62
- GRM
- 5.2
CMA / ARV
- ARV (on-the-fly)
- $74,700
- Comps found
- 12
Show comp detail 12 sales within ~0.75 mi
| Address | Dist | Beds/Ba | Sqft | Sold | Price | $/sf | Match |
|---|---|---|---|---|---|---|---|
| 120 N 46th St | 0.03mi | 2/1.0 | 1,028 (+14%) | 0mo | $40,000 | $39 | 70 |
| 3916 Shirley Dr | 0.47mi | 3/1.0 (+1) | 939 (+4%) | 1mo | $125,000 | $133 | 61 |
| 439 N 39th St | 0.49mi | 3/1.0 (+1) | 864 (-4%) | 1mo | $120,000 | $139 | 61 |
| 14 N 41st St | 0.35mi | 2/1.0 | 986 (+10%) | 4mo | $133,000 | $135 | 61 |
| 3805 Little Flower Ln | 0.52mi | 3/1.0 (+1) | 864 (-4%) | 0mo | $134,900 | $156 | 60 |
| 108 S 37th St | 0.59mi | 2/1.0 | 840 (-7%) | 1mo | $45,000 | $54 | 57 |
| 624 Royal Heights Rd | 0.61mi | 2/1.0 | 960 (+7%) | 3mo | $30,000 | $31 | 54 |
| 128 Freedom Dr | 0.53mi | 3/1.0 (+1) | 968 (+8%) | 0mo | $75,000 | $77 | 53 |
| 652 N 39th St | 0.50mi | 2/1.0 | 984 (+9%) | 4mo | $64,000 | $65 | 53 |
| 435 N 38th St | 0.55mi | 2/1.0 | 997 (+11%) | 1mo | $50,000 | $50 | 51 |
| 640 Devonshire Dr | 0.67mi | 3/1.0 (+1) | 960 (+7%) | 0mo | $80,000 | $83 | 48 |
| 3700 Michelle Dr | 0.54mi | 2/1.0 | 1,034 (+15%) | 0mo | $139,900 | $135 | 46 |
Match score weights: distance 35% · size 25% · config 20% · recency 20%. Top-matched comps best support the ARV.
Projected returns pro-forma
-3.0% appreciation · 4.56% rent growth · sell at horizon
- IRR
- 6.4%
- Equity multiple
- 1.26×
- Total profit
- $4,678
- Equity at exit
- $9,692
- IRR
- 17.5%
- Equity multiple
- 2.59×
- Total profit
- $28,889
- Equity at exit
- $5,620
Cash invested: $18,200 (down + closing). Projections, not guarantees.
Landlord ↔ Tenant lean methodology
- Overall (STATE)
- 43 Moderately Tenant-Leaning
- State Illinois
- 43 Moderately Tenant-Leaning · D+7
- County
- — inherits STATE
- City
- — inherits STATE
ZIP-level market 62226
- Rents YoY
- 4.6%
- Active inventory
- 190
- Price-to-rent
- 5.2×
Monthly cashflow live
- Estimated rent
- $1,044 high interval (Pro) →
- Mortgage (P&I)
- −$341
- Tax from tax record
- −$246 /mo · $2,949/yr
- Insurance
- −$27
- HOA
- −$0
- Vacancy / Maint / Mgmt
- −$219
- Net cashflow
- $211
Break-even live
UW: 25.0% down · 7.5% · 30yr · 1.5% tax · 5.0% vac · 8.0% maint · 8.0% mgmt
Financing live
Cash to close
- Down payment
- $16,250
- Closing costs
- $1,950
- Reserves months
- —
- Total cash needed
- —
Loan-product check · same deal, 3 products live
Conventional
25% down · 7.5% · 30yr
- Down + closing
- —
- Monthly P&I
- —
- Monthly cashflow
- —
- DSCR
- —
- Eligible?
- —
Personal DTI + credit; lowest rate.
DSCR
20% down · 8.5% · 30yr
- Down + closing
- —
- Monthly P&I
- —
- Monthly cashflow
- —
- DSCR
- —
- Eligible?
- —
No personal income docs; deal must DSCR.
Hard money
10% down · 12.0% · 12mo
- Down + closing
- —
- Monthly P&I
- —
- Monthly cashflow
- —
- DSCR
- —
- Eligible?
- —
Short-term bridge; refi at stabilization.
Rent comps 19 comps
| Address | Beds | Baths | Sqft | Rent | $/sqft | DOM | Units | Dist |
|---|---|---|---|---|---|---|---|---|
| 4516 W Main St Belleville, IL | 2.0 | 1.0 | 607 | $850 | $1.40 | 23d | 1 | 0.15mi |
| 56 Friendly Dr Belleville, IL | 2.0 | 1.0 | 1000 | $1,550 | $1.55 | 23d | 1 | 0.26mi |
| 18 S 44th St Belleville, IL | 1.0 | 1.0 | 550 | $700 | $1.27 | 3d | 1 | 0.28mi |
| 18 S 44th St Belleville, IL | 1.0 | 1.0 | 550 | $700 | $1.27 | 14d | 1 | 0.28mi |
| 219 Freedom Dr Unit 232-B Belleville, IL | 2.0 | 1.0 | 936 | $895 | $0.96 | 23d | 1 | 0.47mi |
| 219 Freedom Dr Unit 228-P Belleville, IL | 2.0 | 1.0 | 936 | $970 | $1.04 | 23d | 1 | 0.47mi |
| 219 Freedom Dr Unit 236-M Belleville, IL | 1.0 | 1.0 | 612 | $730 | $1.19 | 2d | 1 | 0.47mi |
| 219 Freedom Dr Unit G-10 Belleville, IL | 1.0 | 1.0 | 612 | $795 | $1.30 | 23d | 1 | 0.47mi |
| 219 Freedom Dr Unit C-05 Belleville, IL | 1.0 | 1.0 | 612 | $795 | $1.30 | 2d | 1 | 0.47mi |
| 219 Freedom Dr Unit 219-U Belleville, IL | 1.0 | 1.0 | 612 | $730 | $1.19 | 23d | 1 | 0.47mi |
| 219 Freedom Dr Unit 228-G Belleville, IL | 2.0 | 1.0 | 936 | $895 | $0.96 | 4d | 1 | 0.47mi |
| 219 Freedom Dr Unit 232-Q Belleville, IL | 2.0 | 1.0 | 936 | $895 | $0.96 | 17d | 1 | 0.47mi |
| 654 N 39th St Belleville, IL | 3.0 | 1.0 | 984 | $1,400 | $1.42 | 17d | 1 | 0.50mi |
| 213 Columbus Dr Belleville, IL | 3.0 | 1.0 | 1040 | $1,650 | $1.59 | 23d | 1 | 0.69mi |
| 1000 Royal Heights Rd Belleville, IL | 2.0 | 1.5 | 1100 | $1,345 | $1.22 | 23d | 1 | 0.79mi |
| 54 Ben Louis Dr Belleville, IL | 2.0 | 1.0 | 900 | $1,145 | $1.27 | 23d | 1 | 1.01mi |
| 5784 Brett Michael Ln Belleville, IL | 1.0–2.0 | 1.0–2.0 | 801 | $1,195 | $1.49 | 7d | 7 | 1.02mi |
| 6105 W Washington St Belleville, IL | 3.0 | 1.5 | 1120 | $1,575 | $1.41 | 23d | 1 | 1.06mi |
| 31 S 27th St Belleville, IL | 2.0 | 1.0 | 1000 | $915 | $0.92 | 23d | 1 | 1.21mi |
Listing history 19 events
-
2026-06-18days on market $65,000 Active 129 DOM
-
2026-06-17days on market $65,000 Active 128 DOM
-
2026-06-16days on market $65,000 Active 127 DOM
-
2026-06-15days on market $65,000 Active 126 DOM
-
2026-06-13days on market $65,000 Active 124 DOM
-
2026-06-09days on market $65,000 Active 120 DOM
-
2026-06-08days on market $65,000 Active 119 DOM
-
2026-06-07days on market $65,000 Active 118 DOM
-
2026-06-03days on market $65,000 Active 114 DOM
-
2026-06-02days on market $65,000 Active 113 DOM
-
2026-06-01days on market $65,000 Active 112 DOM
-
2026-05-31days on market $65,000 Active 111 DOM
-
2026-02-09$65,000 Active
-
2026-02-07historical $65,000
-
2025-05-23soldstatus Closed 135-char remark
Show marketing remark (135 chars)
**Selling As-Is** Home is not cleaned out. Needs a lot of work to become livable. Great investment opportunity! **Broker Owned**
-
2025-04-14status Pending 135-char remark
Show marketing remark (135 chars)
**Selling As-Is** Home is not cleaned out. Needs a lot of work to become livable. Great investment opportunity! **Broker Owned**
-
2025-02-14status Active 135-char remark
Show marketing remark (135 chars)
**Selling As-Is** Home is not cleaned out. Needs a lot of work to become livable. Great investment opportunity! **Broker Owned**
-
2024-12-26status Pending 135-char remark
Show marketing remark (135 chars)
**Selling As-Is** Home is not cleaned out. Needs a lot of work to become livable. Great investment opportunity! **Broker Owned**
-
2024-12-17$28,900 Active 135-char remark
Show marketing remark (135 chars)
**Selling As-Is** Home is not cleaned out. Needs a lot of work to become livable. Great investment opportunity! **Broker Owned**
ⓘ Source: listings_history table (triggers on properties + properties_extension) + one-shot
backfill from property_details.listing_events for pre-trigger history.
Tax reassessment forecast IL · Partial reset (capped growth)
- Current annual tax
- $2,949 · $246/mo
- Projected year-2 tax
- $2,949 · $246/mo
- Expected delta
- $0/yr ($0/mo · 0.0%)
ⓘ Screening estimate from a state-policy table — verify with the county assessor before closing.
Climate risk First Street
- Flood 1/10 Low FEMA zone X · 0% chance over 30 yrs
- Wildfire 1/10 Low
- Heat 5/10 Major 7 d/yr ≥107°F today · 22 d/yr by 30 yrs out
- Wind 2/10 Low 100% chance of damaging wind over 30 yrs
- Air quality 4/10 Moderate 3 unhealthy d/yr today · 6 by 30 yrs out
Nearby sold comps map
Loading sold comps map…
Walkable amenities ~0.75 mi
Loading nearby amenities…
Taxation est. · year 1
- Rental income
- $12,525
- − Mortgage interest
- −$3,641
- − Property taxes
- −$2,949
- − Insurance
- −$325
- − Repairs & maintenance
- −$1,002
- − Management
- −$1,002
- − Depreciation
- −$1,891
- Taxable income
- $1,715
- Est. tax owed @ 24.0%
- −$412
- After-tax cash flow
- $2,119/yr
For passive investors: Depreciation is non-cash, so a rental often shows a tax loss while cash-flowing — sheltering income. Rental losses are passive: they offset passive income freely, and up to $25,000/yr can offset ordinary (W-2) income if you actively participate and your MAGI is under $100k (phasing out to $0 by $150k); unused losses carry forward. On sale, claimed depreciation is recaptured at up to 25%, and gains may owe capital-gains tax (a 1031 exchange can defer both). Figures are a year-1 estimate at your 24.0% rate — not tax advice; consult a CPA.
Schools (NCES district)
- District
- Belleville Twp Hsd 201
- NCES district ID
- 1705640
- Math proficiency
- 21% ▼ -8.00%
- Reading proficiency
- 28% ▼ -3.00%
- Median HH income
- $58,064
- Composite
- 22.39/100
- National rank
- #8115
- State rank
- #308 of 620 in IL
Livability — Belleville
- Score
- 78/100
- State rank
- #142
- US rank
- #2604
Category grades
Schools grade is shown separately in the Schools card above.
Census & demographics
- Census place
- Belleville, IL
- County
- Saint Clair County · 169,691 people
- City population
- 47,407
- Metro
- St. Louis, MO-IL
- Population (ZIP)
- 28,255
- Household income
- $70,797
- Rent vs Own
- Severe rent burden
- 824.0
Population outlook (St. Clair County) Hauer SSP2
- Today (2025)
- 250,366 people
- By 2030
- 240,511 · -3.9%
- By 2040
- 217,391 · -13.2%
- By 2050
- 192,699 · -23.0%
- By 2075
- 140,637 · -43.8%
- By 2100
- 100,499 · -59.9%
Race, ethnicity, and origin ACS 2023
- Neighborhood character
- Majority White (64%)
- Race & ethnicity
- White 64% Black 24% Two or more races 7% Hispanic / Latino 3% Asian 2%
- Common ancestry
- Romanian 4% Lithuanian 2% Slovak 2%
- Foreign-born
- 4% · Canada, China
- Languages at home
- 96% English-only · Chinese 1% Spanish 1%
Political lean MEDSL · St. Clair
- 2024 margin
- Lean D (+7.9) · D 53.0% · R 45.1% · Other 1.8%
- 2008→2024 swing
- -14.6pp toward R · 2008: 22.4pp · 2024: 7.9pp
- All cycles
- 2024: D+7.9 2020: D+8.7 2016: D+5.6 2012: D+14.5 2008: D+22.4
Not yet ingested
- Civics
- —
Market trends
- HPI YoY
- ▼ -83.57%
- Current HPI
- 133.9028
- Rent YoY
- ▲ 4.56%
- Metro
- St. Louis, MO-IL
- State GDP YoY
- ▲ 1.59%
- F500 in state
- 60
Industry mix (Fortune 500 HQ in IL)
| Industry | F500 HQs | Revenue |
|---|---|---|
| Insurance | 4 | $201B |
|
||
| Consumer Goods | 4 | $87B |
|
||
| Industrial Machinery | 3 | $64B |
|
||
| Healthcare | 2 | $55B |
|
||
| Retail / Pharmacy | 1 | $148B |
|
||
| Agriculture / Food | 1 | $86B |
|
||
Price history
+124.9% since first listed7 events — show timeline
- 2026-02-09 Listed $65,000 MARIS as Distributed by MLS Grid
- 2026-02-07 Coming Soon $65,000 MARIS as Distributed by MLS Grid
- 2025-05-23 Sold (MLS) — MARIS as Distributed by MLS Grid
- 2025-04-14 Pending — MARIS as Distributed by MLS Grid
- 2025-02-14 Relisted — MARIS as Distributed by MLS Grid
- 2024-12-26 Pending — MARIS as Distributed by MLS Grid
- 2024-12-17 Listed $28,900 MARIS as Distributed by MLS Grid
Property tax history
+15.4%/yrLatest (2024): $2,949 · +2.7% YoY. Source: county tax records.
Cash-flow waterfall
monthlySold comps — $/sqft
last 12 mo · ≤1 miLoading sold comps…