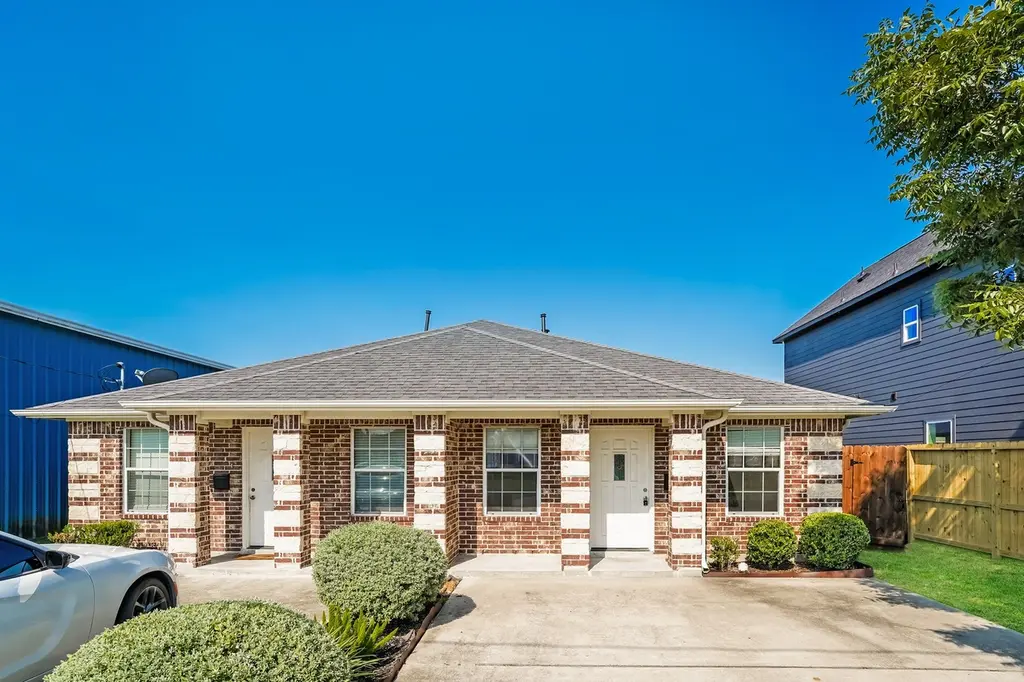
 Duplex
8424 Cannon St · Houston, TX
Flood risk 6/10 · Moderate
- FEMA flood zone
- X (unshaded)
- Chance of flooding over 30 yrs
- 0.67%
- Est. flood insurance / yr
- $507 – $1,088
Fire risk 3/10 · Minor
- Est. fire insurance / yr
- $1,222 – $2,270
Heat risk 9/10 · Severe
- Hot days now (above 109°F)
- 7 days/yr
- Hot days in 30 yrs
- 23 days/yr
Wind risk 9/10 · Severe
- Chance of severe wind over 30 yrs
- 99.0%
Air-quality risk 2/10 · Minimal
- Unhealthy air days now
- 2 days/yr
- Unhealthy air days in 30 yrs
- 2 days/yr
Risk factors via First Street. Map © Google.
Why this score? — see what drove the C- grade
The composite is a weighted blend of 9 inputs, each scored 0–100. Each bar is that input's sub-score; the figure is the points it added to the 100-point composite (weight × sub-score).
- ARV discount +13.3/15.0
- Cash flow +10.1/30.0
- Appreciation +10.0/10.0
- Rent growth +3.7/5.0
- Livability +3.7/5.0
- 1% rule +3.5/10.0
- DSCR +2.9/10.0
- Schools +2.7/10.0
- Condition / age +2.5/5.0
$314,900
🖨 Deal sheet 📄 Offer letter ✓ Due diligence
Multi-family units
County records classify this as Multi-Family (2-4 Unit). Listing-text estimate: 2 units. confirmed
Listing remarks MLS
Investors welcome. This low-maintenance duplex, just 15 minutes from downtown, is 9 years new and already generating income. Both units are occupied at $1,200 per month, providing immediate cash flow, Both units feature two comfortable bedrooms with ceiling fans, a well-appointed bathroom with ample cabinet storage, and convenient washer and dryer connections. With modern systems, practical finishes, and a prime location close to city amenities, this property is an ideal addition to any portfolio or a smart first investment.
Key facts
- Immediate cash flow
- Practical finishes
- Modern systems
Tags
Neighborhood map
What this means for you Summary
Snapshot
- This is a 2 × 2-bed/1.0-bath units multifamily listed at $315k.
Deal economics
- At list price, monthly cash flow is $-187 ($-2k/yr) — negative. Per door: $-93/mo.
- To cash-flow at today's rent, offer at most $282k (10.5% below list).
- To meet the 1% rule (rent ≥ 1% of price), the offer needs to be $269k (14.5% below list).
- Recommended offer: $269k (14.5% below list) — sets the bar for 1% rule.
- Cap rate 5.6% vs local median 3.2% in Houston — top-decile yield for the area; either an underpriced asset or a hidden risk that comps aren't pricing in. Stress-test before assuming the spread holds.
Location & tenants
- Location reads 74/100 on livability (#184 in TX, #4,771 nationally) — a middle-class / working-renter tenant base. Strengths: amenities A+, cost of living A+, housing A+; Watch: schools D, crime F.
- Houston ISD (urban): math 27% / reading 35% proficiency, ranked #593 of 826 in TX (top 72%) — families likely to look elsewhere, expect single-tenant / working-renter base with shorter leases; 71% free/reduced lunch — lower-income household profile, screen leases tightly.
- Market conditions: Rents rising fast (+4.8%/yr); 312 active listings in the ZIP; 32 comparable units currently listed for rent nearby; rentals at typical pace (median 25d on market — plan ~3-4 weeks tenant-placement turnaround); 44% of comp listings sitting > 30 days — soft ceiling on asking rent; lower-income renter base — watch delinquency; 29,883 units permitted in Harris County in 2024 (8,621 in 5+ unit buildings).
- At $2,691/mo this rent would consume 86% of the median local household income ($37k/yr) (locally 1446% of renters already pay >50% of income on rent) — very limited rent-growth headroom before tenants either downsize or default.
Forward outlook
- In year one you build about $34k of equity ($2k loan paydown + $31k appreciation (10.0% local appreciation)).
- Harris County population projected at +47% by 2050 — long-run rental-demand tailwind backs the buy-and-hold thesis.
- By year 2, paydown + projected appreciation supports a ~$54k cash-out refi (75% LTV) — recoverable capital for the next deal without selling this one.
Negotiation context
- Only 10 days on market — expect competitive offers; lowballing is unlikely to land.
- 5 sale attempts since 4y ago; this cycle's ask has dropped $45k (13%) from the opening price — seller is motivated, your offer sets the floor, not the list.
Risks & watch-outs
- Climate carrying-cost: major flood risk; severe wind risk, 99% chance of damaging wind over 30y; extreme-heat days projected 7→23/yr by 2055 (HVAC capex compounding) — expect insurance premiums to compound above CPI over the hold.
Questions for the listing agent
- What do current leases actually rent for vs. the listed asking? Can we see a recent rent roll and the last 12 months of T-12 income?
- Can we see the unit-by-unit rent roll, current vacancy, and any below-market leases? What's the average tenancy length?
- What capital expenditures (roof, boiler, parking lot, exteriors) have been made in the last 5 years, and what's planned in the next 2?
- Is there a deadline driving the sale (1031 exchange, divorce, estate, relocation)? That informs how much negotiation room exists.
- Schools are D-rated, which usually means shorter tenancies and higher turnover. Who's the typical renter profile here, and what's been the actual vacancy rate?
- Crime grade is F in this area — have there been break-ins, vandalism, or insurance claims at this property in the last 3 years? What carrier currently insures it and at what premium?
- What's the average days-on-market for RENTAL listings here right now (not sales)? A rising rental-DOM trend means longer vacancies and softer asking-rent achievability than the comps imply.
- What's the recent tenant-quality profile in this submarket — average credit score on applications, eviction rate, late-payment / NSF rate, and stable-employment percentage? A property-management company in the area should have these aggregated.
- How much new apartment / multifamily construction is in the pipeline within 1–3 miles? Heavy new supply (>2% of stock underway) typically softens rents 12–24 months out; light construction supports rent growth.
Investment metrics
- 1% rule
- 0.85% ✗
- Cap rate
- 5.58%
- Cash-on-cash
- -2.54%
- DSCR
- 0.89
- GRM
- 9.8
CMA / ARV
- ARV (median comp)
- $361,810
- List price
- $314,900
- Delta
- -10.20%
- Verdict
- UNDERPRICED
- Comps
- 13 within 1.0 mi
Show comp detail 1 sale within ~0.75 mi
| Address | Dist | Beds/Ba | Sqft | Sold | Price | $/sf | Match |
|---|---|---|---|---|---|---|---|
| 8150 Bassett St | 0.36mi | 3/2.0 (-1) | 1,958 (+9%) | 1mo | $305,000 | $156 | 63 |
Match score weights: distance 35% · size 25% · config 20% · recency 20%. Top-matched comps best support the ARV.
Projected returns pro-forma
10.0% appreciation · 4.77% rent growth · sell at horizon
- IRR
- 23.1%
- Equity multiple
- 2.87×
- Total profit
- $164,605
- Equity at exit
- $283,687
- IRR
- 21.0%
- Equity multiple
- 6.73×
- Total profit
- $504,974
- Equity at exit
- $611,781
Cash invested: $88,172 (down + closing). Projections, not guarantees.
Landlord ↔ Tenant lean methodology
- Overall (STATE)
- 87 Strongly Landlord-Friendly
- State Texas
- 87 Strongly Landlord-Friendly · R+5
- County
- — inherits STATE
- City
- — inherits STATE
ZIP-level market 77051
- Home prices YoY
- 9.7%
- Rents YoY
- 4.8%
- Active inventory
- 312
- Price-to-rent
- 19.5×
Monthly cashflow live
- Estimated rent
- $2,691 high interval (Pro) →
- Mortgage (P&I)
- −$1,651
- Tax from tax record
- −$530 /mo · $6,362/yr
- Insurance
- −$131
- HOA
- −$0
- Vacancy / Maint / Mgmt
- −$565
- Net cashflow
- $-187
Break-even live
2-unit breakdown (identical units grouped — click to expand)
| Units | Beds | Baths | Est. rent |
|---|---|---|---|
| 2× units | 2 | 1 | $2,692 |
| #1 | 2 | 1 | $1,346 |
| #2 | 2 | 1 | $1,346 |
| Total (2 units) | $2,691 | ||
UW: 25.0% down · 7.5% · 30yr · 1.5% tax · 5.0% vac · 8.0% maint · 8.0% mgmt
Financing live
Cash to close
- Down payment
- $78,725
- Closing costs
- $9,447
- Reserves months
- —
- Total cash needed
- —
Loan-product check · same deal, 3 products live
Conventional
25% down · 7.5% · 30yr
- Down + closing
- —
- Monthly P&I
- —
- Monthly cashflow
- —
- DSCR
- —
- Eligible?
- —
Personal DTI + credit; lowest rate.
DSCR
20% down · 8.5% · 30yr
- Down + closing
- —
- Monthly P&I
- —
- Monthly cashflow
- —
- DSCR
- —
- Eligible?
- —
No personal income docs; deal must DSCR.
Hard money
10% down · 12.0% · 12mo
- Down + closing
- —
- Monthly P&I
- —
- Monthly cashflow
- —
- DSCR
- —
- Eligible?
- —
Short-term bridge; refi at stabilization.
Rent comps 32 comps
| Address | Beds | Baths | Sqft | Rent | $/sqft | DOM | Units | Dist |
|---|---|---|---|---|---|---|---|---|
| 8328 Corinth St Unit B Houston, TX | 3.0 | 2.5 | 1500 | $2,800 | $1.87 | 20d | 1 | 0.35mi |
| 3620 Du Bois St Unit 1302349P Houston, TX | 3.0 | 2.5 | 1797 | $2,945 | $1.64 | 3d | 1 | 0.42mi |
| 8010 Livingston St Houston, TX | 3.0 | 2.0 | 1400 | $1,800 | $1.29 | 43d | 1 | 0.46mi |
| 4117 Shelby Cir Unit 1230900P Houston, TX | 4.0 | 2.0 | 1367 | $5,355 | $3.92 | 2d | 1 | 0.65mi |
| 7806 Comal St Unit B Houston, TX | 3.0 | 2.5 | 1800 | $2,200 | $1.22 | 43d | 1 | 0.66mi |
| 4406 Sterling St Houston, TX | 3.0 | 2.5 | 1840 | $1,999 | $1.09 | 17d | 1 | 0.92mi |
| 8181 El Mundo St Houston, TX | 1.0–3.0 | 1.0–2.5 | 1356 | $2,262 | $1.67 | 2d | 47 | 0.97mi |
| 8181 El Mundo St Houston, TX | 1.0–3.0 | 1.0–2.0 | 1241 | $2,041 | $1.64 | 24d | 18 | 0.97mi |
| 4514 Galesburg St Unit B Houston, TX | 3.0 | 2.5 | 1680 | $3,500 | $2.08 | 24d | 1 | 1.09mi |
| 7507 Springhill St Houston, TX | 3.0 | 3.5 | 2000 | $4,500 | $2.25 | 43d | 1 | 1.13mi |
| 9610 Buffum St Houston, TX | 3.0 | 3.0 | 1605 | $1,799 | $1.12 | 43d | 1 | 1.13mi |
| 4526 Knoxville St Unit A Houston, TX | 3.0 | 2.5 | 1474 | $1,775 | $1.20 | 15d | 1 | 1.14mi |
| 3710 Rockingham St Houston, TX | 3.0 | 2.0 | 1890 | $1,700 | $0.90 | 43d | 1 | 1.16mi |
| 2700 Holly Hall St Unit 2733 Houston, TX | 3.0 | 2.0 | 1943 | $2,006 | $1.03 | 3d | 1 | 1.17mi |
| 3732 Seabrook St Houston, TX | 3.0 | 2.5 | 1727 | $2,350 | $1.36 | 24d | 1 | 1.17mi |
| 4601 White Rock St Unit A Houston, TX | 3.0 | 2.5 | 1700 | $2,500 | $1.47 | 43d | 1 | 1.19mi |
| 3846 Seabrook St Houston, TX | 3.0 | 3.5 | 1833 | $2,300 | $1.25 | 43d | 1 | 1.20mi |
| 4609 Bricker St Unit B Houston, TX | 3.0 | 2.5 | 1300 | $3,500 | $2.69 | 12d | 1 | 1.24mi |
| 4609 Bricker St Unit ABC Houston, TX | 3.0 | 2.5 | 1375 | $3,500 | $2.55 | 11d | 1 | 1.24mi |
| 4613 Bricker St Unit B Houston, TX | 3.0 | 2.5 | 1600 | $2,300 | $1.44 | 43d | 1 | 1.26mi |
| 4530 Mayflower St Houston, TX | 3.0 | 2.0 | 1302 | $1,800 | $1.38 | 43d | 1 | 1.27mi |
| 4538 Clover St Houston, TX | 4.0 | 2.0 | 1768 | $1,595 | $0.90 | 43d | 1 | 1.28mi |
| 9606 Ashville Dr Unit B Houston, TX | 3.0 | 2.0 | 1610 | $1,570 | $0.98 | 43d | 1 | 1.28mi |
| 7321 Conley St Unit B Houston, TX | 3.0 | 2.0 | 1501 | $2,025 | $1.35 | 20d | 1 | 1.31mi |
| 7321 Conley St Unit A Houston, TX | 3.0 | 2.5 | 1869 | $2,025 | $1.08 | 20d | 1 | 1.31mi |
| 3402 Nathaniel Brown St Unit B Houston, TX | 3.0 | 2.5 | 1885 | $2,025 | $1.07 | 43d | 1 | 1.32mi |
| 8107 Calhoun Rd Houston, TX | 3.0 | 2.5 | 1304 | $2,250 | $1.73 | 24d | 1 | 1.34mi |
| 7379 Ardmore St Unit 1303 Houston, TX | 3.0 | 2.0 | 1442 | $1,967 | $1.36 | 43d | 1 | 1.36mi |
| 7379 Ardmore St Unit 1303 Houston, TX | 3.0 | 2.0 | 1442 | $1,967 | $1.36 | 22d | 1 | 1.36mi |
| 3615 Dreyfus St Houston, TX | 3.0 | 3.0 | 2011 | $2,800 | $1.39 | 43d | 1 | 1.36mi |
| 4835 Sunflower St Unit 1546466P Houston, TX | 3.0 | 2.0 | 1883 | $4,516 | $2.40 | 15d | 1 | 1.38mi |
| 7373 Ardmore St Houston, TX | 1.0–3.0 | 1.0–2.0 | 1095 | $1,887 | $1.72 | 4d | 24 | 1.38mi |
Listing history 24 events
-
2026-06-18days on market $314,900 Active 10 DOM
-
2026-06-17days on market $314,900 Active 9 DOM
-
2026-06-16days on market $314,900 Active 8 DOM
-
2026-06-15days on market $314,900 Active 7 DOM
-
2026-06-13days on market $314,900 Active 5 DOM
-
2026-06-08pricestatusdays on market $314,900 Active 1 DOM
-
2026-03-05price $324,900 530-char remark
Show marketing remark (530 chars)
Investors welcome. This low-maintenance duplex, just 15 minutes from downtown, is 9 years new and already generating income. Both units are occupied at $1,200 per month, providing immediate cash flow, Both units feature two comfortable bedrooms with ceiling fans, a well-appointed bathroom with ample cabinet storage, and convenient washer and dryer connections. With modern systems, practical finishes, and a prime location close to city amenities, this property is an ideal addition to any portfolio or a smart first investment.
-
2026-03-05$359,900 Active 530-char remark
Show marketing remark (530 chars)
Investors welcome. This low-maintenance duplex, just 15 minutes from downtown, is 9 years new and already generating income. Both units are occupied at $1,200 per month, providing immediate cash flow, Both units feature two comfortable bedrooms with ceiling fans, a well-appointed bathroom with ample cabinet storage, and convenient washer and dryer connections. With modern systems, practical finishes, and a prime location close to city amenities, this property is an ideal addition to any portfolio or a smart first investment.
-
2026-03-05historical
Show marketing remark (530 chars)
Investors welcome. This low-maintenance duplex, just 15 minutes from downtown, is 9 years new and already generating income. Both units are occupied at $1,200 per month, providing immediate cash flow, Both units feature two comfortable bedrooms with ceiling fans, a well-appointed bathroom with ample cabinet storage, and convenient washer and dryer connections. With modern systems, practical finishes, and a prime location close to city amenities, this property is an ideal addition to any portfolio or a smart first investment.
-
2026-02-17$359,900 Active
-
2026-02-05historical
-
2026-01-06price $360,000
-
2025-10-31$400,000 Active
-
2024-11-04historical $1,200
-
2024-10-19$1,200
-
2023-03-01soldstatus Sold
-
2023-03-01soldstatus
-
2023-01-30status Pending
-
2023-01-24status Option Pending
-
2023-01-03price $335,000
-
2022-12-19price $350,000
-
2022-11-20$375,000 Active
-
2021-09-15soldstatus
-
1989-06-13soldstatus
ⓘ Source: listings_history table (triggers on properties + properties_extension) + one-shot
backfill from property_details.listing_events for pre-trigger history.
Tax reassessment forecast TX · Resets to sale price
- Current annual tax
- $6,362 · $530/mo
- Projected year-2 tax
- $6,362 · $530/mo
- Expected delta
- $0/yr ($0/mo · 0.0%)
ⓘ Screening estimate from a state-policy table — verify with the county assessor before closing.
Climate risk First Street
- Flood 6/10 Major FEMA zone X (unshaded) · 67% chance over 30 yrs
- Wildfire 3/10 Moderate
- Heat 9/10 Extreme 7 d/yr ≥109°F today · 23 d/yr by 30 yrs out
- Wind 9/10 Extreme 99% chance of damaging wind over 30 yrs
- Air quality 2/10 Low 2 unhealthy d/yr today · 2 by 30 yrs out
Nearby sold comps map
Loading sold comps map…
Walkable amenities ~0.75 mi
Loading nearby amenities…
Taxation est. · year 1
- Rental income
- $32,292
- − Mortgage interest
- −$17,639
- − Property taxes
- −$6,362
- − Insurance
- −$1,574
- − Repairs & maintenance
- −$2,583
- − Management
- −$2,583
- − Depreciation
- −$9,161
- Taxable loss
- −$7,611
- Est. tax savings @ 24.0%
- +$1,827
- After-tax cash flow
- $-415/yr
For passive investors: Depreciation is non-cash, so a rental often shows a tax loss while cash-flowing — sheltering income. Rental losses are passive: they offset passive income freely, and up to $25,000/yr can offset ordinary (W-2) income if you actively participate and your MAGI is under $100k (phasing out to $0 by $150k); unused losses carry forward. On sale, claimed depreciation is recaptured at up to 25%, and gains may owe capital-gains tax (a 1031 exchange can defer both). Figures are a year-1 estimate at your 24.0% rate — not tax advice; consult a CPA.
Schools (NCES district)
- District
- Houston ISD
- NCES district ID
- 4823640
- Math proficiency
- 27% ▼ -18.00%
- Reading proficiency
- 35% ▼ -6.00%
- Median HH income
- $46,054
- Composite
- 26.63/100
- National rank
- #7173
- State rank
- #593 of 826 in TX
Livability — Houston
- Score
- 74/100
- State rank
- #184
- US rank
- #4771
Category grades
Schools grade is shown separately in the Schools card above.
Census & demographics
- Census place
- Houston, TX
- County
- Harris County · 4,702,590 people
- City population
- 3,226,434
- Metro
- Houston-The Woodlands-Sugar Land, TX
- Population (ZIP)
- 19,795
- Household income
- $37,415
- Rent vs Own
- Severe rent burden
- 1446.0
Population outlook (Harris County) Hauer SSP2
- Today (2025)
- 5,571,493 people
- By 2030
- 6,089,821 · +9.3%
- By 2040
- 7,142,806 · +28.2%
- By 2050
- 8,185,864 · +46.9%
- By 2075
- 10,574,329 · +89.8%
- By 2100
- 12,109,958 · +117.4%
Race, ethnicity, and origin ACS 2023
- Neighborhood character
- Predominantly Black (77%)
- Race & ethnicity
- Black 77% Hispanic / Latino 16% Two or more races 11% White 3%
- Hispanic origin (detail)
- Mexican 6% Puerto Rican 1%
- Foreign-born
- 8% · Canada, China
- Languages at home
- 88% English-only · Spanish 10%
Political lean MEDSL · Harris
- 2024 margin
- Lean D (+5.5) · D 52.0% · R 46.4% · Other 1.6%
- 2008→2024 swing
- +3.9pp toward D · 2008: 1.6pp · 2024: 5.5pp
- All cycles
- 2024: D+5.5 2020: D+13.3 2016: D+12.4 2012: D+0.1 2008: D+1.6
Not yet ingested
- Civics
- —
Market trends
- HPI YoY
- ▲ 16.02%
- Current HPI
- 180.4283
- Rent YoY
- ▲ 4.77%
- Metro
- Houston-The Woodlands-Sugar Land, TX
- State GDP YoY
- ▲ 3.95%
- F500 in state
- 110
Industry mix (Fortune 500 HQ in TX)
| Industry | F500 HQs | Revenue |
|---|---|---|
| Energy | 16 | $1,198B |
|
||
| Technology | 5 | $198B |
|
||
| Engineering / Construction | 4 | $72B |
|
||
| Energy Services | 3 | $60B |
|
||
| Utilities | 3 | $41B |
|
||
| Healthcare | 2 | $330B |
|
||
Price history
-13.4% since first listed18 events — show timeline
- 2026-03-05 Price Changed $324,900 HARMLS
- 2026-03-05 Listing Removed — HARMLS
- 2026-03-05 Listed $359,900 HARMLS
- 2026-02-17 Listed $359,900 HARMLS
- 2026-02-05 Listing Removed — HARMLS
- 2026-01-06 Price Changed $360,000 HARMLS
- 2025-10-31 Listed $400,000 HARMLS
- 2024-11-04 Rental Removed $1,200 RENTALBEAST
- 2024-10-19 Listed for Rent $1,200 RENTALBEAST
- 2023-03-01 Sold (Public Records) — Public Records
- 2023-03-01 Sold (MLS) — HARMLS
- 2023-01-30 Pending — HARMLS
- 2023-01-24 Pending — HARMLS
- 2023-01-03 Price Changed $335,000 HARMLS
- 2022-12-19 Price Changed $350,000 HARMLS
- 2022-11-20 Listed $375,000 HARMLS
- 2021-09-15 Sold (Public Records) — Public Records
- 1989-06-13 Sold (Public Records) — Public Records
Property tax history
+19.4%/yrLatest (2025): $6,362 · -0.3% YoY. Source: county tax records.
Cash-flow waterfall
monthlySold comps — $/sqft
last 12 mo · ≤1 miLoading sold comps…