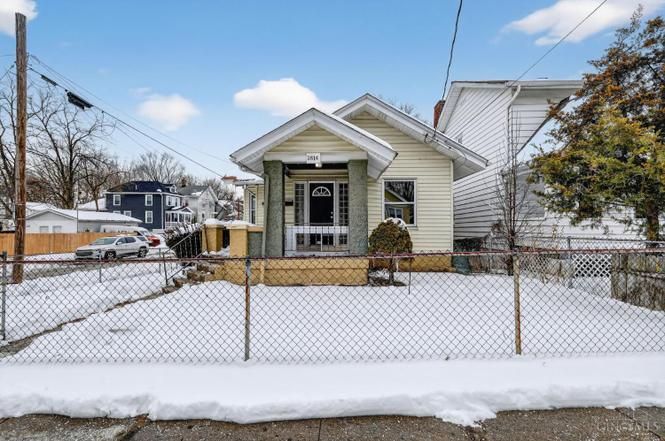
1814 Goodman Ave · North College Hill, OH
Flood risk 8/10 · Major
- FEMA flood zone
- X (unshaded)
- Chance of flooding over 30 yrs
- 0.99%
- Est. flood insurance / yr
- $473 – $860
Fire risk 1/10 · Minimal
- Est. fire insurance / yr
- $713 – $1,323
Heat risk 4/10 · Minor
- Hot days now (above 103°F)
- 7 days/yr
- Hot days in 30 yrs
- 19 days/yr
Wind risk 2/10 · Minimal
- Chance of severe wind over 30 yrs
- 1.0%
Air-quality risk 2/10 · Minimal
- Unhealthy air days now
- 1 days/yr
- Unhealthy air days in 30 yrs
- 1 days/yr
Risk factors via First Street. Map © Google.
Why this score? — see what drove the B+ grade
The composite is a weighted blend of 9 inputs, each scored 0–100. Each bar is that input's sub-score; the figure is the points it added to the 100-point composite (weight × sub-score).
- Cash flow +30.0/30.0
- ARV discount +15.0/15.0
- DSCR +10.0/10.0
- 1% rule +9.6/10.0
- Rent growth +4.0/5.0
- Livability +3.7/5.0
- Condition / age +2.5/5.0
- Schools +1.5/10.0
- Appreciation +0.0/10.0
$84,900
🖨 Deal sheet (PDF) 📄 Offer letter ✓ Due diligence
Listing remarks MLS
Great Opportunity for the serious handyman or investor! Inviting Front Porch, Fenced yard with detached garage, corner lot, walk to village, Living Room w/ fireplace, replacement windows, 9ft ceilings, roof 2019, eat in kitchen w/ bay window. No FHA/VA.
Key facts
- 4,312 sq ft lot
- Garage
- Built 1937
Property features AI
Finance
- HOA & community: No HOA
Exterior
- Parking: Detached 1-car garage; Driveway parking
- Utilities: Public water; Public sewer; Natural gas
- Home design: Traditional single-family home; One story; Poured foundation
- Construction: Vinyl siding construction; Poured foundation; Shingle roof
- Exterior features: Shingle roof; Vinyl siding; Vinyl windows; Residential zoning
Interior
- Kitchen: Tile floor in kitchen; Oven/Range; Refrigerator
- Bedrooms: 2 bedrooms total; Primary bedroom on level 1 (12 x 10); Second bedroom on level 1 (8 x 8)
- Flooring: Tile in kitchen; Vinyl windows
- Bathrooms: 1 full bathroom on level 1 with tub and shower
- Heating & cooling: Forced air gas heating; Central air conditioning; Gas water heating
- Interior features: Fireplace in living room (brick); Full unfinished basement
Neighborhood map
What this means for you Summary
Snapshot
- This is a 2-bed/1.0-bath single-family listed at $85k.
Deal economics
- At list price, monthly cash flow is $322 ($4k/yr) — positive.
- The deal already cash-flows at list — no discount required.
- Meets the 1% rule at list price ($1k rent vs $85k).
- Recommended offer: $75k (12.0% below list) — sets the bar for market timing.
- Cap rate 11.6% vs local median 6.5% in North College Hill — top-decile yield for the area; either an underpriced asset or a hidden risk that comps aren't pricing in. Stress-test before assuming the spread holds.
Location & tenants
- Location reads 74/100 on livability (#288 in OH, #4,745 nationally) — a middle-class / working-renter tenant base. Strengths: commute A+, cost of living A+, housing A+; Watch: employment C-, amenities D, crime F.
- North College Hill City (suburban): math 13% / reading 22% proficiency, ranked #637 of 656 in OH (top 97%) — low school quality limits family demand, transient renter base, plan for 1-2y turnover; 75% free/reduced lunch — lower-income household profile, screen leases tightly.
- Zoned schools: North College Hill Elementary School (math 17% / reading 22%, grade F, #1,293 of 1,584 statewide, top 83%, 481 students, 0% FRL); North College Hill Middle School (math 11% / reading 22%, grade F, #622 of 654 statewide, top 95%, 430 students, 0% FRL); North College Hill High School (math 12% / reading 22%, grade F, #701 of 781 statewide, top 90%, 333 students, 0% FRL) — zoned schools average 0% FRL vs 75% district-wide (75 pts lower); this property's tenant base skews higher-income than the district average.
- Market conditions: Rents rising fast (+6.0%/yr); 57 active listings in the ZIP; 8 comparable units currently listed for rent nearby; rentals at typical pace (median 25d on market — plan ~3-4 weeks tenant-placement turnaround); 801 units permitted in Hamilton County in 2024 (190 in 5+ unit buildings).
Forward outlook
- Local home prices are declining (-3.0%/yr); year-one equity from $587 of loan paydown is wiped out by about $3k of value loss. Plan a longer hold.
- At projected returns (-3.0% appreciation + 6.0% rent growth), your $24k cash investment doubles in ~7 years — after that, you're playing with house money.
Negotiation context
- It's been on market 132 days — a 12% lower offer ($75k) is reasonable based on typical stale-listing flexibility.
- 5 sale attempts since 25y ago; this cycle's ask has dropped $25k (23%) from the opening price — seller is motivated, your offer sets the floor, not the list.
- Current owner paid $37k; list at $85k implies a 131% gain — meaningful room to come down on a strong offer.
Risks & watch-outs
- Watch-outs: flood insurance adds $56/mo; built in 1937 — expect roof / HVAC / electrical / plumbing capex.
- Climate carrying-cost: severe flood risk — expect insurance premiums to compound above CPI over the hold.
Questions for the listing agent
- It's been on market 132 days. Have you received any prior offers? Is the seller open to a 12% concession, seller financing, or rate buy-down credit?
- Built in 1937 — when were the roof, HVAC, electrical panel, plumbing, and water heater last replaced?
- What's the actual annual flood-insurance premium (NFIP or private), and is the property in a SFHA with mandatory coverage?
- Why hasn't it sold? Are there any deal-killer items the seller is aware of (foundation, flood, title, zoning, code violations)?
- Is there a deadline driving the sale (1031 exchange, divorce, estate, relocation)? That informs how much negotiation room exists.
- Schools are D-rated, which usually means shorter tenancies and higher turnover. Who's the typical renter profile here, and what's been the actual vacancy rate?
- Crime grade is F in this area — have there been break-ins, vandalism, or insurance claims at this property in the last 3 years? What carrier currently insures it and at what premium?
- What's the average days-on-market for RENTAL listings here right now (not sales)? A rising rental-DOM trend means longer vacancies and softer asking-rent achievability than the comps imply.
- What's the recent tenant-quality profile in this submarket — average credit score on applications, eviction rate, late-payment / NSF rate, and stable-employment percentage? A property-management company in the area should have these aggregated.
- How much new for-sale + rental construction is in the pipeline within 1–3 miles? Heavy new supply typically softens prices + rents 12–24 months out; constrained supply supports both.
Investment metrics
- 1% rule
- 1.46% ✓
- Cap rate
- 11.63%
- Cash-on-cash
- 19.07%
- DSCR
- 1.85
- GRM
- 5.7
CMA / ARV
- ARV (on-the-fly)
- $132,460
- Comps found
- 12
Show comp detail 12 sales within ~0.75 mi
| Address | Dist | Beds/Ba | Sqft | Sold | Price | $/sf | Match |
|---|---|---|---|---|---|---|---|
| 1703 De Armand Ave | 0.17mi | 1/1.0 (-1) | 740 (+3%) | 6mo | $105,500 | $143 | 77 |
| 1819 Goodman Ave | 0.03mi | 1/1.0 (-1) | 740 (+3%) | 19mo | $92,000 | $124 | 72 |
| 1838 De Armand Ave | 0.11mi | 2/1.0 | 818 (+14%) | 0mo | $155,000 | $189 | 71 |
| 6912 Noble Ave | 0.24mi | 2/1.0 | 768 (+7%) | 8mo | $85,000 | $111 | 70 |
| 6708 Betts Ave | 0.18mi | 2/1.0 | 676 (-6%) | 17mo | $136,000 | $201 | 68 |
| 1813 Sundale Ave | 0.20mi | 2/1.5 | 786 (+10%) | 6mo | $179,000 | $228 | 68 |
| 1837 Catalpa Ave | 0.48mi | 2/1.0 | 672 (-6%) | 1mo | $145,500 | $217 | 66 |
| 6506 Simpson Ave | 0.47mi | 1/1.0 (-1) | 720 (+1%) | 14mo | $133,000 | $185 | 61 |
| 1718 Joseph Ct | 0.62mi | 2/1.0 | 780 (+9%) | 3mo | $90,000 | $115 | 54 |
| 1914 Cordova Ave | 0.43mi | 2/1.0 | 776 (+8%) | 23mo | $125,000 | $161 | 47 |
| 1948 Catalpa Ave | 0.52mi | 3/1.0 (+1) | 792 (+11%) | 20mo | $97,500 | $123 | 36 |
| 1701 Norcol Ln | 0.49mi | 2/1.0 | 820 (+14%) | 21mo | $160,000 | $195 | 35 |
Match score weights: distance 35% · size 25% · config 20% · recency 20%. Top-matched comps best support the ARV.
Projected returns pro-forma
-3.0% appreciation · 6.0% rent growth · sell at horizon
- IRR
- 10.9%
- Equity multiple
- 1.45×
- Total profit
- $10,670
- Equity at exit
- $12,659
- IRR
- 22.4%
- Equity multiple
- 3.22×
- Total profit
- $52,747
- Equity at exit
- $7,341
Cash invested: $23,772 (down + closing). Projections, not guarantees.
Landlord ↔ Tenant lean methodology
- Overall (STATE)
- 73 Landlord-Friendly
- State Ohio
- 73 Landlord-Friendly · R+6
- County
- — inherits STATE
- City
- — inherits STATE
ZIP-level market 45239
- Home prices YoY
- -32.8%
- Rents YoY
- 6.0%
- Active inventory
- 57
- Price-to-rent
- 5.7×
Monthly cashflow live
- Estimated rent
- $1,237 high interval (Pro) →
- Mortgage (P&I)
- −$445
- Tax from tax record
- −$119 /mo · $1,428/yr
- Insurance
- −$35
- Flood insurance flood zone
- −$56 /mo · $666/yr
- HOA
- −$0
- Vacancy / Maint / Mgmt
- −$260
- Net cashflow
- $322
Break-even live
Sensitivity live
| Price | -10% $370 | -5% $346 | +0% $322 | +5% $298 | +10% $274 |
|---|---|---|---|---|---|
| Rent | -10% $224 | -5% $273 | +0% $322 | +5% $371 | +10% $420 |
| Rate | -1.0pp $365 | -0.5pp $344 | base $322 | +0.5pp $300 | +1.0pp $278 |
UW: 25.0% down · 7.5% · 30yr · 1.5% tax · 5.0% vac · 8.0% maint · 8.0% mgmt
Financing live
Cash to close
- Down payment
- $21,225
- Closing costs
- $2,547
- Reserves months
- —
- Total cash needed
- —
Loan-product check · same deal, 3 products live
Conventional
25% down · 7.5% · 30yr
- Down + closing
- —
- Monthly P&I
- —
- Monthly cashflow
- —
- DSCR
- —
- Eligible?
- —
Personal DTI + credit; lowest rate.
DSCR
20% down · 8.5% · 30yr
- Down + closing
- —
- Monthly P&I
- —
- Monthly cashflow
- —
- DSCR
- —
- Eligible?
- —
No personal income docs; deal must DSCR.
Hard money
10% down · 12.0% · 12mo
- Down + closing
- —
- Monthly P&I
- —
- Monthly cashflow
- —
- DSCR
- —
- Eligible?
- —
Short-term bridge; refi at stabilization.
Rent comps 8 comps
| Address | Beds | Baths | Sqft | Rent | $/sqft | DOM | Units | Dist |
|---|---|---|---|---|---|---|---|---|
| 1667 Lakenoll Dr Mt Healthy, OH | 1.0–2.0 | 1.0–1.5 | 817 | $1,385 | $1.69 | 5d | 7 | 0.75mi |
| 1385 W Galbraith Rd Cincinnati, OH | 1.0 | 1.0 | 576 | $850 | $1.48 | 25d | 1 | 0.83mi |
| 1927 W North Bend Rd Apt 3 Cincinnati, OH | 1.0 | 1.0 | 700 | $1,082 | $1.55 | 18d | 1 | 0.95mi |
| 7419 Werner Ave Unit 8 Cincinnati, OH | 1.0 | 1.0 | 700 | $850 | $1.21 | 25d | 1 | 0.98mi |
| 6211 Hamilton Ave Cincinnati, OH | 2.0 | 1.0–2.0 | 842 | $1,968 | $2.34 | 3d | 17 | 1.01mi |
| 5800 Renee Ct Cincinnati, OH | 1.0 | 1.0 | 595 | $899 | $1.51 | 25d | 1 | 1.04mi |
| 7777 Compton Lake Dr Cincinnati, OH | 1.0 | 1.5 | 740 | $1,125 | $1.52 | 5d | 3 | 1.24mi |
| 7701 Clovernook Ave Cincinnati, OH | 1.0–2.0 | 1.0–1.5 | 787 | $1,365 | $1.73 | 25d | 1 | 1.50mi |
Listing history 25 events
-
2026-06-21days on market $84,900 Active 132 DOM
-
2026-06-18days on market $84,900 Active 129 DOM
-
2026-06-17days on market $84,900 Active 128 DOM
-
2026-06-16days on market $84,900 Active 127 DOM
-
2026-06-15days on market $84,900 Active 126 DOM
-
2026-06-13pricedays on market $84,900 Active 124 DOM
-
2026-06-09days on market $89,900 Active 120 DOM
-
2026-06-08days on market $89,900 Active 119 DOM
-
2026-06-07pricedays on market $89,900 Active 118 DOM
-
2026-06-03days on market $99,900 Active 114 DOM
-
2026-06-02days on market $99,900 Active 113 DOM
-
2026-06-01days on market $99,900 Active 112 DOM
-
2026-05-31statusdays on market $99,900 Active 111 DOM
-
2026-05-14status Active
-
2026-04-18historical Contingency Pending
-
2026-04-13price $99,900
-
2026-02-09$109,900 Active
-
2020-04-20soldstatus $36,700 Sold 253-char remark
Show marketing remark (253 chars)
Great Opportunity for the serious handyman or investor! Inviting Front Porch, Fenced yard with detached garage, corner lot, walk to village, Living Room w/ fireplace, replacement windows, 9ft ceilings, roof 2019, eat in kitchen w/ bay window. No FHA/VA.
-
2020-04-10historical Contingency Pending 253-char remark
Show marketing remark (253 chars)
Great Opportunity for the serious handyman or investor! Inviting Front Porch, Fenced yard with detached garage, corner lot, walk to village, Living Room w/ fireplace, replacement windows, 9ft ceilings, roof 2019, eat in kitchen w/ bay window. No FHA/VA.
-
2020-04-09status Active 253-char remark
Show marketing remark (253 chars)
Great Opportunity for the serious handyman or investor! Inviting Front Porch, Fenced yard with detached garage, corner lot, walk to village, Living Room w/ fireplace, replacement windows, 9ft ceilings, roof 2019, eat in kitchen w/ bay window. No FHA/VA.
-
2020-03-18historical Contingency Pending 253-char remark
Show marketing remark (253 chars)
Great Opportunity for the serious handyman or investor! Inviting Front Porch, Fenced yard with detached garage, corner lot, walk to village, Living Room w/ fireplace, replacement windows, 9ft ceilings, roof 2019, eat in kitchen w/ bay window. No FHA/VA.
-
2020-03-15$39,900 Active 253-char remark
Show marketing remark (253 chars)
Great Opportunity for the serious handyman or investor! Inviting Front Porch, Fenced yard with detached garage, corner lot, walk to village, Living Room w/ fireplace, replacement windows, 9ft ceilings, roof 2019, eat in kitchen w/ bay window. No FHA/VA.
-
2001-04-03soldstatus $51,000
-
2001-03-30soldstatus $51,000 202-char remark
Show marketing remark (202 chars)
Charming Home With Cheerful Eat-in Kitchen With Lots Of Natural Light And Bay Window! Newer Furnace And C/A! Newer Garage Door. Glass Block Windows. Circuit Breakers. Fenced Yard. Built-in Book Shelves.
-
2001-02-10$56,900 202-char remark
Show marketing remark (202 chars)
Charming Home With Cheerful Eat-in Kitchen With Lots Of Natural Light And Bay Window! Newer Furnace And C/A! Newer Garage Door. Glass Block Windows. Circuit Breakers. Fenced Yard. Built-in Book Shelves.
ⓘ Source: listings_history table (triggers on properties + properties_extension) + one-shot
backfill from property_details.listing_events for pre-trigger history.
Tax reassessment forecast OH · Partial reset (capped growth)
- Current annual tax
- $1,428 · $119/mo
- Projected year-2 tax
- $1,428 · $119/mo
- Expected delta
- $0/yr ($0/mo · 0.0%)
ⓘ Screening estimate from a state-policy table — verify with the county assessor before closing.
Climate risk First Street
- Flood 8/10 Severe FEMA zone X (unshaded) · 99% chance over 30 yrs
- Wildfire 1/10 Low
- Heat 4/10 Moderate 7 d/yr ≥103°F today · 19 d/yr by 30 yrs out
- Wind 2/10 Low 100% chance of damaging wind over 30 yrs
- Air quality 2/10 Low 1 unhealthy d/yr today · 1 by 30 yrs out
Nearby sold comps map
Loading sold comps map…
Walkable amenities ~0.75 mi
Loading nearby amenities…
Taxation est. · year 1
- Rental income
- $14,845
- − Mortgage interest
- −$4,756
- − Property taxes
- −$1,428
- − Insurance
- −$1,091
- − Repairs & maintenance
- −$1,188
- − Management
- −$1,188
- − Depreciation
- −$2,470
- Taxable income
- $2,726
- Est. tax owed @ 24.0%
- −$654
- After-tax cash flow
- $3,212/yr
For passive investors: Depreciation is non-cash, so a rental often shows a tax loss while cash-flowing — sheltering income. Rental losses are passive: they offset passive income freely, and up to $25,000/yr can offset ordinary (W-2) income if you actively participate and your MAGI is under $100k (phasing out to $0 by $150k); unused losses carry forward. On sale, claimed depreciation is recaptured at up to 25%, and gains may owe capital-gains tax (a 1031 exchange can defer both). Figures are a year-1 estimate at your 24.0% rate — not tax advice; consult a CPA.
Schools (NCES district)
- District
- North College Hill City
- NCES district ID
- 3904451
- Math proficiency
- 13% ▼ -14.00%
- Reading proficiency
- 22% ▼ -11.00%
- Median HH income
- $40,355
- Composite
- 14.89/100
- National rank
- #9375
- State rank
- #637 of 656 in OH
Livability — North College Hill
- Score
- 74/100
- State rank
- #288
- US rank
- #4745
Category grades
Schools grade is shown separately in the Schools card above.
Census & demographics
- Census place
- North College Hill, OH
- County
- Hamilton County · 701,295 people
- Metro
- Cincinnati, OH-KY-IN
- Population (ZIP)
- 29,607
- Household income
- $60,324
- Rent vs Own
- Severe rent burden
- 1566.0
Population outlook (Hamilton County) Hauer SSP2
- Today (2025)
- 826,054 people
- By 2030
- 830,947 · +0.6%
- By 2040
- 832,319 · +0.8%
- By 2050
- 822,428 · -0.4%
- By 2075
- 788,688 · -4.5%
- By 2100
- 710,674 · -14.0%
Race, ethnicity, and origin ACS 2023
- Neighborhood character
- Diverse neighborhood (Simpson 0.63)
- Race & ethnicity
- White 50% Black 35% Two or more races 8% Hispanic / Latino 4% Asian 4%
- Common ancestry
- Lithuanian 2% Slovak 1% Italian 1%
- Foreign-born
- 4% · India, Canada
- Languages at home
- 93% English-only · Other Indo-European 3% Spanish 2%
Political lean MEDSL · Hamilton
- 2024 margin
- D (+14.9) · D 57.0% · R 42.1%
- 2008→2024 swing
- +7.9pp toward D · 2008: 7.0pp · 2024: 14.9pp
- All cycles
- 2024: D+14.9 2020: D+15.9 2016: D+9.5 2012: D+4.9 2008: D+7.0
Not yet ingested
- Civics
- —
Market trends
- HPI YoY
- ▼ -114.46%
- Current HPI
- 234.6033
- Rent YoY
- ▲ 6.00%
- Metro
- Cincinnati, OH-KY-IN
- State GDP YoY
- ▲ 1.98%
- F500 in state
- 48
Industry mix (Fortune 500 HQ in OH)
| Industry | F500 HQs | Revenue |
|---|---|---|
| Insurance | 3 | $145B |
|
||
| Industrial Machinery | 3 | $49B |
|
||
| Financial Services | 3 | $24B |
|
||
| Consumer Goods | 2 | $93B |
|
||
| Aerospace / Defense | 2 | $47B |
|
||
| Utilities | 2 | $33B |
|
||
Price history
+75.6% since first listed12 events — show timeline
- 2026-05-14 Relisted — Cincy MLS
- 2026-04-18 Contingent — Cincy MLS
- 2026-04-13 Price Changed $99,900 Cincy MLS
- 2026-02-09 Listed $109,900 Cincy MLS
- 2020-04-20 Sold (MLS) $36,700 Cincy MLS
- 2020-04-10 Contingent — Cincy MLS
- 2020-04-09 Relisted — Cincy MLS
- 2020-03-18 Contingent — Cincy MLS
- 2020-03-15 Listed $39,900 Cincy MLS
- 2001-04-03 Sold (Public Records) $51,000 Public Records
- 2001-03-30 Sold (MLS) $51,000 Cincy MLS
- 2001-02-10 Listed $56,900 Cincy MLS
Property tax history
+1.7%/yrLatest (2025): $1,428 · +0.0% YoY. Source: county tax records.
Cash-flow waterfall
monthlySold comps — $/sqft
last 12 mo · ≤1 miLoading sold comps…