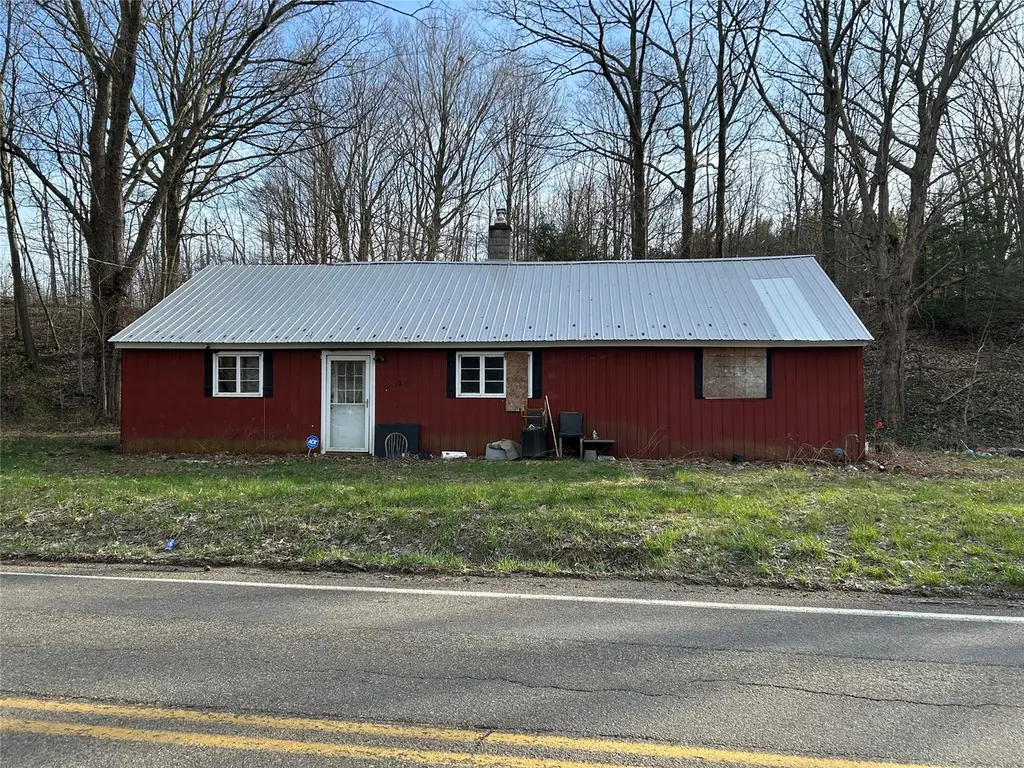
7072 Findley Lake Rd · North East, PA
Flood risk 10/10 · Severe
- FEMA flood zone
- A
- Chance of flooding over 30 yrs
- 0.99%
- Est. flood insurance / yr
- $1,009 – $1,996
Fire risk 1/10 · Minimal
- Est. fire insurance / yr
- $511 – $949
Heat risk 2/10 · Minimal
- Hot days now (above 90°F)
- 6 days/yr
- Hot days in 30 yrs
- 15 days/yr
Wind risk 1/10 · Minimal
- Chance of severe wind over 30 yrs
- —
Air-quality risk 2/10 · Minimal
- Unhealthy air days now
- 1 days/yr
- Unhealthy air days in 30 yrs
- 2 days/yr
Risk factors via First Street. Map © Google.
Why this score? — see what drove the B grade
The composite is a weighted blend of 9 inputs, each scored 0–100. Each bar is that input's sub-score; the figure is the points it added to the 100-point composite (weight × sub-score).
- Cash flow +30.0/30.0
- 1% rule +10.0/10.0
- DSCR +10.0/10.0
- ARV discount +7.5/15.0
- Schools +4.9/10.0
- Livability +4.4/5.0
- Rent growth +2.5/5.0
- Condition / age +2.5/5.0
- Appreciation +0.0/10.0
$50,000
🖨 Deal sheet 📄 Offer letter ✓ Due diligence
Listing remarks
This property offers a redevelopment opportunity for investors, contractors, or buyers seeking a project on just over one acre in Northeast Pennsylvania. The existing structure has sustained significant fire damage and is likely a teardown. Buyers should assume the home is not salvageable. Property is being sold AS-IS, WHERE-IS, with no representations or warranties. All contents currently on site will remain. Extreme caution is required. The structure may be unstable and unsafe to enter. Buyers and agents enter at their own risk and are strongly advised to exercise care when accessing the property. Consider exterior viewing only. Bring your vision and evaluate the potential this site has t
Key facts
- 1.15 acre lot
- Built 1955
- Listed 4 days
Neighborhood map
What this means for you Summary
Snapshot
- This is a 3-bed/1.0-bath single-family listed at $50k.
Deal economics
- At list price, monthly cash flow is $425 ($5k/yr) — positive.
- The deal already cash-flows at list — no discount required.
- Meets the 1% rule at list price ($1k rent vs $50k).
- Cap rate 19.5% vs local median 3.3% in North East — top-decile yield for the area; either an underpriced asset or a hidden risk that comps aren't pricing in. Stress-test before assuming the spread holds.
Location & tenants
- Location reads 88/100 on livability (#42 in PA, #233 nationally) — a professional / high-income tenant draw. Strengths: cost of living A+, housing A+, health & safety A+.
- North East SD (town): math 47% / reading 69% proficiency, ranked #88 of 539 in PA (top 16%) — acceptable for families but not a draw, mixed tenant base, ~2y average lease.
- Market conditions: 61 active listings in the ZIP; 364 units permitted in Erie County in 2024 (188 in 5+ unit buildings).
Forward outlook
- Local home prices are declining (-3.0%/yr); year-one equity from $346 of loan paydown is wiped out by about $2k of value loss. Plan a longer hold.
- Erie County population projected at -14% by 2050 — secular population decline; favor cash flow + early exit over multi-decade hold.
- At projected returns (-3.0% appreciation + 3.0% rent growth), your $14k cash investment doubles in ~4 years — after that, you're playing with house money.
Negotiation context
- Only 4 days on market — expect competitive offers; lowballing is unlikely to land.
- 5 sale attempts since 12y ago with the ask held roughly flat each time — persistent listings suggest the price (not the market) is what's stuck; bring a comps-based counter.
Risks & watch-outs
- Watch-outs: flood insurance adds $125/mo; built in 1955 — expect roof / HVAC / electrical / plumbing capex.
- Climate carrying-cost: in FEMA flood zone A (mandatory federal flood insurance) — expect insurance premiums to compound above CPI over the hold.
Questions for the listing agent
- Built in 1955 — when were the roof, HVAC, electrical panel, plumbing, and water heater last replaced?
- What's the actual annual flood-insurance premium (NFIP or private), and is the property in a SFHA with mandatory coverage?
- Is there a deadline driving the sale (1031 exchange, divorce, estate, relocation)? That informs how much negotiation room exists.
- Schools are B-rated — typically a magnet for longer-tenancy family renters. What's the average tenant stay here, and is there a school-zone premium baked into asking?
- What's the average days-on-market for RENTAL listings here right now (not sales)? A rising rental-DOM trend means longer vacancies and softer asking-rent achievability than the comps imply.
- What's the recent tenant-quality profile in this submarket — average credit score on applications, eviction rate, late-payment / NSF rate, and stable-employment percentage? A property-management company in the area should have these aggregated.
- How much new for-sale + rental construction is in the pipeline within 1–3 miles? Heavy new supply typically softens prices + rents 12–24 months out; constrained supply supports both.
Investment metrics
- 1% rule
- 2.33% ✓
- Cap rate
- 19.51%
- Cash-on-cash
- 47.19%
- DSCR
- 3.10
- GRM
- 3.6
CMA / ARV
- ARV (on-the-fly)
- $358,720
- Comps found
- 4
Show comp detail 4 sales within ~0.75 mi
| Address | Dist | Beds/Ba | Sqft | Sold | Price | $/sf | Match |
|---|---|---|---|---|---|---|---|
| 11169 Maple Dr | 0.71mi | 4/2.0 (+1) | 1,615 (+6%) | 3mo | $301,000 | $186 | 45 |
| 4716 Cedar Dr | 0.70mi | 3/2.0 | 1,356 (-11%) | 3mo | $282,000 | $208 | 43 |
| 126 Pine Tree Ln | 0.64mi | 2/2.5 (-1) | 1,400 (-8%) | 7mo | $330,000 | $236 | 40 |
| 114 Pine Tree Ln | 0.66mi | 3/3.0 | 1,558 (+2%) | 23mo | $377,000 | $242 | 38 |
Match score weights: distance 35% · size 25% · config 20% · recency 20%. Top-matched comps best support the ARV.
Projected returns pro-forma
-3.0% appreciation · 3.0% rent growth · sell at horizon
- IRR
- 32.4%
- Equity multiple
- 2.36×
- Total profit
- $19,102
- Equity at exit
- $7,455
- IRR
- 39.5%
- Equity multiple
- 4.71×
- Total profit
- $51,969
- Equity at exit
- $4,323
Cash invested: $14,000 (down + closing). Projections, not guarantees.
Landlord ↔ Tenant lean methodology
- Overall (STATE)
- 62 Landlord-Friendly
- State Pennsylvania
- 62 Landlord-Friendly · EVEN
- County
- — inherits STATE
- City
- — inherits STATE
ZIP-level market 16428
- Home prices YoY
- -26.0%
- Active inventory
- 61
- Price-to-rent
- 3.6×
Monthly cashflow live
- Estimated rent
- $1,167 medium interval (Pro) →
- Mortgage (P&I)
- −$262
- Tax from tax record
- −$88 /mo · $1,059/yr
- Insurance
- −$21
- Flood insurance flood zone
- −$125 /mo · $1,502/yr
- HOA
- −$0
- Vacancy / Maint / Mgmt
- −$245
- Net cashflow
- $425
Break-even live
UW: 25.0% down · 7.5% · 30yr · 1.5% tax · 5.0% vac · 8.0% maint · 8.0% mgmt
Financing live
Cash to close
- Down payment
- $12,500
- Closing costs
- $1,500
- Reserves months
- —
- Total cash needed
- —
Loan-product check · same deal, 3 products live
Conventional
25% down · 7.5% · 30yr
- Down + closing
- —
- Monthly P&I
- —
- Monthly cashflow
- —
- DSCR
- —
- Eligible?
- —
Personal DTI + credit; lowest rate.
DSCR
20% down · 8.5% · 30yr
- Down + closing
- —
- Monthly P&I
- —
- Monthly cashflow
- —
- DSCR
- —
- Eligible?
- —
No personal income docs; deal must DSCR.
Hard money
10% down · 12.0% · 12mo
- Down + closing
- —
- Monthly P&I
- —
- Monthly cashflow
- —
- DSCR
- —
- Eligible?
- —
Short-term bridge; refi at stabilization.
Listing history 11 events
-
2026-04-20status Pending
-
2026-04-16$50,000 Active
-
2021-05-07soldstatus $104,500
-
2021-04-30soldstatus $104,500
-
2020-11-19$109,900
-
2019-09-11soldstatus $37,500
-
2019-06-11$42,500
-
2018-12-07$44,900
-
2014-07-21$59,000
-
1991-10-14soldstatus $50,000
-
1989-08-18soldstatus $41,000
ⓘ Source: listings_history table (triggers on properties + properties_extension) + one-shot
backfill from property_details.listing_events for pre-trigger history.
Tax reassessment forecast PA · Partial reset (capped growth)
- Current annual tax
- $1,059 · $88/mo
- Projected year-2 tax
- $1,059 · $88/mo
- Expected delta
- $0/yr ($0/mo · 0.0%)
ⓘ Screening estimate from a state-policy table — verify with the county assessor before closing.
Climate risk First Street
- Flood 10/10 Extreme FEMA zone A · 99% chance over 30 yrs
- Wildfire 1/10 Low
- Heat 2/10 Low 6 d/yr ≥90°F today · 15 d/yr by 30 yrs out
- Wind 1/10 Low
- Air quality 2/10 Low 1 unhealthy d/yr today · 2 by 30 yrs out
Nearby sold comps map
Loading sold comps map…
Walkable amenities ~0.75 mi
Loading nearby amenities…
Taxation est. · year 1
- Rental income
- $14,003
- − Mortgage interest
- −$2,801
- − Property taxes
- −$1,059
- − Insurance
- −$1,752
- − Repairs & maintenance
- −$1,120
- − Management
- −$1,120
- − Depreciation
- −$1,455
- Taxable income
- $4,696
- Est. tax owed @ 24.0%
- −$1,127
- After-tax cash flow
- $3,978/yr
For passive investors: Depreciation is non-cash, so a rental often shows a tax loss while cash-flowing — sheltering income. Rental losses are passive: they offset passive income freely, and up to $25,000/yr can offset ordinary (W-2) income if you actively participate and your MAGI is under $100k (phasing out to $0 by $150k); unused losses carry forward. On sale, claimed depreciation is recaptured at up to 25%, and gains may owe capital-gains tax (a 1031 exchange can defer both). Figures are a year-1 estimate at your 24.0% rate — not tax advice; consult a CPA.
Schools (NCES district)
- District
- North East SD
- NCES district ID
- 4217160
- Math proficiency
- 47% ▼ -15.00%
- Reading proficiency
- 69% ▼ -8.00%
- Median HH income
- $48,844
- Composite
- 49.22/100
- National rank
- #2037
- State rank
- #88 of 539 in PA
Livability — North East
- Score
- 88/100
- State rank
- #42
- US rank
- #233
Category grades
Schools grade is shown separately in the Schools card above.
Census & demographics
- Population (ZIP)
- 12,508
Population outlook (Erie County) Hauer SSP2
- Today (2025)
- 272,159 people
- By 2030
- 266,299 · -2.2%
- By 2040
- 250,987 · -7.8%
- By 2050
- 234,925 · -13.7%
- By 2075
- 199,164 · -26.8%
- By 2100
- 162,985 · -40.1%
Race, ethnicity, and origin ACS 2023
- Neighborhood character
- Predominantly White (91%)
- Race & ethnicity
- White 91% Two or more races 6% Hispanic / Latino 4%
- Common ancestry
- Romanian 13% Lithuanian 2% Italian 2%
- Foreign-born
- 1%
- Languages at home
- 98% English-only · Arabic 1% Spanish 1%
Political lean MEDSL · Erie
- 2024 margin
- Toss-up / Even · D 49.0% · R 50.0%
- 2008→2024 swing
- -20.9pp toward R · 2008: 19.9pp · 2024: -1.0pp
- All cycles
- 2024: R+1.0 2020: D+1.0 2016: R+2.0 2012: D+16.9 2008: D+19.9
Not yet ingested
- Civics
- —
Market trends
- HPI YoY
- ▼ -90.46%
- Current HPI
- 257.9847
- Rent YoY
- —
- Metro
- —
- State GDP YoY
- ▲ 1.68%
- F500 in state
- 34
Industry mix (Fortune 500 HQ in PA)
| Industry | F500 HQs | Revenue |
|---|---|---|
| Healthcare | 2 | $309B |
|
||
| Insurance | 2 | $27B |
|
||
| Telecommunications / Media | 1 | $124B |
|
||
| Industrial Distribution | 1 | $22B |
|
||
| Financial Services | 1 | $20B |
|
||
| Chemicals / Materials | 1 | $18B |
|
||
Price history
+22.0% since first listed11 events — show timeline
- 2026-04-20 Pending — GEBOR
- 2026-04-16 Listed $50,000 GEBOR
- 2021-05-07 Sold (Public Records) $104,500 Public Records
- 2021-04-30 Sold (MLS) $104,500 GEBOR
- 2020-11-19 Listed $109,900 GEBOR
- 2019-09-11 Sold (MLS) $37,500 GEBOR
- 2019-06-11 Listed $42,500 GEBOR
- 2018-12-07 Listed $44,900 GEBOR
- 2014-07-21 Listed $59,000 GEBOR
- 1991-10-14 Sold (Public Records) $50,000 Public Records
- 1989-08-18 Sold (Public Records) $41,000 Public Records
Property tax history
+2.2%/yrLatest (2026): $1,059 · +3.4% YoY. Source: county tax records.
Cash-flow waterfall
monthlySold comps — $/sqft
last 12 mo · ≤1 miLoading sold comps…