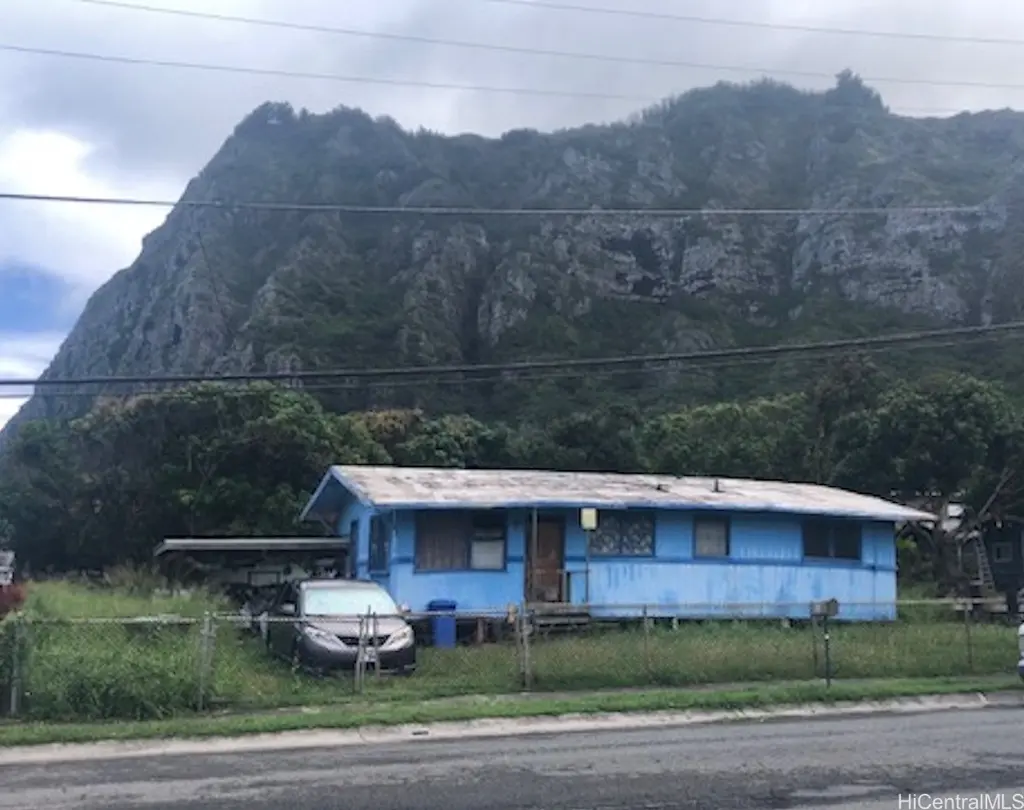
41-160 Huli St · Waimanalo Beach, HI
Flood risk 4/10 · Minor
- FEMA flood zone
- X (unshaded)
- Chance of flooding over 30 yrs
- 0.22%
- Est. flood insurance / yr
- $507 – $1,088
Fire risk No data
- Est. fire insurance / yr
- —
Heat risk No data
- Hot days now (above threshold)
- —
- Hot days in 30 yrs
- —
Wind risk No data
- Chance of severe wind over 30 yrs
- —
Air-quality risk 1/10 · Minimal
- Unhealthy air days now
- —
- Unhealthy air days in 30 yrs
- —
Risk factors via First Street. Map © Google.
Why this score? — see what drove the D grade
The composite is a weighted blend of 9 inputs, each scored 0–100. Each bar is that input's sub-score; the figure is the points it added to the 100-point composite (weight × sub-score).
- Cash flow +11.9/30.0
- ARV discount +7.5/15.0
- Appreciation +6.1/10.0
- Schools +3.7/10.0
- DSCR +3.5/10.0
- 1% rule +3.4/10.0
- Livability +3.0/5.0
- Rent growth +2.5/5.0
- Condition / age +2.5/5.0
$380,000
🖨 Deal sheet 📄 Offer letter ✓ Due diligence
Listing remarks MLS
Hawaiian Homelands in Waimanalo- Opportunity to build your dreamhome in the country near the beach, busline & school. Purchaser must be at least 50% Hawaiian. This is a leasehold property.
Key facts
- 7,525 sq ft lot
- 2 parking spots
- Built 1967
Neighborhood map
What this means for you Summary
Snapshot
- This is a 3-bed/1.0-bath single-family listed at $380k.
Deal economics
- At list price, monthly cash flow is $-98 ($-1k/yr) — negative.
- To cash-flow at today's rent, offer at most $366k (3.7% below list).
- To meet the 1% rule (rent ≥ 1% of price), the offer needs to be $320k (15.8% below list).
- Recommended offer: $320k (15.8% below list) — sets the bar for 1% rule.
Location & tenants
- Location reads 60/100 on livability (#86 in HI) — a middle-class / working-renter tenant base. Strengths: employment A+, crime A, housing B+; Watch: health & safety C-, schools D, amenities F.
- Hawaii Department Of Education (suburban): math 32% / reading 50% proficiency, ranked #1 of 1 in HI (top 100%) — families likely to look elsewhere, expect single-tenant / working-renter base with shorter leases.
- Market conditions: 10 active listings in the ZIP; 1 comparable units currently listed for rent nearby; 1,638 units permitted in Honolulu County in 2024 (793 in 5+ unit buildings).
Forward outlook
- In year one you build about $11k of equity ($3k loan paydown + $8k appreciation (2.2% local appreciation)).
- Honolulu County population projected at +17% by 2050 — long-run rental-demand tailwind backs the buy-and-hold thesis.
- By year 4, paydown + projected appreciation supports a ~$38k cash-out refi (75% LTV) — recoverable capital for the next deal without selling this one.
Negotiation context
- It's been on market 111 days — a 9% lower offer ($346k) is reasonable based on typical stale-listing flexibility.
Questions for the listing agent
- What do current leases actually rent for vs. the listed asking? Can we see a recent rent roll and the last 12 months of T-12 income?
- It's been on market 111 days. Have you received any prior offers? Is the seller open to a 16% concession, seller financing, or rate buy-down credit?
- Built in 1967 — when were the roof, HVAC, electrical panel, plumbing, and water heater last replaced?
- Why hasn't it sold? Are there any deal-killer items the seller is aware of (foundation, flood, title, zoning, code violations)?
- Is there a deadline driving the sale (1031 exchange, divorce, estate, relocation)? That informs how much negotiation room exists.
- Schools are D-rated, which usually means shorter tenancies and higher turnover. Who's the typical renter profile here, and what's been the actual vacancy rate?
- The area grade is low — what's the realistic commute time and amenity access for the typical tenant pool here? Any planned neighborhood developments (good or bad) we should know about?
- What's the average days-on-market for RENTAL listings here right now (not sales)? A rising rental-DOM trend means longer vacancies and softer asking-rent achievability than the comps imply.
- What's the recent tenant-quality profile in this submarket — average credit score on applications, eviction rate, late-payment / NSF rate, and stable-employment percentage? A property-management company in the area should have these aggregated.
- How much new for-sale + rental construction is in the pipeline within 1–3 miles? Heavy new supply typically softens prices + rents 12–24 months out; constrained supply supports both.
Investment metrics
- 1% rule
- 0.84% ✗
- Cap rate
- 5.98%
- Cash-on-cash
- -1.11%
- DSCR
- 0.95
- GRM
- 9.9
CMA / ARV
- ARV (median comp)
- $1,161,566
- List price
- $380,000
- Delta
- -67.29%
- Verdict
- UNDERPRICED
- Comps
- 2 within 1.0 mi
Projected returns pro-forma
2.22% appreciation · 3.0% rent growth · sell at horizon
- IRR
- 4.1%
- Equity multiple
- 1.23×
- Total profit
- $24,058
- Equity at exit
- $154,354
- IRR
- 7.7%
- Equity multiple
- 2.08×
- Total profit
- $114,464
- Equity at exit
- $225,760
Cash invested: $106,400 (down + closing). Projections, not guarantees.
Landlord ↔ Tenant lean methodology
- Overall (STATE)
- 37 Tenant-Leaning
- State Hawaii
- 37 Tenant-Leaning · D+13
- County
- — inherits STATE
- City
- — inherits STATE
ZIP-level market 96795
- Home prices YoY
- 0.7%
- Active inventory
- 10
- Price-to-rent
- 9.9×
Monthly cashflow live
- Estimated rent
- $3,200 medium interval (Pro) →
- Mortgage (P&I)
- −$1,993
- Tax est. 1.5%
- −$475 /mo · $5,700/yr
- Insurance
- −$158
- HOA
- −$0
- Vacancy / Maint / Mgmt
- −$672
- Net cashflow
- $-98
Break-even live
UW: 25.0% down · 7.5% · 30yr · 1.5% tax · 5.0% vac · 8.0% maint · 8.0% mgmt
Financing live
Cash to close
- Down payment
- $95,000
- Closing costs
- $11,400
- Reserves months
- —
- Total cash needed
- —
Loan-product check · same deal, 3 products live
Conventional
25% down · 7.5% · 30yr
- Down + closing
- —
- Monthly P&I
- —
- Monthly cashflow
- —
- DSCR
- —
- Eligible?
- —
Personal DTI + credit; lowest rate.
DSCR
20% down · 8.5% · 30yr
- Down + closing
- —
- Monthly P&I
- —
- Monthly cashflow
- —
- DSCR
- —
- Eligible?
- —
No personal income docs; deal must DSCR.
Hard money
10% down · 12.0% · 12mo
- Down + closing
- —
- Monthly P&I
- —
- Monthly cashflow
- —
- DSCR
- —
- Eligible?
- —
Short-term bridge; refi at stabilization.
Rent comps 1 comps
| Address | Beds | Baths | Sqft | Rent | $/sqft | DOM | Units | Dist |
|---|---|---|---|---|---|---|---|---|
| 41-046 Hinalea St Waimanalo, HI | 2.0 | 1.0 | 800 | $3,200 | $4.00 | 44d | 1 | 0.85mi |
Listing history 18 events
-
2026-06-18days on market $380,000 Active 111 DOM
-
2026-06-17days on market $380,000 Active 110 DOM
-
2026-06-16days on market $380,000 Active 109 DOM
-
2026-06-15days on market $380,000 Active 108 DOM
-
2026-06-13days on market $380,000 Active 106 DOM
-
2026-06-13days on market $380,000 Active 105 DOM
-
2026-06-10days on market $380,000 Active 103 DOM
-
2026-06-09days on market $380,000 Active 102 DOM
-
2026-06-08days on market $380,000 Active 101 DOM
-
2026-06-07days on market $380,000 Active 100 DOM
-
2026-06-05days on market $380,000 Active 97 DOM
-
2026-06-03days on market $380,000 Active 96 DOM
-
2026-06-02days on market $380,000 Active 95 DOM
-
2026-06-01days on market $380,000 Active 94 DOM
-
2026-05-31days on market $380,000 Active 93 DOM
-
2026-04-14price $380,000 194-char remark
Show marketing remark (194 chars)
Hawaiian Homelands in Waimanalo- Opportunity to build your dreamhome in the country near the beach, busline & school. Purchaser must be at least 50% Hawaiian. This is a leasehold property.
-
2026-03-12price $425,000 194-char remark
Show marketing remark (194 chars)
Hawaiian Homelands in Waimanalo- Opportunity to build your dreamhome in the country near the beach, busline & school. Purchaser must be at least 50% Hawaiian. This is a leasehold property.
-
2026-02-27$550,000 Active 194-char remark
Show marketing remark (194 chars)
Hawaiian Homelands in Waimanalo- Opportunity to build your dreamhome in the country near the beach, busline & school. Purchaser must be at least 50% Hawaiian. This is a leasehold property.
ⓘ Source: listings_history table (triggers on properties + properties_extension) + one-shot
backfill from property_details.listing_events for pre-trigger history.
Climate risk First Street
- Flood 4/10 Moderate FEMA zone X (unshaded) · 22% chance over 30 yrs
- Air quality 1/10 Low
Nearby sold comps map
Loading sold comps map…
Walkable amenities ~0.75 mi
Loading nearby amenities…
Taxation est. · year 1
- Rental income
- $38,400
- − Mortgage interest
- −$21,286
- − Property taxes
- −$5,700
- − Insurance
- −$1,900
- − Repairs & maintenance
- −$3,072
- − Management
- −$3,072
- − Depreciation
- −$11,055
- Taxable loss
- −$7,684
- Est. tax savings @ 24.0%
- +$1,844
- After-tax cash flow
- $667/yr
For passive investors: Depreciation is non-cash, so a rental often shows a tax loss while cash-flowing — sheltering income. Rental losses are passive: they offset passive income freely, and up to $25,000/yr can offset ordinary (W-2) income if you actively participate and your MAGI is under $100k (phasing out to $0 by $150k); unused losses carry forward. On sale, claimed depreciation is recaptured at up to 25%, and gains may owe capital-gains tax (a 1031 exchange can defer both). Figures are a year-1 estimate at your 24.0% rate — not tax advice; consult a CPA.
Schools (NCES district)
- District
- Hawaii Department Of Education
- NCES district ID
- 1500030
- Math proficiency
- 32% ▼ -10.00%
- Reading proficiency
- 50% ▼ -3.00%
- Median HH income
- $69,005
- Composite
- 37.07/100
- National rank
- #4504
- State rank
- #1 of 1 in HI
Livability — Waimanalo Beach
- Score
- 60/100
- State rank
- #86
- US rank
- #18767
Category grades
Schools grade is shown separately in the Schools card above.
Census & demographics
- Census place
- Waimanalo Beach, HI
- Population (ZIP)
- 10,315
Population outlook (Honolulu County) Hauer SSP2
- Today (2025)
- 1,072,641 people
- By 2030
- 1,110,460 · +3.5%
- By 2040
- 1,181,593 · +10.2%
- By 2050
- 1,257,584 · +17.2%
- By 2075
- 1,501,120 · +39.9%
- By 2100
- 1,764,430 · +64.5%
Race, ethnicity, and origin ACS 2023
- Neighborhood character
- Highly diverse neighborhood (Simpson 0.96)
- Race & ethnicity
- Two or more races 46% Pacific Islander 33% Hispanic / Latino 15% Asian 10% White 9%
- Hispanic origin (detail)
- Mexican 3% Puerto Rican 7%
- Common ancestry
- Russian 5% Lithuanian 1% Portuguese 1%
- Foreign-born
- 4% · China
- Languages at home
- 88% English-only · Other Asian/Pacific 7% Spanish 2% Tagalog/Filipino 2%
Political lean MEDSL · Honolulu
- 2024 margin
- Strong D (+21.6) · D 59.9% · R 38.3% · Other 1.8%
- 2008→2024 swing
- -19.4pp toward R · 2008: 41.1pp · 2024: 21.6pp
- All cycles
- 2024: D+21.6 2020: D+26.9 2016: D+29.9 2012: D+39.1 2008: D+41.1
Not yet ingested
- Civics
- —
Market trends
- HPI YoY
- ▲ 2.22%
- Current HPI
- 335.4614
- Rent YoY
- —
- Metro
- —
- State GDP YoY
- —
- F500 in state
- 0
Price history
-30.9% since first listed3 events — show timeline
- 2026-04-14 Price Changed $380,000 HiCentral MLS
- 2026-03-12 Price Changed $425,000 HiCentral MLS
- 2026-02-27 Listed $550,000 HiCentral MLS
Property tax history
+0.0%/yrLatest (2022): $300 · +0.0% YoY. Source: county tax records.
Cash-flow waterfall
monthlySold comps — $/sqft
last 12 mo · ≤1 miLoading sold comps…