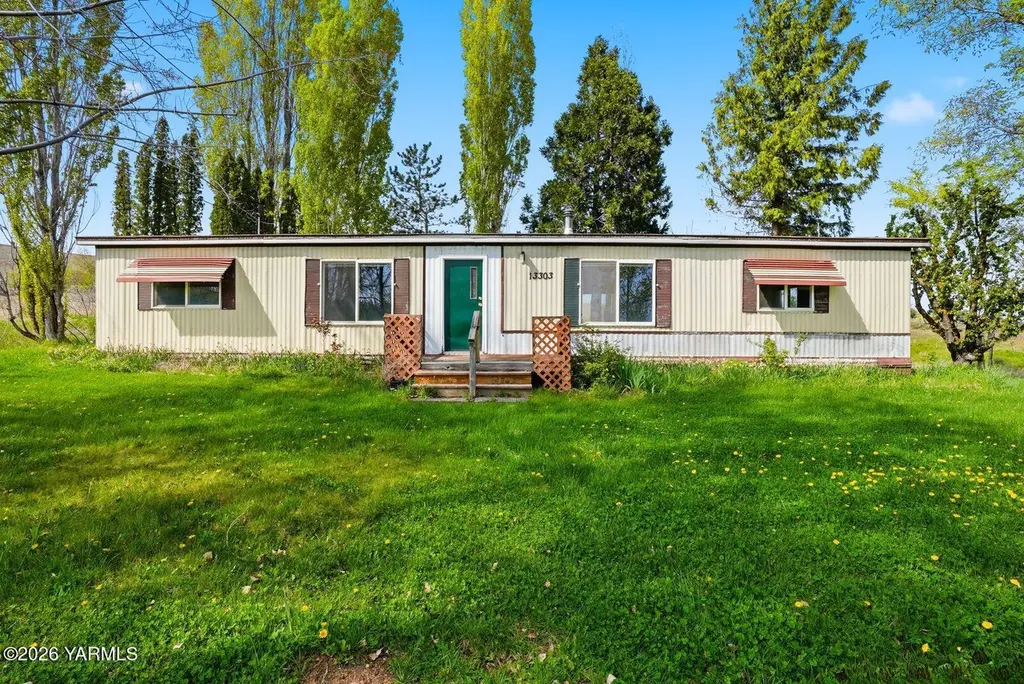
13301 Marble Rd · Summitview, WA
Flood risk 1/10 · Minimal
- FEMA flood zone
- X (unshaded)
- Chance of flooding over 30 yrs
- 0.0%
- Est. flood insurance / yr
- $507 – $1,088
Fire risk 8/10 · Major
- Est. fire insurance / yr
- $604 – $1,122
Heat risk 3/10 · Minor
- Hot days now (above 94°F)
- 7 days/yr
- Hot days in 30 yrs
- 13 days/yr
Wind risk 1/10 · Minimal
- Chance of severe wind over 30 yrs
- —
Air-quality risk 9/10 · Severe
- Unhealthy air days now
- 15 days/yr
- Unhealthy air days in 30 yrs
- 16 days/yr
Risk factors via First Street. Map © Google.
Why this score? — see what drove the D+ grade
The composite is a weighted blend of 9 inputs, each scored 0–100. Each bar is that input's sub-score; the figure is the points it added to the 100-point composite (weight × sub-score).
- Cash flow +17.8/30.0
- ARV discount +7.5/15.0
- DSCR +5.6/10.0
- Schools +5.5/10.0
- Rent growth +4.1/5.0
- 1% rule +3.6/10.0
- Livability +3.0/5.0
- Condition / age +2.5/5.0
- Appreciation +0.0/10.0
$249,000
🖨 Deal sheet 📄 Offer letter ✓ Due diligence
Listing remarks
Affordable country living with room to breathe! This home sits on a full acre, offering the peace and quiet that comes with rural life while still being just seconds from paved access. Nestled across from a picturesque orchard, the setting delivers open views, fresh air, and a true sense of escape. As you arrive, you'll appreciate the space, mature trees, and open yard--plus a ready-to-use chicken coop, perfect for those dreaming of fresh eggs and a touch of homesteading. The property also includes irrigation, adding value and flexibility for gardening or small-scale farming. Step onto the inviting front porch and into a home featuring laminate wood flooring throughout the main living areas
Key facts
- Irrigation
- Picturesque orchard
- Open yard
Tags
Property features AI
Finance
- Other: Approximately 1 acre lot
Exterior
- Parking: Off-street parking
- Utilities: Shared well water; Septic tank; Sewer connected
- Home design: Manufactured home on owned land; Single-story
- Construction: Metal siding
- Exterior features: Composition roof
Interior
- Kitchen: Range; Oven; Refrigerator
- Flooring: Carpet
- Bathrooms: 2 full bathrooms
- Heating & cooling: Central air conditioning; Wood stove heating; Electric heating; Forced air heating
- Interior features: Pantry
Neighborhood map
What this means for you Summary
Snapshot
- This is a 3-bed/2.0-bath other listed at $249k.
Deal economics
- At list price, monthly cash flow is $203 ($2k/yr) — positive.
- The deal already cash-flows at list — no discount required.
- To meet the 1% rule (rent ≥ 1% of price), the offer needs to be $213k (14.3% below list).
- Recommended offer: $213k (14.3% below list) — sets the bar for 1% rule.
- Cap rate 7.3% vs local median 2.2% in Summitview — top-decile yield for the area; either an underpriced asset or a hidden risk that comps aren't pricing in. Stress-test before assuming the spread holds.
Location & tenants
- Location reads 59/100 on livability (#485 in WA) — a working-class tenant base; expect higher turnover. Strengths: crime A+, employment B; Watch: amenities F, commute F, cost of living F.
- West Valley School District (Yakima) (urban): math 58% / reading 65% proficiency, ranked #47 of 291 in WA (top 16%) — acceptable for families but not a draw, mixed tenant base, ~2y average lease.
- Market conditions: Rents rising fast (+6.5%/yr); 326 active listings in the ZIP; solid renter incomes; 468 units permitted in Yakima County in 2024 (23 in 5+ unit buildings).
- This rent runs 30% of the median local income ($84k/yr) — at the standard rent-burdened threshold; future hikes will face affordability resistance.
Forward outlook
- Local home prices are declining (-3.0%/yr); year-one equity from $2k of loan paydown is wiped out by about $7k of value loss. Plan a longer hold.
- Yakima County population projected at +6% by 2050 — modest demand growth; plan on rents tracking national, not racing it.
Negotiation context
- Only 12 days on market — expect competitive offers; lowballing is unlikely to land.
- 2 sale attempts with the ask held roughly flat each time — persistent listings suggest the price (not the market) is what's stuck; bring a comps-based counter.
Risks & watch-outs
- Climate carrying-cost: severe wildfire risk — expect insurance premiums to compound above CPI over the hold.
Questions for the listing agent
- Built in 1979 — when were the roof, HVAC, electrical panel, plumbing, and water heater last replaced?
- Is there a deadline driving the sale (1031 exchange, divorce, estate, relocation)? That informs how much negotiation room exists.
- The area grade is low — what's the realistic commute time and amenity access for the typical tenant pool here? Any planned neighborhood developments (good or bad) we should know about?
- What's the average days-on-market for RENTAL listings here right now (not sales)? A rising rental-DOM trend means longer vacancies and softer asking-rent achievability than the comps imply.
- What's the recent tenant-quality profile in this submarket — average credit score on applications, eviction rate, late-payment / NSF rate, and stable-employment percentage? A property-management company in the area should have these aggregated.
- How much new for-sale + rental construction is in the pipeline within 1–3 miles? Heavy new supply typically softens prices + rents 12–24 months out; constrained supply supports both.
Investment metrics
- 1% rule
- 0.86% ✗
- Cap rate
- 7.27%
- Cash-on-cash
- 3.49%
- DSCR
- 1.16
- GRM
- 9.7
CMA / ARV
No comps found within radius.
Projected returns pro-forma
-3.0% appreciation · 6.45% rent growth · sell at horizon
- IRR
- -7.5%
- Equity multiple
- 0.71×
- Total profit
- $-19,873
- Equity at exit
- $37,127
- IRR
- 5.6%
- Equity multiple
- 1.47×
- Total profit
- $32,642
- Equity at exit
- $21,529
Cash invested: $69,720 (down + closing). Projections, not guarantees.
Landlord ↔ Tenant lean methodology
- Overall (STATE)
- 28 Tenant-Leaning
- State Washington
- 28 Tenant-Leaning · D+8
- County
- — inherits STATE
- City
- — inherits STATE
ZIP-level market 98908
- Rents YoY
- 6.5%
- Active inventory
- 326
- Price-to-rent
- 9.7×
Monthly cashflow live
- Estimated rent
- $2,134 medium interval (Pro) →
- Mortgage (P&I)
- −$1,306
- Tax from tax record
- −$74 /mo · $882/yr
- Insurance
- −$104
- HOA
- −$0
- Vacancy / Maint / Mgmt
- −$448
- Net cashflow
- $203
Break-even live
UW: 25.0% down · 7.5% · 30yr · 1.5% tax · 5.0% vac · 8.0% maint · 8.0% mgmt
Financing live
Cash to close
- Down payment
- $62,250
- Closing costs
- $7,470
- Reserves months
- —
- Total cash needed
- —
Loan-product check · same deal, 3 products live
Conventional
25% down · 7.5% · 30yr
- Down + closing
- —
- Monthly P&I
- —
- Monthly cashflow
- —
- DSCR
- —
- Eligible?
- —
Personal DTI + credit; lowest rate.
DSCR
20% down · 8.5% · 30yr
- Down + closing
- —
- Monthly P&I
- —
- Monthly cashflow
- —
- DSCR
- —
- Eligible?
- —
No personal income docs; deal must DSCR.
Hard money
10% down · 12.0% · 12mo
- Down + closing
- —
- Monthly P&I
- —
- Monthly cashflow
- —
- DSCR
- —
- Eligible?
- —
Short-term bridge; refi at stabilization.
Listing history 4 events
-
2026-05-13status Pending
-
2026-05-09status Active
-
2026-04-29status Pending
-
2026-04-21$249,000 Active
ⓘ Source: listings_history table (triggers on properties + properties_extension) + one-shot
backfill from property_details.listing_events for pre-trigger history.
Tax reassessment forecast WA · Resets to sale price
- Current annual tax
- $882 · $74/mo
- Projected year-2 tax
- $2,440 · $203/mo
- Expected delta
- +$1,558/yr (+$130/mo · 176.6%)
ⓘ Screening estimate from a state-policy table — verify with the county assessor before closing.
Climate risk First Street
- Flood 1/10 Low FEMA zone X (unshaded) · 0% chance over 30 yrs
- Wildfire 8/10 Severe
- Heat 3/10 Moderate 7 d/yr ≥94°F today · 13 d/yr by 30 yrs out
- Wind 1/10 Low
- Air quality 9/10 Extreme 15 unhealthy d/yr today · 16 by 30 yrs out
Nearby sold comps map
Loading sold comps map…
Walkable amenities ~0.75 mi
Loading nearby amenities…
Taxation est. · year 1
- Rental income
- $25,610
- − Mortgage interest
- −$13,948
- − Property taxes
- −$882
- − Insurance
- −$1,245
- − Repairs & maintenance
- −$2,049
- − Management
- −$2,049
- − Depreciation
- −$7,244
- Taxable loss
- −$1,806
- Est. tax savings @ 24.0%
- +$434
- After-tax cash flow
- $2,869/yr
For passive investors: Depreciation is non-cash, so a rental often shows a tax loss while cash-flowing — sheltering income. Rental losses are passive: they offset passive income freely, and up to $25,000/yr can offset ordinary (W-2) income if you actively participate and your MAGI is under $100k (phasing out to $0 by $150k); unused losses carry forward. On sale, claimed depreciation is recaptured at up to 25%, and gains may owe capital-gains tax (a 1031 exchange can defer both). Figures are a year-1 estimate at your 24.0% rate — not tax advice; consult a CPA.
Schools (NCES district)
- District
- West Valley School District (Yakima)
- NCES district ID
- 5309720
- Math proficiency
- 58% ▼ -1.00%
- Reading proficiency
- 65% ▼ -1.00%
- Median HH income
- $61,876
- Composite
- 54.99/100
- National rank
- #2784
- State rank
- #47 of 291 in WA
Livability — Summitview
- Score
- 59/100
- State rank
- #485
- US rank
- #20127
Category grades
Schools grade is shown separately in the Schools card above.
Census & demographics
- County
- Yakima County · 134,789 people
- Metro
- Yakima, WA
- Population (ZIP)
- 38,060
- Household income
- $84,197
- Rent vs Own
- Severe rent burden
- 1265.0
Population outlook (Yakima County) Hauer SSP2
- Today (2025)
- 256,514 people
- By 2030
- 259,403 · +1.1%
- By 2040
- 265,677 · +3.6%
- By 2050
- 273,061 · +6.5%
- By 2075
- 296,991 · +15.8%
- By 2100
- 315,291 · +22.9%
Race, ethnicity, and origin ACS 2023
- Neighborhood character
- Predominantly White (68%)
- Race & ethnicity
- White 68% Hispanic / Latino 24% Two or more races 12% Asian 2%
- Hispanic origin (detail)
- Mexican 22%
- Common ancestry
- Portuguese 4% Italian 3% Lithuanian 2%
- Foreign-born
- 7% · Canada, China, South Korea
- Languages at home
- 82% English-only · Spanish 16% German/W. Germanic 1%
Political lean MEDSL · Yakima
- 2024 margin
- R (+14.3) · D 41.6% · R 55.9% · Other 2.5%
- 2008→2024 swing
- -3.8pp toward R · 2008: -10.6pp · 2024: -14.3pp
- All cycles
- 2024: R+14.3 2020: R+7.7 2016: R+15.4 2012: R+15.1 2008: R+10.6
Not yet ingested
- Civics
- —
Market trends
- HPI YoY
- ▼ -337.28%
- Current HPI
- 258.8688
- Rent YoY
- ▲ 6.45%
- Metro
- Yakima, WA
- State GDP YoY
- ▲ 4.65%
- F500 in state
- 22
Industry mix (Fortune 500 HQ in WA)
| Industry | F500 HQs | Revenue |
|---|---|---|
| Retail | 2 | $269B |
|
||
| Technology / Retail | 1 | $638B |
|
||
| Technology | 1 | $245B |
|
||
| Telecommunications | 1 | $38B |
|
||
| Food / Beverage | 1 | $36B |
|
||
| Automotive / Trucks | 1 | $34B |
|
||
Price history
4 events — show timeline
- 2026-05-13 Pending — YAMLS
- 2026-05-09 Relisted — YAMLS
- 2026-04-29 Pending — YAMLS
- 2026-04-21 Listed $249,000 YAMLS
Property tax history
+5.5%/yrLatest (2026): $882 · -7.8% YoY. Source: county tax records.
Cash-flow waterfall
monthlySold comps — $/sqft
last 12 mo · ≤1 miLoading sold comps…