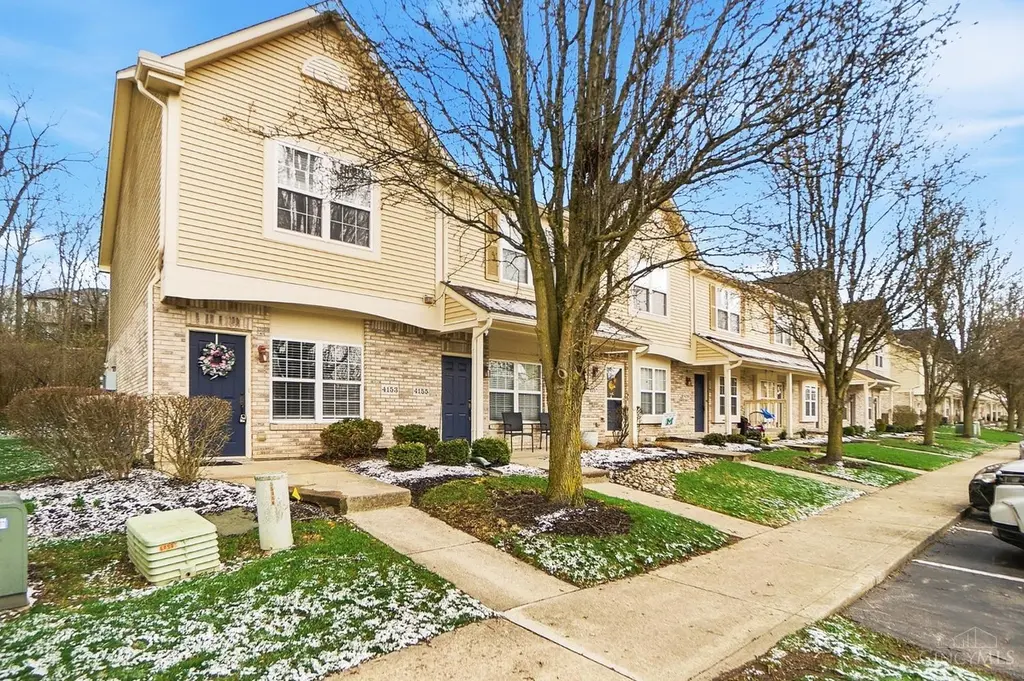
4153 Spyglass Hl · Mason, OH
Flood risk 8/10 · Major
- FEMA flood zone
- X (unshaded)
- Chance of flooding over 30 yrs
- 0.99%
- Est. flood insurance / yr
- $507 – $1,088
Fire risk 1/10 · Minimal
- Est. fire insurance / yr
- $713 – $1,323
Heat risk 4/10 · Minor
- Hot days now (above 103°F)
- 7 days/yr
- Hot days in 30 yrs
- 19 days/yr
Wind risk 2/10 · Minimal
- Chance of severe wind over 30 yrs
- 1.0%
Air-quality risk 4/10 · Minor
- Unhealthy air days now
- 5 days/yr
- Unhealthy air days in 30 yrs
- 6 days/yr
Risk factors via First Street. Map © Google.
Why this score? — see what drove the D grade
The composite is a weighted blend of 9 inputs, each scored 0–100. Each bar is that input's sub-score; the figure is the points it added to the 100-point composite (weight × sub-score).
- Cash flow +9.8/30.0
- ARV discount +7.5/15.0
- Schools +7.2/10.0
- Livability +4.2/5.0
- Rent growth +3.4/5.0
- 1% rule +3.3/10.0
- DSCR +2.8/10.0
- Condition / age +2.5/5.0
- Appreciation +0.0/10.0
$254,900
🖨 Deal sheet 📄 Offer letter ✓ Due diligence
Listing remarks MLS
Updated Mason Townhome, 2 Beds, 1.5 Baths, 1-Car Garage! Rentals allowed! Beautifully updated with fresh paint, new carpet, and LVP flooring (Nov 2025). Spacious great room with dining area, and an eat-in kitchen featuring new refrigerator (Dec 2025), oven/range, microwave, and dishwasher, plus a walkout to a covered patio. Additional storage room included. Primary suite boasts a vaulted ceiling and big closet. Large bathroom with double vanities, tub/shower, linen closet, and tile floors. New windows being installed in both bedrooms. Enjoy a pool community with low HOA of $170/month. Prime location near I-71, Kings Island, shopping, and dining.
Key facts
- Fresh paint
- Spacious great room
- New carpet
Tags
Neighborhood map
What this means for you Summary
Snapshot
- This is a 2-bed/1.5-bath condo listed at $255k.
Deal economics
- At list price, monthly cash flow is $-227 ($-3k/yr) — negative.
- To cash-flow at today's rent, offer at most $215k (15.8% below list).
- To meet the 1% rule (rent ≥ 1% of price), the offer needs to be $210k (17.4% below list).
- Recommended offer: $210k (17.4% below list) — sets the bar for 1% rule.
- Cap rate 5.5% vs local median 3.1% in Mason — top-decile yield for the area; either an underpriced asset or a hidden risk that comps aren't pricing in. Stress-test before assuming the spread holds.
Location & tenants
- Location reads 85/100 on livability (#43 in OH, #590 nationally) — a professional / high-income tenant draw. Strengths: schools A+, crime A+, employment A+; Watch: health & safety C-, commute F.
- Mason City (suburban): math 81% / reading 81% proficiency, ranked #33 of 656 in OH (top 5%) — strong family-tenant draw, lease renewals of 3-5y typical; only 6% free/reduced lunch — higher-income household profile.
- Market conditions: Rents rising (+3.5%/yr); 141 active listings in the ZIP; 6 comparable units currently listed for rent nearby; rentals leasing fast (median 11d on market — plan ~1-2 weeks tenant-placement turnaround); high-income renter base; 1,224 units permitted in Warren County in 2024 (474 in 5+ unit buildings).
Forward outlook
- Local home prices are declining (-3.0%/yr); year-one equity from $2k of loan paydown is wiped out by about $8k of value loss. Plan a longer hold.
- Warren County population projected at +16% by 2050 — long-run rental-demand tailwind backs the buy-and-hold thesis.
Negotiation context
- It's been on market 76 days — a 6% lower offer ($240k) is reasonable based on typical stale-listing flexibility.
- 8 sale attempts since 23y ago with the ask held roughly flat each time — persistent listings suggest the price (not the market) is what's stuck; bring a comps-based counter.
- Current owner paid $83k; list at $255k implies a 207% gain — meaningful room to come down on a strong offer.
Risks & watch-outs
- Watch-outs: flood insurance adds $66/mo.
- Climate carrying-cost: severe flood risk — expect insurance premiums to compound above CPI over the hold.
Questions for the listing agent
- What do current leases actually rent for vs. the listed asking? Can we see a recent rent roll and the last 12 months of T-12 income?
- It's been on market 76 days. Have you received any prior offers? Is the seller open to a 17% concession, seller financing, or rate buy-down credit?
- What's the actual annual flood-insurance premium (NFIP or private), and is the property in a SFHA with mandatory coverage?
- What does the HOA fee cover, when was the last increase, and are there any pending special assessments or reserve-fund shortfalls?
- Any open or pending special assessments — roof, HVAC, plumbing, elevator, façade? What's the per-unit balance and payoff schedule, and is the seller paying it off at close or rolling it to the buyer?
- Why hasn't it sold? Are there any deal-killer items the seller is aware of (foundation, flood, title, zoning, code violations)?
- Is there a deadline driving the sale (1031 exchange, divorce, estate, relocation)? That informs how much negotiation room exists.
- Schools are A-rated — typically a magnet for longer-tenancy family renters. What's the average tenant stay here, and is there a school-zone premium baked into asking?
- The area grade is low — what's the realistic commute time and amenity access for the typical tenant pool here? Any planned neighborhood developments (good or bad) we should know about?
- What's the average days-on-market for RENTAL listings here right now (not sales)? A rising rental-DOM trend means longer vacancies and softer asking-rent achievability than the comps imply.
- What's the recent tenant-quality profile in this submarket — average credit score on applications, eviction rate, late-payment / NSF rate, and stable-employment percentage? A property-management company in the area should have these aggregated.
- How much new apartment / multifamily construction is in the pipeline within 1–3 miles? Heavy new supply (>2% of stock underway) typically softens rents 12–24 months out; light construction supports rent growth.
Investment metrics
- 1% rule
- 0.83% ✗
- Cap rate
- 5.53%
- Cash-on-cash
- -2.71%
- DSCR
- 0.88
- GRM
- 10.1
CMA / ARV
No comps found within radius.
Projected returns pro-forma
-3.0% appreciation · 3.51% rent growth · sell at horizon
- IRR
- -22.1%
- Equity multiple
- 0.24×
- Total profit
- $-54,597
- Equity at exit
- $38,006
- IRR
- -14.6%
- Equity multiple
- 0.14×
- Total profit
- $-61,247
- Equity at exit
- $22,039
Cash invested: $71,372 (down + closing). Projections, not guarantees.
Landlord ↔ Tenant lean methodology
- Overall (STATE)
- 73 Landlord-Friendly
- State Ohio
- 73 Landlord-Friendly · R+6
- County
- — inherits STATE
- City
- — inherits STATE
ZIP-level market 45040
- Rents YoY
- 3.5%
- Active inventory
- 141
- Price-to-rent
- 10.1×
Monthly cashflow live
- Estimated rent
- $2,105 high interval (Pro) →
- Mortgage (P&I)
- −$1,337
- Tax from tax record
- −$211 /mo · $2,530/yr
- Insurance
- −$106
- Flood insurance flood zone
- −$66 /mo · $798/yr
- HOA
- −$170
- Vacancy / Maint / Mgmt
- −$442
- Net cashflow
- $-227
Break-even live
UW: 25.0% down · 7.5% · 30yr · 1.5% tax · 5.0% vac · 8.0% maint · 8.0% mgmt
Financing live
Cash to close
- Down payment
- $63,725
- Closing costs
- $7,647
- Reserves months
- —
- Total cash needed
- —
Loan-product check · same deal, 3 products live
Conventional
25% down · 7.5% · 30yr
- Down + closing
- —
- Monthly P&I
- —
- Monthly cashflow
- —
- DSCR
- —
- Eligible?
- —
Personal DTI + credit; lowest rate.
DSCR
20% down · 8.5% · 30yr
- Down + closing
- —
- Monthly P&I
- —
- Monthly cashflow
- —
- DSCR
- —
- Eligible?
- —
No personal income docs; deal must DSCR.
Hard money
10% down · 12.0% · 12mo
- Down + closing
- —
- Monthly P&I
- —
- Monthly cashflow
- —
- DSCR
- —
- Eligible?
- —
Short-term bridge; refi at stabilization.
Rent comps 6 comps
| Address | Beds | Baths | Sqft | Rent | $/sqft | DOM | Units | Dist |
|---|---|---|---|---|---|---|---|---|
| 4150 Spanish Bay Dr Mason, OH | 2.0 | 1.5 | 1208 | $1,825 | $1.51 | 10d | 1 | 0.06mi |
| 4114 Spanish Bay Dr Mason, OH | 2.0 | 1.5 | 1144 | $2,995 | $2.62 | 1d | 1 | 0.09mi |
| 4068 Spanish Bay Dr Mason, OH | 2.0 | 1.5 | 1144 | $1,700 | $1.49 | 10d | 1 | 0.15mi |
| 400 Sherwood Green Ct Mason, OH | 2.0 | 2.0 | 1200 | $1,700 | $1.42 | 16d | 1 | 0.66mi |
| 512 Glencoe Ct Mason, OH | 2.0 | 1.5 | 1336 | $1,790 | $1.34 | 10d | 1 | 0.85mi |
| 4676 Court Yard Dr Mason, OH | 2.0 | 2.0 | 1232 | $2,050 | $1.66 | 43d | 1 | 0.98mi |
HOA detail condo
- Monthly dues
- $170 · $2,040/yr
- Likely covers
- pool
- Assessments
- None detected in remarks — confirm with the listing agent.
Listing history 22 events
-
2026-06-03days on market $254,900 Active 76 DOM
-
2026-06-02days on market $254,900 Active 75 DOM
-
2026-06-01days on market $254,900 Active 74 DOM
-
2026-05-31days on market $254,900 Active 73 DOM
-
2026-04-23price $254,900 656-char remark
Show marketing remark (656 chars)
Updated Mason Townhome, 2 Beds, 1.5 Baths, 1-Car Garage! Rentals allowed! Beautifully updated with fresh paint, new carpet, and LVP flooring (Nov 2025). Spacious great room with dining area, and an eat-in kitchen featuring new refrigerator (Dec 2025), oven/range, microwave, and dishwasher, plus a walkout to a covered patio. Additional storage room included. Primary suite boasts a vaulted ceiling and big closet. Large bathroom with double vanities, tub/shower, linen closet, and tile floors. New windows being installed in both bedrooms. Enjoy a pool community with low HOA of $170/month. Prime location near I-71, Kings Island, shopping, and dining.
-
2026-03-19$259,900 Active 656-char remark
Show marketing remark (656 chars)
Updated Mason Townhome, 2 Beds, 1.5 Baths, 1-Car Garage! Rentals allowed! Beautifully updated with fresh paint, new carpet, and LVP flooring (Nov 2025). Spacious great room with dining area, and an eat-in kitchen featuring new refrigerator (Dec 2025), oven/range, microwave, and dishwasher, plus a walkout to a covered patio. Additional storage room included. Primary suite boasts a vaulted ceiling and big closet. Large bathroom with double vanities, tub/shower, linen closet, and tile floors. New windows being installed in both bedrooms. Enjoy a pool community with low HOA of $170/month. Prime location near I-71, Kings Island, shopping, and dining.
-
2012-10-08soldstatus $83,000
-
2012-09-28soldstatus $83,000 179-char remark
Show marketing remark (179 chars)
This end unit has an open floor plan & full equipped kitchen. Patio overlooks wooded area. Garage directly across from unit. Community lake & pool. Storage area off patio.
-
2012-02-20$90,000 179-char remark
Show marketing remark (179 chars)
This end unit has an open floor plan & full equipped kitchen. Patio overlooks wooded area. Garage directly across from unit. Community lake & pool. Storage area off patio.
-
2009-07-10historical
-
2009-01-14$116,900
-
2009-01-01historical
-
2008-08-15$119,900
-
2008-08-15historical
-
2008-02-18$119,900
-
2006-07-03soldstatus $113,900
-
2006-06-26soldstatus $113,900
-
2006-03-06$113,900
-
2004-11-09historical
-
2004-07-08$127,500
-
2004-02-16historical
-
2003-11-11$131,900
ⓘ Source: listings_history table (triggers on properties + properties_extension) + one-shot
backfill from property_details.listing_events for pre-trigger history.
Tax reassessment forecast OH · Partial reset (capped growth)
- Current annual tax
- $2,530 · $211/mo
- Projected year-2 tax
- $3,253 · $271/mo
- Expected delta
- +$723/yr (+$60/mo · 28.6%)
ⓘ Screening estimate from a state-policy table — verify with the county assessor before closing.
Climate risk First Street
- Flood 8/10 Severe FEMA zone X (unshaded) · 99% chance over 30 yrs
- Wildfire 1/10 Low
- Heat 4/10 Moderate 7 d/yr ≥103°F today · 19 d/yr by 30 yrs out
- Wind 2/10 Low 100% chance of damaging wind over 30 yrs
- Air quality 4/10 Moderate 5 unhealthy d/yr today · 6 by 30 yrs out
Nearby sold comps map
Loading sold comps map…
Walkable amenities ~0.75 mi
Loading nearby amenities…
Taxation est. · year 1
- Rental income
- $25,256
- − Mortgage interest
- −$14,278
- − Property taxes
- −$2,530
- − Insurance
- −$2,072
- − Repairs & maintenance
- −$2,021
- − Management
- −$2,021
- − HOA
- −$2,040
- − Depreciation
- −$7,415
- Taxable loss
- −$7,120
- Est. tax savings @ 24.0%
- +$1,709
- After-tax cash flow
- $-1,021/yr
For passive investors: Depreciation is non-cash, so a rental often shows a tax loss while cash-flowing — sheltering income. Rental losses are passive: they offset passive income freely, and up to $25,000/yr can offset ordinary (W-2) income if you actively participate and your MAGI is under $100k (phasing out to $0 by $150k); unused losses carry forward. On sale, claimed depreciation is recaptured at up to 25%, and gains may owe capital-gains tax (a 1031 exchange can defer both). Figures are a year-1 estimate at your 24.0% rate — not tax advice; consult a CPA.
Schools (NCES district)
- District
- Mason City
- NCES district ID
- 3905045
- Math proficiency
- 81% ▼ -8.00%
- Reading proficiency
- 81% ▼ -5.00%
- Median HH income
- $91,430
- Composite
- 72.46/100
- National rank
- #200
- State rank
- #33 of 656 in OH
Livability — Mason
- Score
- 85/100
- State rank
- #43
- US rank
- #590
Category grades
Schools grade is shown separately in the Schools card above.
Census & demographics
- Census place
- Mason, OH
- County
- Warren County · 196,906 people
- City population
- 59,518
- Metro
- Cincinnati, OH-KY-IN
- Population (ZIP)
- 59,518
- Household income
- $133,240
- Rent vs Own
- Severe rent burden
- 562.0
Population outlook (Warren County) Hauer SSP2
- Today (2025)
- 248,603 people
- By 2030
- 259,345 · +4.3%
- By 2040
- 277,666 · +11.7%
- By 2050
- 289,599 · +16.5%
- By 2075
- 311,681 · +25.4%
- By 2100
- 302,738 · +21.8%
Race, ethnicity, and origin ACS 2023
- Neighborhood character
- Predominantly White (70%)
- Race & ethnicity
- White 70% Asian 19% Two or more races 6% Black 4% Hispanic / Latino 3%
- Common ancestry
- Romanian 2% Slovak 2% Lithuanian 1%
- Foreign-born
- 20% · China, Canada, Vietnam
- Languages at home
- 77% English-only · Other Asian/Pacific 6% Other Indo-European 6% Chinese 4%
Political lean MEDSL · Warren
- 2024 margin
- Solid R (+31.5) · D 33.8% · R 65.3%
- 2008→2024 swing
- +4.5pp toward D · 2008: -36.1pp · 2024: -31.5pp
- All cycles
- 2024: R+31.5 2020: R+30.8 2016: R+37.6 2012: R+39.5 2008: R+36.1
Not yet ingested
- Civics
- —
Market trends
- HPI YoY
- ▼ -210.08%
- Current HPI
- 234.0754
- Rent YoY
- ▲ 3.51%
- Metro
- Cincinnati, OH-KY-IN
- State GDP YoY
- ▲ 1.98%
- F500 in state
- 48
Industry mix (Fortune 500 HQ in OH)
| Industry | F500 HQs | Revenue |
|---|---|---|
| Insurance | 3 | $145B |
|
||
| Industrial Machinery | 3 | $49B |
|
||
| Financial Services | 3 | $24B |
|
||
| Consumer Goods | 2 | $93B |
|
||
| Aerospace / Defense | 2 | $47B |
|
||
| Utilities | 2 | $33B |
|
||
Price history
+93.3% since first listed18 events — show timeline
- 2026-04-23 Price Changed $254,900 Cincy MLS
- 2026-03-19 Listed $259,900 Cincy MLS
- 2012-10-08 Sold (Public Records) $83,000 Public Records
- 2012-09-28 Sold (MLS) $83,000 Cincy MLS
- 2012-02-20 Listed $90,000 Cincy MLS
- 2009-07-10 Listing Removed — Cincy MLS
- 2009-01-14 Listed $116,900 Cincy MLS
- 2009-01-01 Listing Removed — Cincy MLS
- 2008-08-15 Listing Removed — Cincy MLS
- 2008-08-15 Listed $119,900 Cincy MLS
- 2008-02-18 Listed $119,900 Cincy MLS
- 2006-07-03 Sold (Public Records) $113,900 Public Records
- 2006-06-26 Sold (MLS) $113,900 Cincy MLS
- 2006-03-06 Listed $113,900 Cincy MLS
- 2004-11-09 Listing Removed — Cincy MLS
- 2004-07-08 Listed $127,500 Cincy MLS
- 2004-02-16 Listing Removed — Cincy MLS
- 2003-11-11 Listed $131,900 Cincy MLS
Property tax history
+2.8%/yrLatest (2025): $2,530 · -0.5% YoY. Source: county tax records.
Cash-flow waterfall
monthlySold comps — $/sqft
last 12 mo · ≤1 miLoading sold comps…