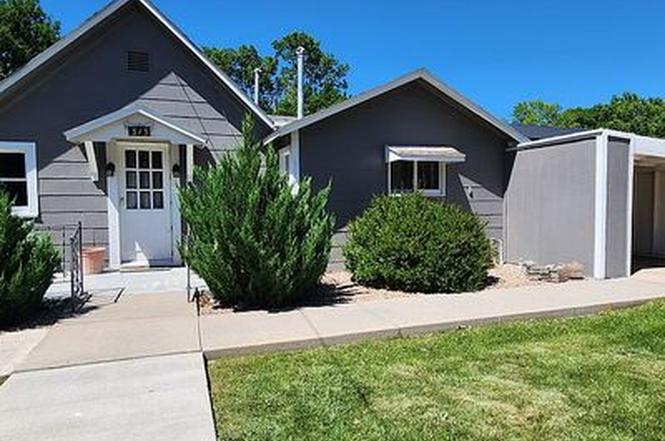
313 E Fletcher St · Haxtun, CO
Flood risk 7/10 · Major
- FEMA flood zone
- —
- Chance of flooding over 30 yrs
- 0.99%
- Est. flood insurance / yr
- —
Fire risk 4/10 · Minor
- Est. fire insurance / yr
- $939 – $1,743
Heat risk 3/10 · Minor
- Hot days now (above 96°F)
- 7 days/yr
- Hot days in 30 yrs
- 17 days/yr
Wind risk 2/10 · Minimal
- Chance of severe wind over 30 yrs
- —
Air-quality risk 1/10 · Minimal
- Unhealthy air days now
- 0 days/yr
- Unhealthy air days in 30 yrs
- 0 days/yr
Risk factors via First Street. Map © Google.
Why this score? — see what drove the D grade
The composite is a weighted blend of 9 inputs, each scored 0–100. Each bar is that input's sub-score; the figure is the points it added to the 100-point composite (weight × sub-score).
- Cash flow +13.1/30.0
- ARV discount +7.5/15.0
- Appreciation +4.2/10.0
- DSCR +3.9/10.0
- Livability +3.7/5.0
- Schools +2.8/10.0
- 1% rule +2.7/10.0
- Rent growth +2.5/5.0
- Condition / age +2.5/5.0
$110,000
🖨 Deal sheet (PDF) 📄 Offer letter ✓ Due diligence
Listing remarks MLS
Wonderful Condition!!! Extra large 1 bedroom with a large bathroom and living room. New Carpet, Paint and Light fixtures. Sprinkler system, fenced back yard & carport. Handicap Accessible. A Must See!
Key facts
- Built 1940
- Listed 6 days
Neighborhood map
What this means for you Summary
Snapshot
- This is a 2-bed/1.0-bath single-family listed at $110k.
Deal economics
- At list price, monthly cash flow is $-3 ($-41/yr) — negative.
- To cash-flow at today's rent, offer at most $109k (0.6% below list).
- To meet the 1% rule (rent ≥ 1% of price), the offer needs to be $85k (23.0% below list).
- Recommended offer: $85k (23.0% below list) — sets the bar for 1% rule.
Location & tenants
- Location reads 74/100 on livability (#37 in CO, #4,551 nationally) — a middle-class / working-renter tenant base. Strengths: crime A+, cost of living A+, housing A+; Watch: employment C-, amenities F, commute F.
- Haxtun School District No. Re-2J (rural): math 25% / reading 35% proficiency, ranked #109 of 176 in CO (top 62%) — families likely to look elsewhere, expect single-tenant / working-renter base with shorter leases.
- Zoned schools: Haxtun Elementary School (reading 24%, 176 students, 30% FRL); Haxtun Jr/Sr High School (math 30% / reading 30%, grade F, #231 of 381 statewide, top 61%, 158 students, 26% FRL) — zoned schools at 28% FRL track the district average.
- Market conditions: 17 active listings in the ZIP; 6 units permitted in Phillips County in 2024 (0 in 5+ unit buildings).
Forward outlook
- Local home prices are declining (-1.6%/yr); year-one equity from $761 of loan paydown is wiped out by about $2k of value loss. Plan a longer hold.
- Phillips County population projected at -20% by 2050 — secular population decline; favor cash flow + early exit over multi-decade hold.
Negotiation context
- Only 7 days on market — expect competitive offers; lowballing is unlikely to land.
- 3 sale attempts since 17y ago with the ask held roughly flat each time — persistent listings suggest the price (not the market) is what's stuck; bring a comps-based counter.
- Current owner paid $44k; list at $110k implies a 150% gain — meaningful room to come down on a strong offer.
Risks & watch-outs
- Watch-outs: built in 1940 — expect roof / HVAC / electrical / plumbing capex.
- Climate carrying-cost: major flood risk — expect insurance premiums to compound above CPI over the hold.
Questions for the listing agent
- What do current leases actually rent for vs. the listed asking? Can we see a recent rent roll and the last 12 months of T-12 income?
- Built in 1940 — when were the roof, HVAC, electrical panel, plumbing, and water heater last replaced?
- Is there a deadline driving the sale (1031 exchange, divorce, estate, relocation)? That informs how much negotiation room exists.
- Schools are D-rated, which usually means shorter tenancies and higher turnover. Who's the typical renter profile here, and what's been the actual vacancy rate?
- The area grade is low — what's the realistic commute time and amenity access for the typical tenant pool here? Any planned neighborhood developments (good or bad) we should know about?
- What's the average days-on-market for RENTAL listings here right now (not sales)? A rising rental-DOM trend means longer vacancies and softer asking-rent achievability than the comps imply.
- What's the recent tenant-quality profile in this submarket — average credit score on applications, eviction rate, late-payment / NSF rate, and stable-employment percentage? A property-management company in the area should have these aggregated.
- How much new for-sale + rental construction is in the pipeline within 1–3 miles? Heavy new supply typically softens prices + rents 12–24 months out; constrained supply supports both.
Investment metrics
- 1% rule
- 0.77% ✗
- Cap rate
- 6.26%
- Cash-on-cash
- -0.13%
- DSCR
- 0.99
- GRM
- 10.8
CMA / ARV
No comps found within radius.
Projected returns pro-forma
-1.56% appreciation · 3.0% rent growth · sell at horizon
- IRR
- -8.9%
- Equity multiple
- 0.63×
- Total profit
- $-11,295
- Equity at exit
- $23,624
- IRR
- -1.6%
- Equity multiple
- 0.87×
- Total profit
- $-4,089
- Equity at exit
- $22,390
Cash invested: $30,800 (down + closing). Projections, not guarantees.
Landlord ↔ Tenant lean methodology
- Overall (STATE)
- 38 Tenant-Leaning
- State Colorado
- 38 Tenant-Leaning · D+4
- County
- — inherits STATE
- City
- — inherits STATE
ZIP-level market 80731
- Home prices YoY
- -0.6%
- Active inventory
- 17
- Price-to-rent
- 10.8×
Monthly cashflow live
- Estimated rent
- $847 medium interval (Pro) →
- Mortgage (P&I)
- −$577
- Tax from tax record
- −$50 /mo · $599/yr
- Insurance
- −$46
- HOA
- −$0
- Vacancy / Maint / Mgmt
- −$178
- Net cashflow
- $-3
Break-even live
Sensitivity live
| Price | -10% $59 | -5% $28 | +0% $-3 | +5% $-35 | +10% $-66 |
|---|---|---|---|---|---|
| Rent | -10% $-70 | -5% $-37 | +0% $-3 | +5% $30 | +10% $63 |
| Rate | -1.0pp $52 | -0.5pp $25 | base $-3 | +0.5pp $-32 | +1.0pp $-61 |
UW: 25.0% down · 7.5% · 30yr · 1.5% tax · 5.0% vac · 8.0% maint · 8.0% mgmt
Financing live
Cash to close
- Down payment
- $27,500
- Closing costs
- $3,300
- Reserves months
- —
- Total cash needed
- —
Loan-product check · same deal, 3 products live
Conventional
25% down · 7.5% · 30yr
- Down + closing
- —
- Monthly P&I
- —
- Monthly cashflow
- —
- DSCR
- —
- Eligible?
- —
Personal DTI + credit; lowest rate.
DSCR
20% down · 8.5% · 30yr
- Down + closing
- —
- Monthly P&I
- —
- Monthly cashflow
- —
- DSCR
- —
- Eligible?
- —
No personal income docs; deal must DSCR.
Hard money
10% down · 12.0% · 12mo
- Down + closing
- —
- Monthly P&I
- —
- Monthly cashflow
- —
- DSCR
- —
- Eligible?
- —
Short-term bridge; refi at stabilization.
Listing history 7 events
-
2026-06-22days on market $110,000 Active 7 DOM
-
2026-06-21days on market $110,000 Active 6 DOM
-
2026-06-21days on market $110,000 Active 5 DOM
-
2026-06-18days on market $110,000 Active 3 DOM
-
2026-06-17days on market $110,000 Active 2 DOM
-
2026-06-16remarks 534-char remark
-
2026-06-16$110,000 Active 1 DOM
ⓘ Source: listings_history table (triggers on properties + properties_extension) + one-shot
backfill from property_details.listing_events for pre-trigger history.
Tax reassessment forecast CO · Resets to sale price
- Current annual tax
- $599 · $50/mo
- Projected year-2 tax
- $605 · $50/mo
- Expected delta
- +$6/yr ($0/mo · 1.0%)
ⓘ Screening estimate from a state-policy table — verify with the county assessor before closing.
Climate risk First Street
- Flood 7/10 Severe 99% chance over 30 yrs
- Wildfire 4/10 Moderate
- Heat 3/10 Moderate 7 d/yr ≥96°F today · 17 d/yr by 30 yrs out
- Wind 2/10 Low
- Air quality 1/10 Low 0 unhealthy d/yr today · 0 by 30 yrs out
Nearby sold comps map
Loading sold comps map…
Walkable amenities ~0.75 mi
Loading nearby amenities…
Taxation est. · year 1
- Rental income
- $10,165
- − Mortgage interest
- −$6,162
- − Property taxes
- −$599
- − Insurance
- −$550
- − Repairs & maintenance
- −$813
- − Management
- −$813
- − Depreciation
- −$3,200
- Taxable loss
- −$1,972
- Est. tax savings @ 24.0%
- +$473
- After-tax cash flow
- $432/yr
For passive investors: Depreciation is non-cash, so a rental often shows a tax loss while cash-flowing — sheltering income. Rental losses are passive: they offset passive income freely, and up to $25,000/yr can offset ordinary (W-2) income if you actively participate and your MAGI is under $100k (phasing out to $0 by $150k); unused losses carry forward. On sale, claimed depreciation is recaptured at up to 25%, and gains may owe capital-gains tax (a 1031 exchange can defer both). Figures are a year-1 estimate at your 24.0% rate — not tax advice; consult a CPA.
Schools (NCES district)
- District
- Haxtun School District No. Re-2J
- NCES district ID
- 0804560
- Math proficiency
- 25% ▼ -5.00%
- Reading proficiency
- 35% ▬ 0.00%
- Median HH income
- $43,648
- Composite
- 28.41/100
- National rank
- #12119
- State rank
- #109 of 176 in CO
Livability — Haxtun
- Score
- 74/100
- State rank
- #37
- US rank
- #4551
Category grades
Schools grade is shown separately in the Schools card above.
Census & demographics
- Census place
- Haxtun, CO
- Population (ZIP)
- 1,484
Population outlook (Phillips County) Hauer SSP2
- Today (2025)
- 4,082 people
- By 2030
- 3,936 · -3.6%
- By 2040
- 3,615 · -11.4%
- By 2050
- 3,267 · -20.0%
- By 2075
- 2,623 · -35.7%
- By 2100
- 1,950 · -52.2%
Race, ethnicity, and origin ACS 2023
- Neighborhood character
- Predominantly White (91%)
- Race & ethnicity
- White 91% Hispanic / Latino 7% Two or more races 7%
- Hispanic origin (detail)
- Mexican 5%
- Common ancestry
- Romanian 2% Lithuanian 2% Slovak 2%
- Foreign-born
- 4% · Canada, South Korea
- Languages at home
- 93% English-only · Spanish 4% German/W. Germanic 1% Russian/Polish/Slavic 1%
Political lean MEDSL · Phillips
- 2024 margin
- Solid R (+62.7) · D 17.5% · R 80.2% · Other 2.3%
- 2008→2024 swing
- -18.9pp toward R · 2008: -43.8pp · 2024: -62.7pp
- All cycles
- 2024: R+62.7 2020: R+59.2 2016: R+58.1 2012: R+46.3 2008: R+43.8
Not yet ingested
- Civics
- —
Market trends
- HPI YoY
- ▼ -1.56%
- Current HPI
- 256.23
- Rent YoY
- —
- Metro
- —
- State GDP YoY
- ▲ 1.95%
- F500 in state
- 14
Industry mix (Fortune 500 HQ in CO)
| Industry | F500 HQs | Revenue |
|---|---|---|
| Technology Distribution | 1 | $31B |
|
||
| Food / Agriculture | 1 | $18B |
|
||
| Packaging | 1 | $14B |
|
||
| Healthcare | 1 | $13B |
|
||
| Energy | 1 | $10B |
|
||
| Technology | 1 | $4B |
|
||
Price history
+1733.3% since first listed9 events — show timeline
- 2026-06-16 Listed $110,000 FSBO.com
- 2012-02-23 Sold (Public Records) $44,000 Public Records
- 2012-02-22 Sold (MLS) $44,000 IRES
- 2011-10-19 Listed $44,000 IRES
- 2010-01-28 Sold (Public Records) $37,500 Public Records
- 2010-01-28 Sold (MLS) $37,500 IRES
- 2009-11-19 Listed $37,500 IRES
- 2003-12-11 Sold (Public Records) $25,000 Public Records
- 1992-12-29 Sold (Public Records) $6,000 Public Records
Property tax history
+5.0%/yrLatest (2025): $599 · +202.8% YoY. Source: county tax records.
Cash-flow waterfall
monthlySold comps — $/sqft
last 12 mo · ≤1 miLoading sold comps…