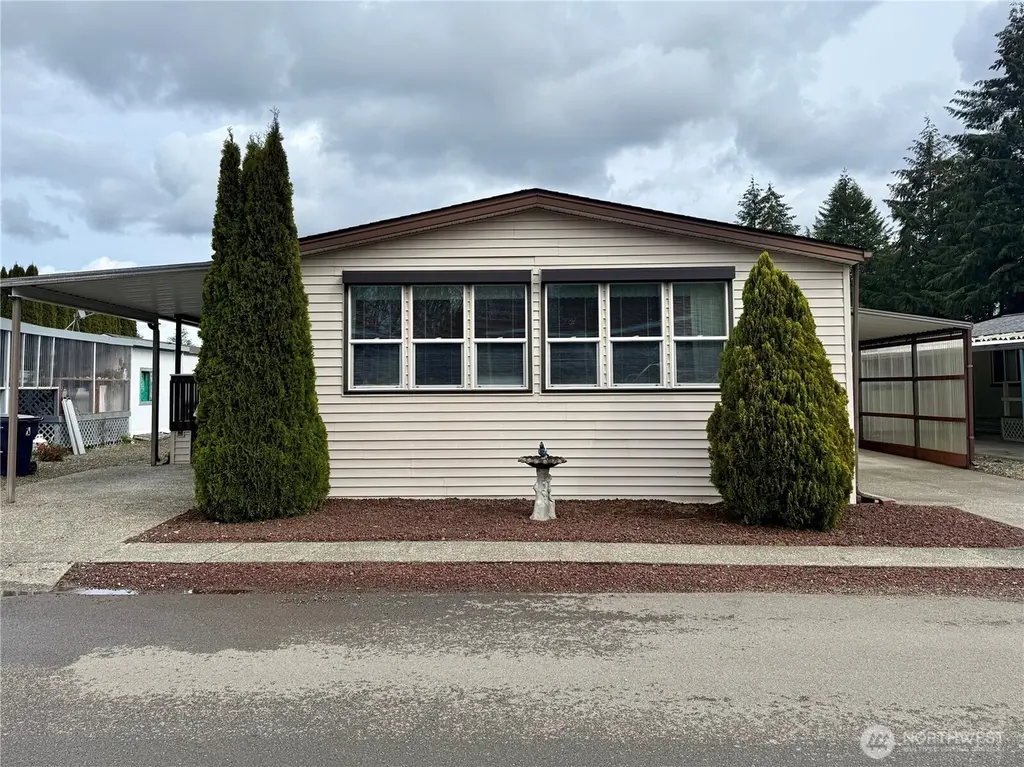
1111 Archwood Dr SW #255 · Olympia, WA
Flood risk 1/10 · Minimal
- FEMA flood zone
- X (unshaded)
- Chance of flooding over 30 yrs
- 0.0%
- Est. flood insurance / yr
- $507 – $1,088
Fire risk 1/10 · Minimal
- Est. fire insurance / yr
- $604 – $1,122
Heat risk 3/10 · Minor
- Hot days now (above 88°F)
- 7 days/yr
- Hot days in 30 yrs
- 15 days/yr
Wind risk 1/10 · Minimal
- Chance of severe wind over 30 yrs
- —
Air-quality risk 6/10 · Moderate
- Unhealthy air days now
- 7 days/yr
- Unhealthy air days in 30 yrs
- 8 days/yr
Risk factors via First Street. Map © Google.
Why this score? — see what drove the C grade
The composite is a weighted blend of 9 inputs, each scored 0–100. Each bar is that input's sub-score; the figure is the points it added to the 100-point composite (weight × sub-score).
- Cash flow +15.0/30.0
- Appreciation +10.0/10.0
- ARV discount +7.5/15.0
- Schools +6.2/10.0
- 1% rule +5.0/10.0
- DSCR +5.0/10.0
- Livability +4.2/5.0
- Rent growth +3.3/5.0
- Condition / age +2.5/5.0
$50,000
🖨 Deal sheet (PDF) 📄 Offer letter ✓ Due diligence
Listing remarks
Welcome to this beautifully maintained double-wide manufactured home located in the desirable Friendly Ridge 55+ community. This charming home features 3 bedrooms and 1.75 bathrooms, offering ample space for comfortable living. Enjoy a low-maintenance yard, complete with a handy storage shed for extra space and organization. With two carports, you’ll have plenty of room for parking. Conveniently situated near shopping, dining, and easy access to I-5, you’ll have everything you need just minutes away. Friendly Ridge offers a variety of amenities, including a game room, clubhouse, exercise room, and spa.
Key facts
- Low-maintenance yard
- Clubhouse
- Two carports
Tags
Neighborhood map
What this means for you Summary
Snapshot
- This is a 3-bed/2.0-bath manufactured listed at $50k.
Deal economics
- At list price, monthly cash flow is $1k ($17k/yr) — positive.
- The deal already cash-flows at list — no discount required.
- Meets the 1% rule at list price ($2k rent vs $50k).
- Recommended offer: $44k (12.0% below list) — sets the bar for market timing.
- Cap rate 39.3% vs local median 2.4% in Olympia — top-decile yield for the area; either an underpriced asset or a hidden risk that comps aren't pricing in. Stress-test before assuming the spread holds.
Location & tenants
- Location reads 83/100 on livability (#58 in WA, #1,036 nationally) — a professional / high-income tenant draw. Strengths: amenities A+, commute A+, health & safety A+; Watch: crime F, cost of living D-.
- Olympia School District (urban): math 66% / reading 75% proficiency, ranked #17 of 291 in WA (top 6%) — strong family-tenant draw, lease renewals of 3-5y typical.
- Market conditions: Rents rising (+3.2%/yr); 304 active listings in the ZIP; 10 comparable units currently listed for rent nearby; rentals at typical pace (median 14d on market — plan ~3-4 weeks tenant-placement turnaround); solid renter incomes; 1,222 units permitted in Thurston County in 2024 (508 in 5+ unit buildings).
Forward outlook
- In year one you build about $5k of equity ($346 loan paydown + $5k appreciation (10.0% local appreciation)).
- Thurston County population projected at +27% by 2050 — long-run rental-demand tailwind backs the buy-and-hold thesis.
- At projected returns (10.0% appreciation + 3.2% rent growth), your $14k cash investment doubles in ~1 year — after that, you're playing with house money.
- By year 6, paydown + projected appreciation supports a ~$31k cash-out refi (75% LTV) — recoverable capital for the next deal without selling this one.
Negotiation context
- It's been on market 443 days — a 12% lower offer ($44k) is reasonable based on typical stale-listing flexibility.
Risks & watch-outs
- Watch-outs: property tax is 2.8% of price.
Questions for the listing agent
- It's been on market 443 days. Have you received any prior offers? Is the seller open to a 12% concession, seller financing, or rate buy-down credit?
- Property tax is high relative to price — has the assessment been appealed recently, and will the sale trigger a re-assessment?
- Why hasn't it sold? Are there any deal-killer items the seller is aware of (foundation, flood, title, zoning, code violations)?
- Is there a deadline driving the sale (1031 exchange, divorce, estate, relocation)? That informs how much negotiation room exists.
- Schools are A-rated — typically a magnet for longer-tenancy family renters. What's the average tenant stay here, and is there a school-zone premium baked into asking?
- Crime grade is F in this area — have there been break-ins, vandalism, or insurance claims at this property in the last 3 years? What carrier currently insures it and at what premium?
- What's the average days-on-market for RENTAL listings here right now (not sales)? A rising rental-DOM trend means longer vacancies and softer asking-rent achievability than the comps imply.
- What's the recent tenant-quality profile in this submarket — average credit score on applications, eviction rate, late-payment / NSF rate, and stable-employment percentage? A property-management company in the area should have these aggregated.
- How much new for-sale + rental construction is in the pipeline within 1–3 miles? Heavy new supply typically softens prices + rents 12–24 months out; constrained supply supports both.
Investment metrics
- 1% rule
- 4.49% ✓
- Cap rate
- 39.33%
- Cash-on-cash
- 117.98%
- DSCR
- 6.25
- GRM
- 1.9
CMA / ARV
- ARV (median comp)
- $113,263
- List price
- $50,000
- Delta
- -55.85%
- Verdict
- UNDERPRICED
- Comps
- 20 within 1.0 mi
Show comp detail 9 sales within ~0.75 mi
| Address | Dist | Beds/Ba | Sqft | Sold | Price | $/sf | Match |
|---|---|---|---|---|---|---|---|
| 1111 Archwood Dr SW #306 | 0.12mi | 3/2.0 | 1,568 (-7%) | 4mo | $75,000 | $48 | 80 |
| 1111 Archwood Dr SW #202 | 0.06mi | 3/2.0 | 1,568 (-7%) | 14mo | $110,000 | $70 | 74 |
| 1111 Archwood Dr SW #226 | 0.04mi | 3/2.0 | 1,792 (+7%) | 16mo | $130,000 | $73 | 74 |
| 1111 Archwood Dr SW #213 | 0.13mi | 3/2.0 | 1,568 (-7%) | 14mo | $150,000 | $96 | 71 |
| 1111 Archwood Dr SW #429 | 0.18mi | 3/2.0 | 1,528 (-9%) | 10mo | $75,000 | $49 | 68 |
| 1111 Archwood Dr SW #285 | 0.12mi | 2/2.0 (-1) | 1,431 (-15%) | 1mo | $105,000 | $73 | 64 |
| 1111 Archwood Dr SW #204 | 0.06mi | 2/2.0 (-1) | 1,440 (-14%) | 7mo | $95,000 | $66 | 63 |
| 1111 Archwood Dr SW #246 | 0.09mi | 2/2.0 (-1) | 1,440 (-14%) | 19mo | $124,900 | $87 | 51 |
| 1111 Archwood Dr SW #430 | 0.19mi | 2/2.0 (-1) | 1,440 (-14%) | 18mo | $64,900 | $45 | 48 |
Match score weights: distance 35% · size 25% · config 20% · recency 20%. Top-matched comps best support the ARV.
Projected returns pro-forma
10.0% appreciation · 3.16% rent growth · sell at horizon
- IRR
- —
- Equity multiple
- 9.24×
- Total profit
- $115,324
- Equity at exit
- $45,044
- IRR
- —
- Equity multiple
- 20.40×
- Total profit
- $271,542
- Equity at exit
- $97,139
Cash invested: $14,000 (down + closing). Projections, not guarantees.
Landlord ↔ Tenant lean methodology
- Overall (STATE)
- 28 Tenant-Leaning
- State Washington
- 28 Tenant-Leaning · D+8
- County
- — inherits STATE
- City
- — inherits STATE
ZIP-level market 98502
- Home prices YoY
- 1.8%
- Rents YoY
- 3.2%
- Active inventory
- 304
- Price-to-rent
- 1.9×
Monthly cashflow live
- Estimated rent
- $2,246 high interval (Pro) →
- Mortgage (P&I)
- −$262
- Tax from tax record
- −$115 /mo · $1,380/yr
- Insurance
- −$21
- HOA
- −$0
- Vacancy / Maint / Mgmt
- −$472
- Net cashflow
- $1,376
Break-even live
Sensitivity live
| Price | -10% $1,405 | -5% $1,391 | +0% $1,376 | +5% $1,362 | +10% $1,348 |
|---|---|---|---|---|---|
| Rent | -10% $1,199 | -5% $1,288 | +0% $1,376 | +5% $1,465 | +10% $1,554 |
| Rate | -1.0pp $1,402 | -0.5pp $1,389 | base $1,376 | +0.5pp $1,363 | +1.0pp $1,350 |
UW: 25.0% down · 7.5% · 30yr · 1.5% tax · 5.0% vac · 8.0% maint · 8.0% mgmt
Financing live
Cash to close
- Down payment
- $12,500
- Closing costs
- $1,500
- Reserves months
- —
- Total cash needed
- —
Loan-product check · same deal, 3 products live
Conventional
25% down · 7.5% · 30yr
- Down + closing
- —
- Monthly P&I
- —
- Monthly cashflow
- —
- DSCR
- —
- Eligible?
- —
Personal DTI + credit; lowest rate.
DSCR
20% down · 8.5% · 30yr
- Down + closing
- —
- Monthly P&I
- —
- Monthly cashflow
- —
- DSCR
- —
- Eligible?
- —
No personal income docs; deal must DSCR.
Hard money
10% down · 12.0% · 12mo
- Down + closing
- —
- Monthly P&I
- —
- Monthly cashflow
- —
- DSCR
- —
- Eligible?
- —
Short-term bridge; refi at stabilization.
Rent comps 10 comps
| Address | Beds | Baths | Sqft | Rent | $/sqft | DOM | Units | Dist |
|---|---|---|---|---|---|---|---|---|
| 800 Yauger Way SW Olympia, WA | 1.0–2.0 | 1.0–2.0 | 1034 | $2,131 | $2.06 | 14d | 13 | 0.27mi |
| 1900 Black Lake Blvd SW Olympia, WA | 1.0–3.0 | 1.0–2.0 | 925 | $2,137 | $2.31 | 14d | 13 | 0.64mi |
| 2010 8th Ct SW Olympia, WA | 2.0 | 2.0 | 1072 | $2,295 | $2.14 | 21d | 1 | 0.85mi |
| 4611 Greenwood Dr SW Olympia, WA | 3.0 | 3.0 | 1448 | $2,495 | $1.72 | 44d | 1 | 0.88mi |
| 300 Kenyon St NW Olympia, WA | 1.0–2.0 | 1.0–2.0 | 878 | $1,995 | $2.27 | 14d | 6 | 0.89mi |
| 2137 Conger Ave NW Unit A Olympia, WA | 3.0 | 2.0 | 1248 | $1,995 | $1.60 | 44d | 1 | 1.19mi |
| 2137 Conger Ave NW Unit C Olympia, WA | 3.0 | 2.0 | 1248 | $1,895 | $1.52 | 44d | 1 | 1.19mi |
| 5004 4th Way SW Olympia, WA | 2.0–3.0 | 2.0–2.5 | 1271 | $2,645 | $2.08 | 14d | 5 | 1.27mi |
| 1626 Madison Ave NW Olympia, WA | 2.0 | 2.0 | 1064 | $2,100 | $1.97 | 14d | 1 | 1.33mi |
| 1415 Evergreen Park Dr SW Olympia, WA | 2.0 | 2.0 | 1050 | $1,735 | $1.65 | 14d | 1 | 1.36mi |
Listing history 18 events
-
2026-06-13statusdays on market $50,000 Pending 443 DOM
-
2026-06-10days on market $50,000 Active 442 DOM
-
2026-06-09days on market $50,000 Active 441 DOM
-
2026-06-08days on market $50,000 Active 440 DOM
-
2026-06-07days on market $50,000 Active 439 DOM
-
2026-06-05days on market $50,000 Active 436 DOM
-
2026-06-02days on market $50,000 Active 434 DOM
-
2026-06-01days on market $50,000 Active 433 DOM
-
2026-05-31days on market $50,000 Active 432 DOM
-
2026-05-30days on market $50,000 Active 431 DOM
-
2026-05-07price $50,000
-
2026-03-29price $65,000
-
2026-01-20price $75,000
-
2025-10-20price $85,000
-
2025-09-08price $100,000
-
2025-08-12price $107,500
-
2025-05-13price $120,000
-
2025-03-25$130,000 Active
ⓘ Source: listings_history table (triggers on properties + properties_extension) + one-shot
backfill from property_details.listing_events for pre-trigger history.
Tax reassessment forecast WA · Resets to sale price
- Current annual tax
- $1,380 · $115/mo
- Projected year-2 tax
- $1,380 · $115/mo
- Expected delta
- $0/yr ($0/mo · 0.0%)
ⓘ Screening estimate from a state-policy table — verify with the county assessor before closing.
Climate risk First Street
- Flood 1/10 Low FEMA zone X (unshaded) · 0% chance over 30 yrs
- Wildfire 1/10 Low
- Heat 3/10 Moderate 7 d/yr ≥88°F today · 15 d/yr by 30 yrs out
- Wind 1/10 Low
- Air quality 6/10 Major 7 unhealthy d/yr today · 8 by 30 yrs out
Nearby sold comps map
Loading sold comps map…
Walkable amenities ~0.75 mi
Loading nearby amenities…
Taxation est. · year 1
- Rental income
- $26,953
- − Mortgage interest
- −$2,801
- − Property taxes
- −$1,380
- − Insurance
- −$250
- − Repairs & maintenance
- −$2,156
- − Management
- −$2,156
- − Depreciation
- −$1,455
- Taxable income
- $16,756
- Est. tax owed @ 24.0%
- −$4,021
- After-tax cash flow
- $12,496/yr
For passive investors: Depreciation is non-cash, so a rental often shows a tax loss while cash-flowing — sheltering income. Rental losses are passive: they offset passive income freely, and up to $25,000/yr can offset ordinary (W-2) income if you actively participate and your MAGI is under $100k (phasing out to $0 by $150k); unused losses carry forward. On sale, claimed depreciation is recaptured at up to 25%, and gains may owe capital-gains tax (a 1031 exchange can defer both). Figures are a year-1 estimate at your 24.0% rate — not tax advice; consult a CPA.
Schools (NCES district)
- District
- Olympia School District
- NCES district ID
- 5306180
- Math proficiency
- 66% ▼ -2.00%
- Reading proficiency
- 75% ▼ -2.00%
- Median HH income
- $63,852
- Composite
- 62.27/100
- National rank
- #1438
- State rank
- #17 of 291 in WA
Livability — Olympia
- Score
- 83/100
- State rank
- #58
- US rank
- #1036
Category grades
Schools grade is shown separately in the Schools card above.
Census & demographics
- Census place
- Olympia, WA
- County
- Thurston County · 269,345 people
- City population
- 98,428
- Metro
- Olympia-Lacey-Tumwater, WA
- Population (ZIP)
- 35,398
- Household income
- $92,207
- Rent vs Own
- Severe rent burden
- 1811.0
Population outlook (Thurston County) Hauer SSP2
- Today (2025)
- 308,239 people
- By 2030
- 326,483 · +5.9%
- By 2040
- 359,890 · +16.8%
- By 2050
- 391,800 · +27.1%
- By 2075
- 468,024 · +51.8%
- By 2100
- 519,890 · +68.7%
Race, ethnicity, and origin ACS 2023
- Neighborhood character
- Predominantly White (71%)
- Race & ethnicity
- White 71% Two or more races 13% Hispanic / Latino 11% Asian 6% Black 3% Native American 1%
- Hispanic origin (detail)
- Mexican 3% Puerto Rican 4%
- Common ancestry
- Italian 5% Portuguese 4% Iranian 3%
- Foreign-born
- 8% · Vietnam, Canada, China
- Languages at home
- 90% English-only · Spanish 3% Vietnamese 2% Other Asian/Pacific 1%
Political lean MEDSL · Thurston
- 2024 margin
- Strong D (+20.4) · D 58.5% · R 38.1% · Other 3.5%
- 2008→2024 swing
- -1.3pp toward R · 2008: 21.7pp · 2024: 20.4pp
- All cycles
- 2024: D+20.4 2020: D+18.6 2016: D+15.4 2012: D+19.0 2008: D+21.7
Not yet ingested
- Civics
- —
Market trends
- HPI YoY
- ▲ 18.49%
- Current HPI
- 1056.49
- Rent YoY
- ▲ 3.16%
- Metro
- Olympia-Lacey-Tumwater, WA
- State GDP YoY
- ▲ 4.65%
- F500 in state
- 22
Industry mix (Fortune 500 HQ in WA)
| Industry | F500 HQs | Revenue |
|---|---|---|
| Retail | 2 | $269B |
|
||
| Technology / Retail | 1 | $638B |
|
||
| Technology | 1 | $245B |
|
||
| Telecommunications | 1 | $38B |
|
||
| Food / Beverage | 1 | $36B |
|
||
| Automotive / Trucks | 1 | $34B |
|
||
Price history
-61.5% since first listed8 events — show timeline
- 2026-05-07 Price Changed $50,000 NWMLS as Distributed by MLS Grid
- 2026-03-29 Price Changed $65,000 NWMLS as Distributed by MLS Grid
- 2026-01-20 Price Changed $75,000 NWMLS as Distributed by MLS Grid
- 2025-10-20 Price Changed $85,000 NWMLS as Distributed by MLS Grid
- 2025-09-08 Price Changed $100,000 NWMLS as Distributed by MLS Grid
- 2025-08-12 Price Changed $107,500 NWMLS as Distributed by MLS Grid
- 2025-05-13 Price Changed $120,000 NWMLS as Distributed by MLS Grid
- 2025-03-25 Listed $130,000 NWMLS as Distributed by MLS Grid
Cash-flow waterfall
monthlySold comps — $/sqft
last 12 mo · ≤1 miLoading sold comps…