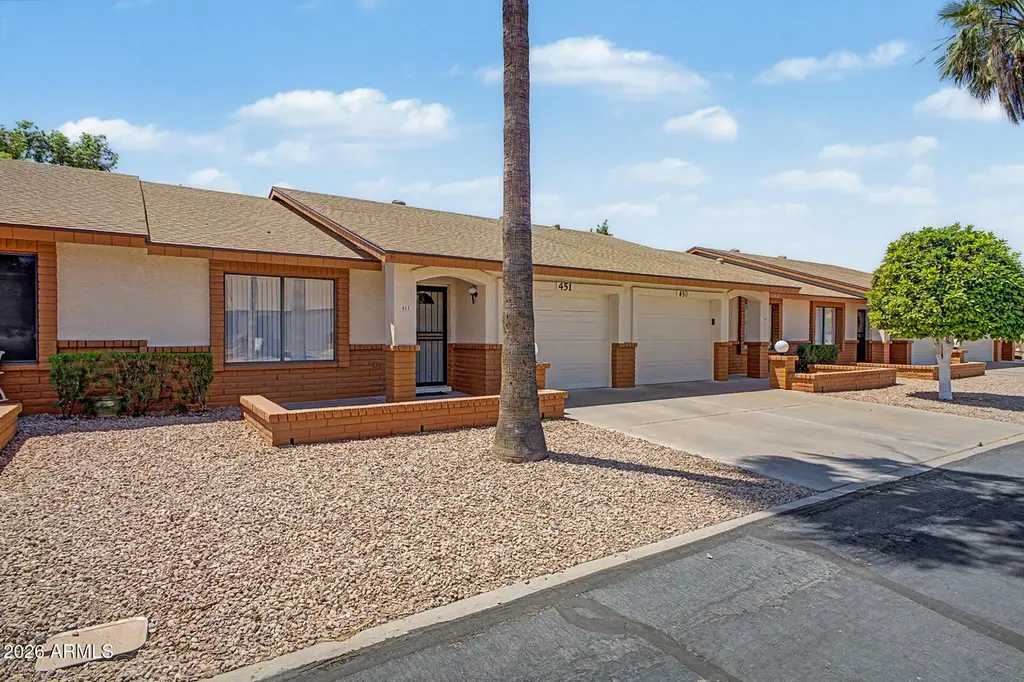
8255 E Kiva Ave #451 · Mesa, AZ
Flood risk 1/10 · Minimal
- FEMA flood zone
- X (shaded)
- Chance of flooding over 30 yrs
- 0.0%
- Est. flood insurance / yr
- $507 – $1,088
Fire risk 2/10 · Minimal
- Est. fire insurance / yr
- $610 – $1,132
Heat risk 9/10 · Severe
- Hot days now (above 111°F)
- 7 days/yr
- Hot days in 30 yrs
- 20 days/yr
Wind risk 1/10 · Minimal
- Chance of severe wind over 30 yrs
- —
Air-quality risk 2/10 · Minimal
- Unhealthy air days now
- 1 days/yr
- Unhealthy air days in 30 yrs
- 2 days/yr
Risk factors via First Street. Map © Google.
Why this score? — see what drove the D grade
The composite is a weighted blend of 9 inputs, each scored 0–100. Each bar is that input's sub-score; the figure is the points it added to the 100-point composite (weight × sub-score).
- Cash flow +9.4/30.0
- ARV discount +7.5/15.0
- Appreciation +5.7/10.0
- Schools +4.6/10.0
- Livability +4.0/5.0
- 1% rule +3.1/10.0
- DSCR +2.6/10.0
- Rent growth +2.6/5.0
- Condition / age +2.5/5.0
$265,000
🖨 Deal sheet (PDF) 📄 Offer letter ✓ Due diligence
Listing remarks
Charming and well-maintained 2 bed, 2 bath home in a desirable active adult community in Mesa. This inviting residence features an open-concept floorplan with a spacious living area, ideal for both everyday living and entertaining. The kitchen offers abundant cabinetry, generous counter space, and a functional layout that flows seamlessly to the dining and living areas. The primary suite includes dual sinks, ample storage, and a walk-in shower, creating a comfortable and practical retreat. A secondary bedroom and full bath provide flexibility for guests or a home office. Enjoy indoor-outdoor living with a covered patio overlooking a lush, greenbelt-style setting, perfect for relaxing mornin
Key facts
- Community amenities
- Covered patio
- Abundant cabinetry
Tags
Property features AI
Finance
- Other: Lot features recorded by assessor
- HOA & community: Association with annual and monthly fees; Annual association fee and a separate monthly fee; Association covers roof repair and replacement, insurance, exterior and grounds maintenance, front yard maintenance, and trash; Community amenities include pool, golf, pickleball, lake, community spa (heated), community media room, tennis courts, biking/walking paths, and fitness center; No visible truck/trailer/RV/boat rule
Exterior
- Parking: 1 covered parking space; 1 open parking space; Direct access parking; 1-car garage
- Utilities: City water; Public sewer
- Home design: Patio home; Attached property; Fee simple ownership
- Construction: Stucco and painted wood frame construction; Composition roof
- Exterior features: Gravel/stone front yard; Grass in back yard; Asphalt road access
Interior
- Kitchen: Built-in microwave; Refrigerator; Dishwasher; Garbage disposal; Pantry
- Bedrooms: 2 possible bedrooms
- Flooring: Carpet; Laminate; Tile
- Bathrooms: 2 full bathrooms
- Heating & cooling: Electric heating; Central air conditioning
- Interior features: High-speed internet; Double vanity in bathroom; Eat-in kitchen; Pantry; Full bathroom in primary bedroom
- Laundry & utility: Laundry inside the unit
Neighborhood map
What this means for you Summary
Snapshot
- This is a 2-bed/3.0-bath condo listed at $265k.
Deal economics
- At list price, monthly cash flow is $-190 ($-2k/yr) — negative.
- To cash-flow at today's rent, offer at most $231k (12.7% below list).
- To meet the 1% rule (rent ≥ 1% of price), the offer needs to be $216k (18.6% below list).
- Recommended offer: $216k (18.6% below list) — sets the bar for 1% rule.
- Cap rate 5.4% vs local median 3.4% in Mesa — top-decile yield for the area; either an underpriced asset or a hidden risk that comps aren't pricing in. Stress-test before assuming the spread holds.
Location & tenants
- Location reads 79/100 on livability (#6 in AZ, #2,034 nationally) — a middle-class / working-renter tenant base. Strengths: amenities A+, commute A+, housing A+; Watch: health & safety C-, crime D.
- Gilbert Unified District (4239) (suburban): math 49% / reading 52% proficiency, ranked #38 of 249 in AZ (top 15%) — acceptable for families but not a draw, mixed tenant base, ~2y average lease; only 14% free/reduced lunch — higher-income household profile.
- Zoned schools: Neely Traditional Academy (math 83% / reading 81%, grade A+, #10 of 1,109 statewide, top 1%, 805 students, 17% FRL); Desert Ridge Jr. High (math 28% / reading 43%, grade F, #62 of 218 statewide, top 29%, 973 students, 26% FRL); Desert Ridge High (math 24% / reading 32%, grade F, #136 of 381 statewide, top 36%, 2,284 students, 23% FRL).
- Market conditions: Rents flat; 171 active listings in the ZIP; 25 comparable units currently listed for rent nearby; rentals at typical pace (median 24d on market — plan ~3-4 weeks tenant-placement turnaround); solid renter incomes; 36,011 units permitted in Maricopa County in 2024 (12,801 in 5+ unit buildings).
- This rent runs 31% of the median local income ($84k/yr) — at the standard rent-burdened threshold; future hikes will face affordability resistance.
Forward outlook
- In year one you build about $6k of equity ($2k loan paydown + $4k appreciation (1.4% local appreciation)).
- Maricopa County population projected at +38% by 2050 — long-run rental-demand tailwind backs the buy-and-hold thesis.
- By year 6, paydown + projected appreciation supports a ~$31k cash-out refi (75% LTV) — recoverable capital for the next deal without selling this one.
Negotiation context
- Only 14 days on market — expect competitive offers; lowballing is unlikely to land.
Risks & watch-outs
- Climate carrying-cost: extreme-heat days projected 7→20/yr by 2055 (HVAC capex compounding) — expect insurance premiums to compound above CPI over the hold.
Questions for the listing agent
- What do current leases actually rent for vs. the listed asking? Can we see a recent rent roll and the last 12 months of T-12 income?
- What does the HOA fee cover, when was the last increase, and are there any pending special assessments or reserve-fund shortfalls?
- Any open or pending special assessments — roof, HVAC, plumbing, elevator, façade? What's the per-unit balance and payoff schedule, and is the seller paying it off at close or rolling it to the buyer?
- Is there a deadline driving the sale (1031 exchange, divorce, estate, relocation)? That informs how much negotiation room exists.
- Crime grade is D in this area — have there been break-ins, vandalism, or insurance claims at this property in the last 3 years? What carrier currently insures it and at what premium?
- The area grade is low — what's the realistic commute time and amenity access for the typical tenant pool here? Any planned neighborhood developments (good or bad) we should know about?
- What's the average days-on-market for RENTAL listings here right now (not sales)? A rising rental-DOM trend means longer vacancies and softer asking-rent achievability than the comps imply.
- What's the recent tenant-quality profile in this submarket — average credit score on applications, eviction rate, late-payment / NSF rate, and stable-employment percentage? A property-management company in the area should have these aggregated.
- How much new apartment / multifamily construction is in the pipeline within 1–3 miles? Heavy new supply (>2% of stock underway) typically softens rents 12–24 months out; light construction supports rent growth.
Investment metrics
- 1% rule
- 0.81% ✗
- Cap rate
- 5.43%
- Cash-on-cash
- -3.07%
- DSCR
- 0.86
- GRM
- 10.2
CMA / ARV
No comps found within radius.
Projected returns pro-forma
1.44% appreciation · 0.54% rent growth · sell at horizon
- IRR
- -1.7%
- Equity multiple
- 0.91×
- Total profit
- $-6,520
- Equity at exit
- $96,588
- IRR
- 1.7%
- Equity multiple
- 1.21×
- Total profit
- $15,670
- Equity at exit
- $133,231
Cash invested: $74,200 (down + closing). Projections, not guarantees.
Landlord ↔ Tenant lean methodology
- Overall (STATE)
- 87 Strongly Landlord-Friendly
- State Arizona
- 87 Strongly Landlord-Friendly · R+3
- County
- — inherits STATE
- City
- — inherits STATE
ZIP-level market 85209
- Home prices YoY
- 0.5%
- Rents YoY
- 0.5%
- Active inventory
- 171
- Price-to-rent
- 10.2×
Monthly cashflow live
- Estimated rent
- $2,157 high interval (Pro) →
- Mortgage (P&I)
- −$1,390
- Tax from tax record
- −$103 /mo · $1,233/yr
- Insurance
- −$110
- HOA
- −$291
- Vacancy / Maint / Mgmt
- −$453
- Net cashflow
- $-190
Break-even live
Sensitivity live
| Price | -10% $-40 | -5% $-115 | +0% $-190 | +5% $-265 | +10% $-340 |
|---|---|---|---|---|---|
| Rent | -10% $-360 | -5% $-275 | +0% $-190 | +5% $-105 | +10% $-19 |
| Rate | -1.0pp $-56 | -0.5pp $-122 | base $-190 | +0.5pp $-258 | +1.0pp $-328 |
UW: 25.0% down · 7.5% · 30yr · 1.5% tax · 5.0% vac · 8.0% maint · 8.0% mgmt
Financing live
Cash to close
- Down payment
- $66,250
- Closing costs
- $7,950
- Reserves months
- —
- Total cash needed
- —
Loan-product check · same deal, 3 products live
Conventional
25% down · 7.5% · 30yr
- Down + closing
- —
- Monthly P&I
- —
- Monthly cashflow
- —
- DSCR
- —
- Eligible?
- —
Personal DTI + credit; lowest rate.
DSCR
20% down · 8.5% · 30yr
- Down + closing
- —
- Monthly P&I
- —
- Monthly cashflow
- —
- DSCR
- —
- Eligible?
- —
No personal income docs; deal must DSCR.
Hard money
10% down · 12.0% · 12mo
- Down + closing
- —
- Monthly P&I
- —
- Monthly cashflow
- —
- DSCR
- —
- Eligible?
- —
Short-term bridge; refi at stabilization.
Rent comps 25 comps
| Address | Beds | Baths | Sqft | Rent | $/sqft | DOM | Units | Dist |
|---|---|---|---|---|---|---|---|---|
| 8438 E Keats Ave Mesa, AZ | 3.0 | 2.0 | 1363 | $2,300 | $1.69 | 26d | 1 | 0.22mi |
| 2311 S Farnsworth Dr #85 Mesa, AZ | 2.0 | 2.0 | 1332 | $3,300 | $2.48 | 5d | 1 | 0.33mi |
| 2064 S Farnsworth Dr #25 Mesa, AZ | 2.0 | 2.0 | 1011 | $1,595 | $1.58 | 23d | 1 | 0.33mi |
| 7950 E Keats Ave Mesa, AZ | 2.0 | 2.0 | 1228 | $1,995 | $1.62 | 25d | 1 | 0.36mi |
| 2223 S Gordon Mesa, AZ | 3.0 | 2.0 | 1278 | $2,250 | $1.76 | 26d | 1 | 0.65mi |
| 8865 E Baseline Rd #1028 Mesa, AZ | 2.0 | 1.0 | 1028 | $1,500 | $1.46 | 45d | 1 | 0.66mi |
| 8865 E Baseline Rd #1129 Mesa, AZ | 2.0 | 2.0 | 748 | $3,200 | $4.28 | 7d | 1 | 0.78mi |
| 8865 E Baseline Rd #300 Mesa, AZ | 1.0 | 1.0 | 764 | $2,000 | $2.62 | 20d | 1 | 0.78mi |
| 8865 E Baseline Rd #555 Mesa, AZ | 3.0 | 2.0 | 1387 | $3,900 | $2.81 | 26d | 1 | 0.87mi |
| 8865 E Baseline Rd #555 Mesa, AZ | 3.0 | 2.0 | 1387 | $3,900 | $2.81 | 21d | 1 | 0.87mi |
| 8433 E Guadalupe Rd Mesa, AZ | 1.0–3.0 | 1.0–2.0 | 936 | $2,526 | $2.70 | 0d | 1 | 0.92mi |
| 2206 S Ellsworth Rd Unit 94B Mesa, AZ | 2.0 | 2.0 | 924 | $3,702 | $4.01 | 26d | 1 | 1.09mi |
| 2206 S Ellsworth Rd Unit 3B Mesa, AZ | 2.0 | 2.0 | 976 | $1,606 | $1.65 | 16d | 1 | 1.09mi |
| 2206 S Ellsworth Rd Unit 101B Mesa, AZ | 2.0 | 2.0 | 924 | $1,555 | $1.68 | 45d | 1 | 1.09mi |
| 8462 E Pampa Ave Mesa, AZ | 3.0 | 2.5 | 1473 | $1,995 | $1.35 | 45d | 1 | 1.20mi |
| 8915 E Guadalupe Rd Mesa, AZ | 2.0 | 2.0 | 1054 | $1,390 | $1.32 | 26d | 1 | 1.25mi |
| 8915 E Guadalupe Rd Mesa, AZ | 2.0–3.0 | 2.0 | 971 | $1,390 | $1.43 | 5d | 11 | 1.25mi |
| 2821 S Skyline #157 Mesa, AZ | 2.0 | 2.5 | 1438 | $2,200 | $1.53 | 6d | 1 | 1.34mi |
| 2821 S Skyline #127 Mesa, AZ | 2.0 | 2.5 | 1438 | $2,350 | $1.63 | 45d | 1 | 1.36mi |
| 9233 E Neville Ave Mesa, AZ | 2.0–3.0 | 2.0 | 1145 | $1,575 | $1.37 | 26d | 1 | 1.37mi |
| 9233 E Neville Ave Mesa, AZ | 2.0–3.0 | 2.0 | 1142 | $1,575 | $1.38 | 16d | 3 | 1.37mi |
| 9335 E Baseline Rd Mesa, AZ | 1.0–3.0 | 1.0–2.0 | 1162 | $1,745 | $1.50 | 0d | 12 | 1.40mi |
| 8843 E Pampa Ave Mesa, AZ | 3.0 | 2.0 | 1357 | $2,050 | $1.51 | 6d | 1 | 1.43mi |
| 9233 E Neville Ave #1088 Mesa, AZ | 3.0 | 2.0 | 1057 | $1,850 | $1.75 | 7d | 1 | 1.43mi |
| 8852 E Plana Ave Mesa, AZ | 3.0 | 2.0 | 1357 | $1,995 | $1.47 | 45d | 1 | 1.48mi |
HOA detail condo
- Monthly dues
- $291 · $3,492/yr
- Assessments
- None detected in remarks — confirm with the listing agent.
Listing history 4 events
-
2026-05-15status Pending 1007-char remark
-
2026-05-01$265,000 Active 1007-char remark
-
1998-11-06soldstatus $105,000
-
1995-05-12soldstatus $91,984
ⓘ Source: listings_history table (triggers on properties + properties_extension) + one-shot
backfill from property_details.listing_events for pre-trigger history.
Tax reassessment forecast AZ · Resets to sale price
- Current annual tax
- $1,233 · $103/mo
- Projected year-2 tax
- $1,749 · $146/mo
- Expected delta
- +$516/yr (+$43/mo · 41.8%)
ⓘ Screening estimate from a state-policy table — verify with the county assessor before closing.
Climate risk First Street
- Flood 1/10 Low FEMA zone X (shaded) · 0% chance over 30 yrs
- Wildfire 2/10 Low
- Heat 9/10 Extreme 7 d/yr ≥111°F today · 20 d/yr by 30 yrs out
- Wind 1/10 Low
- Air quality 2/10 Low 1 unhealthy d/yr today · 2 by 30 yrs out
Nearby sold comps map
Loading sold comps map…
Walkable amenities ~0.75 mi
Loading nearby amenities…
Taxation est. · year 1
- Rental income
- $25,884
- − Mortgage interest
- −$14,844
- − Property taxes
- −$1,233
- − Insurance
- −$1,325
- − Repairs & maintenance
- −$2,071
- − Management
- −$2,071
- − HOA
- −$3,492
- − Depreciation
- −$7,709
- Taxable loss
- −$6,861
- Est. tax savings @ 24.0%
- +$1,647
- After-tax cash flow
- $-631/yr
For passive investors: Depreciation is non-cash, so a rental often shows a tax loss while cash-flowing — sheltering income. Rental losses are passive: they offset passive income freely, and up to $25,000/yr can offset ordinary (W-2) income if you actively participate and your MAGI is under $100k (phasing out to $0 by $150k); unused losses carry forward. On sale, claimed depreciation is recaptured at up to 25%, and gains may owe capital-gains tax (a 1031 exchange can defer both). Figures are a year-1 estimate at your 24.0% rate — not tax advice; consult a CPA.
Schools (NCES district)
- District
- Gilbert Unified District (4239)
- NCES district ID
- 0403400
- Math proficiency
- 49% ▼ -8.00%
- Reading proficiency
- 52% ▼ -7.00%
- Median HH income
- $74,715
- Composite
- 45.55/100
- National rank
- #2600
- State rank
- #38 of 249 in AZ
Livability — Mesa
- Score
- 79/100
- State rank
- #6
- US rank
- #2034
Category grades
Schools grade is shown separately in the Schools card above.
Census & demographics
- Census place
- Mesa, AZ
- County
- Maricopa County · 4,537,380 people
- City population
- 555,266
- Metro
- Phoenix-Mesa-Chandler, AZ
- Population (ZIP)
- 43,150
- Household income
- $84,432
- Rent vs Own
- Severe rent burden
- 972.0
Population outlook (Maricopa County) Hauer SSP2
- Today (2025)
- 4,979,203 people
- By 2030
- 5,378,229 · +8.0%
- By 2040
- 6,156,598 · +23.6%
- By 2050
- 6,872,376 · +38.0%
- By 2075
- 8,401,270 · +68.7%
- By 2100
- 9,247,439 · +85.7%
Race, ethnicity, and origin ACS 2023
- Neighborhood character
- Predominantly White (72%)
- Race & ethnicity
- White 72% Hispanic / Latino 15% Two or more races 9% Black 4% Asian 3%
- Hispanic origin (detail)
- Mexican 11%
- Common ancestry
- Portuguese 4% Romanian 3% Lithuanian 3%
- Foreign-born
- 9% · Canada, China, Vietnam
- Languages at home
- 87% English-only · Spanish 9% Tagalog/Filipino 1% Chinese 1%
Political lean MEDSL · Maricopa
- 2024 margin
- Toss-up / Even · D 47.7% · R 51.2% · Other 1.1%
- 2008→2024 swing
- +7.1pp toward D · 2008: -10.6pp · 2024: -3.5pp
- All cycles
- 2024: R+3.5 2020: D+2.2 2016: R+3.5 2012: R+12.0 2008: R+10.6
Not yet ingested
- Civics
- —
Market trends
- HPI YoY
- ▲ 1.44%
- Current HPI
- 277.6198
- Rent YoY
- ▲ 0.54%
- Metro
- Phoenix-Mesa-Chandler, AZ
- State GDP YoY
- ▲ 4.54%
- F500 in state
- 20
Industry mix (Fortune 500 HQ in AZ)
| Industry | F500 HQs | Revenue |
|---|---|---|
| Technology | 2 | $13B |
|
||
| Mining / Metals | 1 | $23B |
|
||
| Environmental Services | 1 | $16B |
|
||
| Metals / Steel | 1 | $14B |
|
||
| Technology Distribution | 1 | $9B |
|
||
| Homebuilding | 1 | $8B |
|
||
Price history
+188.1% since first listed6 events — show timeline
- 2026-06-03 Sold (Public Records) $265,000 Public Records
- 2026-06-03 Sold (MLS) $265,000 ARMLS
- 2026-05-15 Pending — ARMLS
- 2026-05-01 Listed $265,000 ARMLS
- 1998-11-06 Sold (Public Records) $105,000 Public Records
- 1995-05-12 Sold (Public Records) $91,984 Public Records
Property tax history
+2.4%/yrLatest (2025): $1,233 · +4.0% YoY. Source: county tax records.
Cash-flow waterfall
monthlySold comps — $/sqft
last 12 mo · ≤1 miLoading sold comps…