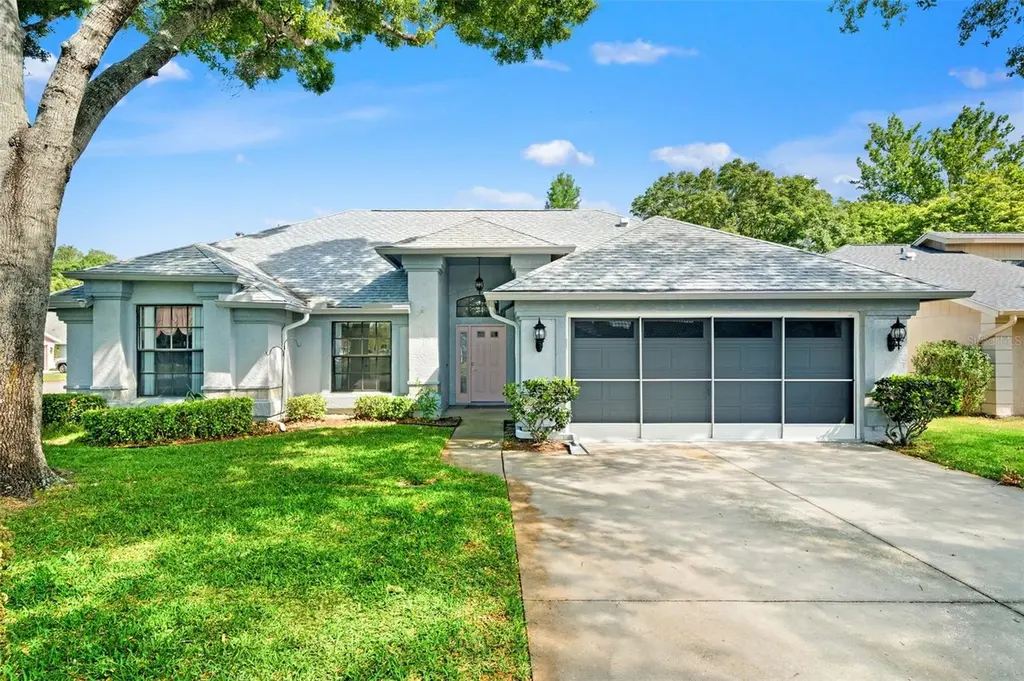
8901 Whistler Way · Hudson, FL
Flood risk 3/10 · Minor
- FEMA flood zone
- X (unshaded)
- Chance of flooding over 30 yrs
- 0.2%
- Est. flood insurance / yr
- $507 – $1,088
Fire risk 1/10 · Minimal
- Est. fire insurance / yr
- $947 – $1,759
Heat risk 10/10 · Severe
- Hot days now (above 108°F)
- 7 days/yr
- Hot days in 30 yrs
- 24 days/yr
Wind risk 10/10 · Severe
- Chance of severe wind over 30 yrs
- 99.0%
Air-quality risk 2/10 · Minimal
- Unhealthy air days now
- 2 days/yr
- Unhealthy air days in 30 yrs
- 2 days/yr
Risk factors via First Street. Map © Google.
Why this score? — see what drove the C grade
The composite is a weighted blend of 9 inputs, each scored 0–100. Each bar is that input's sub-score; the figure is the points it added to the 100-point composite (weight × sub-score).
- Cash flow +18.8/30.0
- ARV discount +15.0/15.0
- DSCR +5.9/10.0
- Schools +4.3/10.0
- 1% rule +4.0/10.0
- Livability +3.7/5.0
- Condition / age +2.5/5.0
- Rent growth +1.9/5.0
- Appreciation +0.0/10.0
$229,000
🖨 Deal sheet 📄 Offer letter ✓ Due diligence
Listing remarks
Under contract-accepting backup offers. One or more photo(s) has been virtually staged. HIGHEST AND BEST BY 5/12/26 AT 12PM. Opportunity awaits in Woodward Village of Beacon Woods East! This 3-bedroom, 2-bathroom home offers 1,630 square feet of potential and is perfect for investors, renovators, or buyers looking to create their dream home. Featuring vaulted ceilings and a cozy fireplace, the home already has great bones and an open feel ready for your personal touch. Off the living room, the primary bedroom features en suite bathroom with garden tub, shower, dual vanity, and walk-in closet. An additional room off the living room features French doors and can be used as an office or additi
Key facts
- En suite bathroom
- Walk-in closet
- French doors
Tags
Property features AI
Finance
- Other: Lease restrictions apply
- Financial info: Association fee collected quarterly; Some fees listed (monthly/annual amounts disclosed)
- HOA & community: Part of Beacon Woods East association (association approval required); Quarterly association fees; Monthly HOA equivalent shown; Community clubhouse, park, playground and pool; Pets allowed
Exterior
- Parking: Driveway; Attached garage with garage door opener; 2-car garage
- Security: Street lights in community
- Utilities: Public water; Public sewer; Electricity available; Cable available; Broadband / high-speed internet available; Underground utilities
- Home design: Single-family residence; One story; South-facing; Homesteaded
- Construction: Block, concrete and stucco construction; Shingle roof; Slab foundation; Built with typical residential materials
- Exterior features: Covered screened rear porch; Patio / porch with screened area; Exterior lighting; Private mailbox; Rain gutters; Sidewalk; Sliding doors; Trees and landscaped yard; Corner lot; Cleared, level lot; Paved roads (asphalt); Irrigation equipment
Interior
- Kitchen: Dishwasher; Microwave; Range; Refrigerator; Eat-in kitchen
- Bedrooms: 3 bedrooms
- Flooring: Carpet; Laminate; Tile
- Bathrooms: 2 full bathrooms
- Heating & cooling: Central heating (electric); Central air conditioning
- Interior features: Ceiling fans; Eat-in kitchen; High ceilings; Living room / dining room combo; Open floorplan; Split bedroom layout; Thermostat; Vaulted ceilings; Walk-in closets
- Laundry & utility: Washer and dryer included; Inside laundry room; Electric water heater; Inside utility
Neighborhood map
What this means for you Summary
Snapshot
- This is a 3-bed/2.0-bath single-family listed at $229k.
Deal economics
- At list price, monthly cash flow is $229 ($3k/yr) — positive.
- The deal already cash-flows at list — no discount required.
- To meet the 1% rule (rent ≥ 1% of price), the offer needs to be $206k (10.0% below list).
- Recommended offer: $206k (10.0% below list) — sets the bar for 1% rule.
- Cap rate 7.5% vs local median 3.4% in Hudson — top-decile yield for the area; either an underpriced asset or a hidden risk that comps aren't pricing in. Stress-test before assuming the spread holds.
Location & tenants
- Location reads 74/100 on livability (#289 in FL, #4,856 nationally) — a middle-class / working-renter tenant base. Strengths: cost of living A+, housing A+, health & safety A+; Watch: amenities D, employment D, schools D-.
- Pasco (suburban): math 50% / reading 52% proficiency, ranked #32 of 73 in FL (top 44%) — acceptable for families but not a draw, mixed tenant base, ~2y average lease.
- Market conditions: Rents soft (-2.3%/yr); 790 active listings in the ZIP; 16 comparable units currently listed for rent nearby; rentals at typical pace (median 22d on market — plan ~3-4 weeks tenant-placement turnaround); 6,765 units permitted in Pasco County in 2024 (1,250 in 5+ unit buildings).
- At $2,062/mo this rent would consume 48% of the median local household income ($51k/yr) (locally 946% of renters already pay >50% of income on rent) — very limited rent-growth headroom before tenants either downsize or default.
Forward outlook
- Local home prices are declining (-3.0%/yr); year-one equity from $2k of loan paydown is wiped out by about $7k of value loss. Plan a longer hold.
- Pasco County population projected at +29% by 2050 — long-run rental-demand tailwind backs the buy-and-hold thesis.
Negotiation context
- Only 4 days on market — expect competitive offers; lowballing is unlikely to land.
- Current owner paid $87k; list at $229k implies a 163% gain — meaningful room to come down on a strong offer.
Risks & watch-outs
- Climate carrying-cost: severe wind risk, 99% chance of damaging wind over 30y; extreme-heat days projected 7→24/yr by 2055 (HVAC capex compounding) — expect insurance premiums to compound above CPI over the hold.
Questions for the listing agent
- What does the HOA fee cover, when was the last increase, and are there any pending special assessments or reserve-fund shortfalls?
- Is there a deadline driving the sale (1031 exchange, divorce, estate, relocation)? That informs how much negotiation room exists.
- Schools are D-rated, which usually means shorter tenancies and higher turnover. Who's the typical renter profile here, and what's been the actual vacancy rate?
- What's the average days-on-market for RENTAL listings here right now (not sales)? A rising rental-DOM trend means longer vacancies and softer asking-rent achievability than the comps imply.
- What's the recent tenant-quality profile in this submarket — average credit score on applications, eviction rate, late-payment / NSF rate, and stable-employment percentage? A property-management company in the area should have these aggregated.
- How much new for-sale + rental construction is in the pipeline within 1–3 miles? Heavy new supply typically softens prices + rents 12–24 months out; constrained supply supports both.
Investment metrics
- 1% rule
- 0.90% ✗
- Cap rate
- 7.49%
- Cash-on-cash
- 4.28%
- DSCR
- 1.19
- GRM
- 9.3
CMA / ARV
- ARV (on-the-fly)
- $280,360
- Comps found
- 12
Show comp detail 12 sales within ~0.75 mi
| Address | Dist | Beds/Ba | Sqft | Sold | Price | $/sf | Match |
|---|---|---|---|---|---|---|---|
| 8901 Whistler Way | 0.00mi | 3/2.0 | 1,630 (0%) | 0mo | $233,500 | $143 | 100 |
| 8911 Welsh Way | 0.09mi | 3/2.0 | 1,566 (-4%) | 1mo | $321,000 | $205 | 89 |
| 13304 Wagner Dr | 0.14mi | 2/2.0 (-1) | 1,624 (-0%) | 0mo | $230,000 | $142 | 88 |
| 9224 Halberg Dr | 0.43mi | 3/2.0 | 1,684 (+3%) | 1mo | $280,000 | $166 | 74 |
| 9105 Robin Nest Dr | 0.30mi | 3/2.0 | 1,757 (+8%) | 2mo | $355,000 | $202 | 72 |
| 13012 Sirius Ln | 0.43mi | 3/2.0 | 1,771 (+9%) | 1mo | $320,000 | $181 | 65 |
| 8405 Reynolds Dr | 0.46mi | 3/2.0 | 1,771 (+9%) | 2mo | $289,000 | $163 | 63 |
| 8248 Millwood Dr | 0.64mi | 3/2.0 | 1,714 (+5%) | 1mo | $377,000 | $220 | 61 |
| 13009 Sandburst Ln | 0.55mi | 3/2.0 | 1,504 (-8%) | 1mo | $332,900 | $221 | 61 |
| 13646 Schlee Ct | 0.51mi | 3/2.0 | 1,809 (+11%) | 2mo | $281,500 | $156 | 57 |
| 8108 Rumford Ct | 0.71mi | 3/2.0 | 1,773 (+9%) | 0mo | $275,000 | $155 | 52 |
| 13842 Greyhawk Ct | 0.73mi | 2/2.0 (-1) | 1,822 (+12%) | 2mo | $313,000 | $172 | 40 |
Match score weights: distance 35% · size 25% · config 20% · recency 20%. Top-matched comps best support the ARV.
Projected returns pro-forma
-3.0% appreciation · 0.0% rent growth · sell at horizon
- IRR
- -12.7%
- Equity multiple
- 0.55×
- Total profit
- $-28,649
- Equity at exit
- $34,145
- IRR
- -8.5%
- Equity multiple
- 0.53×
- Total profit
- $-29,849
- Equity at exit
- $19,800
Cash invested: $64,120 (down + closing). Projections, not guarantees.
Landlord ↔ Tenant lean methodology
- Overall (STATE)
- 87 Strongly Landlord-Friendly
- State Florida
- 87 Strongly Landlord-Friendly · R+3
- County
- — inherits STATE
- City
- — inherits STATE
ZIP-level market 34667
- Rents YoY
- -2.3%
- Active inventory
- 790
- Price-to-rent
- 9.3×
Monthly cashflow live
- Estimated rent
- $2,062 high interval (Pro) →
- Mortgage (P&I)
- −$1,201
- Tax from tax record
- −$73 /mo · $881/yr
- Insurance
- −$95
- HOA
- −$30
- Vacancy / Maint / Mgmt
- −$433
- Net cashflow
- $229
Break-even live
UW: 25.0% down · 7.5% · 30yr · 1.5% tax · 5.0% vac · 8.0% maint · 8.0% mgmt
Financing live
Cash to close
- Down payment
- $57,250
- Closing costs
- $6,870
- Reserves months
- —
- Total cash needed
- —
Loan-product check · same deal, 3 products live
Conventional
25% down · 7.5% · 30yr
- Down + closing
- —
- Monthly P&I
- —
- Monthly cashflow
- —
- DSCR
- —
- Eligible?
- —
Personal DTI + credit; lowest rate.
DSCR
20% down · 8.5% · 30yr
- Down + closing
- —
- Monthly P&I
- —
- Monthly cashflow
- —
- DSCR
- —
- Eligible?
- —
No personal income docs; deal must DSCR.
Hard money
10% down · 12.0% · 12mo
- Down + closing
- —
- Monthly P&I
- —
- Monthly cashflow
- —
- DSCR
- —
- Eligible?
- —
Short-term bridge; refi at stabilization.
Rent comps 16 comps
| Address | Beds | Baths | Sqft | Rent | $/sqft | DOM | Units | Dist |
|---|---|---|---|---|---|---|---|---|
| 13220 Whaler Dr Hudson, FL | 3.0 | 2.0 | 1566 | $1,990 | $1.27 | 24d | 1 | 0.20mi |
| 8811 Seeley Ln Hudson, FL | 3.0 | 2.0 | 1981 | $1,895 | $0.96 | 17d | 1 | 0.34mi |
| 13642 Dunwoody Ct Hudson, FL | 3.0 | 2.0 | 1720 | $2,295 | $1.33 | 16d | 1 | 0.41mi |
| 13102 Pembrook Ct Hudson, FL | 2.0 | 2.0 | 1221 | $1,575 | $1.29 | 24d | 1 | 0.42mi |
| 13013 Sawmill Way Hudson, FL | 2.0 | 2.0 | 1519 | $1,790 | $1.18 | 5d | 1 | 0.47mi |
| 13121 Shadberry Ln Hudson, FL | 3.0 | 2.0 | 1771 | $1,889 | $1.07 | 2d | 1 | 0.52mi |
| 8826 Medalist Ct Hudson, FL | 4.0 | 2.0 | 2055 | $2,900 | $1.41 | 17d | 1 | 0.55mi |
| 8305 Sandwedge Cir Unit A Hudson, FL | 2.0 | 2.0 | 1144 | $1,450 | $1.27 | 21d | 1 | 0.75mi |
| 9723 Tom St Hudson, FL | 2.0 | 1.0 | 1152 | $1,200 | $1.04 | 17d | 1 | 0.87mi |
| 14420 Pimberton Dr Hudson, FL | 3.0 | 2.0 | 1735 | $2,000 | $1.15 | 24d | 1 | 1.02mi |
| 8312 Mill Creek Ln Hudson, FL | 2.0 | 2.0 | 1152 | $1,600 | $1.39 | 24d | 1 | 1.15mi |
| 14144 Whitecap Ave Hudson, FL | 3.0 | 2.0 | 1594 | $2,450 | $1.54 | 20d | 1 | 1.22mi |
| 14709 Shadowwood Blvd Hudson, FL | 2.0 | 2.0 | 1568 | $1,699 | $1.08 | 5d | 1 | 1.28mi |
| 14611 Ivy Chase Ln Hudson, FL | 2.0–3.0 | 1.0–2.0 | 1021 | $1,450 | $1.42 | 24d | 4 | 1.28mi |
| 12215 Meadowbrook Ln Hudson, FL | 2.0 | 2.0 | 1519 | $1,850 | $1.22 | 23d | 1 | 1.35mi |
| 9734 Highland Ridge Dr Hudson, FL | 3.0 | 2.0 | 1505 | $2,195 | $1.46 | 24d | 1 | 1.44mi |
HOA detail
- Monthly dues
- $30 · $360/yr
Listing history 3 events
-
2026-05-13status Pending
-
2026-05-08$229,000 Active
-
1999-02-11soldstatus $87,000
ⓘ Source: listings_history table (triggers on properties + properties_extension) + one-shot
backfill from property_details.listing_events for pre-trigger history.
Tax reassessment forecast FL · Resets to sale price
- Current annual tax
- $881 · $73/mo
- Projected year-2 tax
- $1,901 · $158/mo
- Expected delta
- +$1,020/yr (+$85/mo · 115.8%)
ⓘ Screening estimate from a state-policy table — verify with the county assessor before closing.
Climate risk First Street
- Flood 3/10 Moderate FEMA zone X (unshaded) · 20% chance over 30 yrs
- Wildfire 1/10 Low
- Heat 10/10 Extreme 7 d/yr ≥108°F today · 24 d/yr by 30 yrs out
- Wind 10/10 Extreme 99% chance of damaging wind over 30 yrs
- Air quality 2/10 Low 2 unhealthy d/yr today · 2 by 30 yrs out
Nearby sold comps map
Loading sold comps map…
Walkable amenities ~0.75 mi
Loading nearby amenities…
Taxation est. · year 1
- Rental income
- $24,739
- − Mortgage interest
- −$12,828
- − Property taxes
- −$881
- − Insurance
- −$1,145
- − Repairs & maintenance
- −$1,979
- − Management
- −$1,979
- − HOA
- −$360
- − Depreciation
- −$6,662
- Taxable loss
- −$1,094
- Est. tax savings @ 24.0%
- +$263
- After-tax cash flow
- $3,010/yr
For passive investors: Depreciation is non-cash, so a rental often shows a tax loss while cash-flowing — sheltering income. Rental losses are passive: they offset passive income freely, and up to $25,000/yr can offset ordinary (W-2) income if you actively participate and your MAGI is under $100k (phasing out to $0 by $150k); unused losses carry forward. On sale, claimed depreciation is recaptured at up to 25%, and gains may owe capital-gains tax (a 1031 exchange can defer both). Figures are a year-1 estimate at your 24.0% rate — not tax advice; consult a CPA.
Schools (NCES district)
- District
- Pasco
- NCES district ID
- 1201530
- Math proficiency
- 50% ▼ -10.00%
- Reading proficiency
- 52% ▼ -5.00%
- Median HH income
- $45,039
- Composite
- 43.14/100
- National rank
- #3074
- State rank
- #32 of 73 in FL
Livability — Hudson
- Score
- 74/100
- State rank
- #289
- US rank
- #4856
Category grades
Schools grade is shown separately in the Schools card above.
Census & demographics
- Census place
- Hudson, FL
- County
- Pasco County · 524,098 people
- City population
- 45,307
- Metro
- Tampa-St. Petersburg-Clearwater, FL
- Population (ZIP)
- 30,689
- Household income
- $51,280
- Rent vs Own
- Severe rent burden
- 946.0
Population outlook (Pasco County) Hauer SSP2
- Today (2025)
- 570,045 people
- By 2030
- 605,844 · +6.3%
- By 2040
- 674,806 · +18.4%
- By 2050
- 736,022 · +29.1%
- By 2075
- 862,900 · +51.4%
- By 2100
- 906,364 · +59.0%
Race, ethnicity, and origin ACS 2023
- Neighborhood character
- Predominantly White (86%)
- Race & ethnicity
- White 86% Hispanic / Latino 7% Two or more races 6% Black 2% Asian 2%
- Hispanic origin (detail)
- Mexican 1% Puerto Rican 2%
- Common ancestry
- Romanian 4% Lithuanian 3% Slovak 2%
- Foreign-born
- 7% · Canada, Jamaica, Vietnam
- Languages at home
- 91% English-only · Spanish 5% Other Indo-European 2% French/Haitian/Cajun 0%
Political lean MEDSL · Pasco
- 2024 margin
- Strong R (+25.2) · D 36.9% · R 62.1% · Other 1.0%
- 2008→2024 swing
- -21.6pp toward R · 2008: -3.6pp · 2024: -25.2pp
- All cycles
- 2024: R+25.2 2020: R+20.1 2016: R+21.6 2012: R+6.7 2008: R+3.6
Not yet ingested
- Civics
- —
Market trends
- HPI YoY
- ▼ -183.96%
- Current HPI
- 307.5552
- Rent YoY
- ▼ -2.26%
- Metro
- Tampa-St. Petersburg-Clearwater, FL
- State GDP YoY
- ▲ 3.28%
- F500 in state
- 36
Industry mix (Fortune 500 HQ in FL)
| Industry | F500 HQs | Revenue |
|---|---|---|
| Industrial Technology | 2 | $29B |
|
||
| Insurance | 2 | $17B |
|
||
| Retail | 1 | $60B |
|
||
| Technology Distribution | 1 | $58B |
|
||
| Homebuilding | 1 | $35B |
|
||
| Technology Manufacturing | 1 | $35B |
|
||
Price history
+163.2% since first listed3 events — show timeline
- 2026-05-13 Pending — Stellar MLS as Distributed by MLS Grid
- 2026-05-08 Listed $229,000 Stellar MLS as Distributed by MLS Grid
- 1999-02-11 Sold (Public Records) $87,000 Public Records
Property tax history
+2.2%/yrLatest (2025): $881 · +4.0% YoY. Source: county tax records.
Cash-flow waterfall
monthlySold comps — $/sqft
last 12 mo · ≤1 miLoading sold comps…