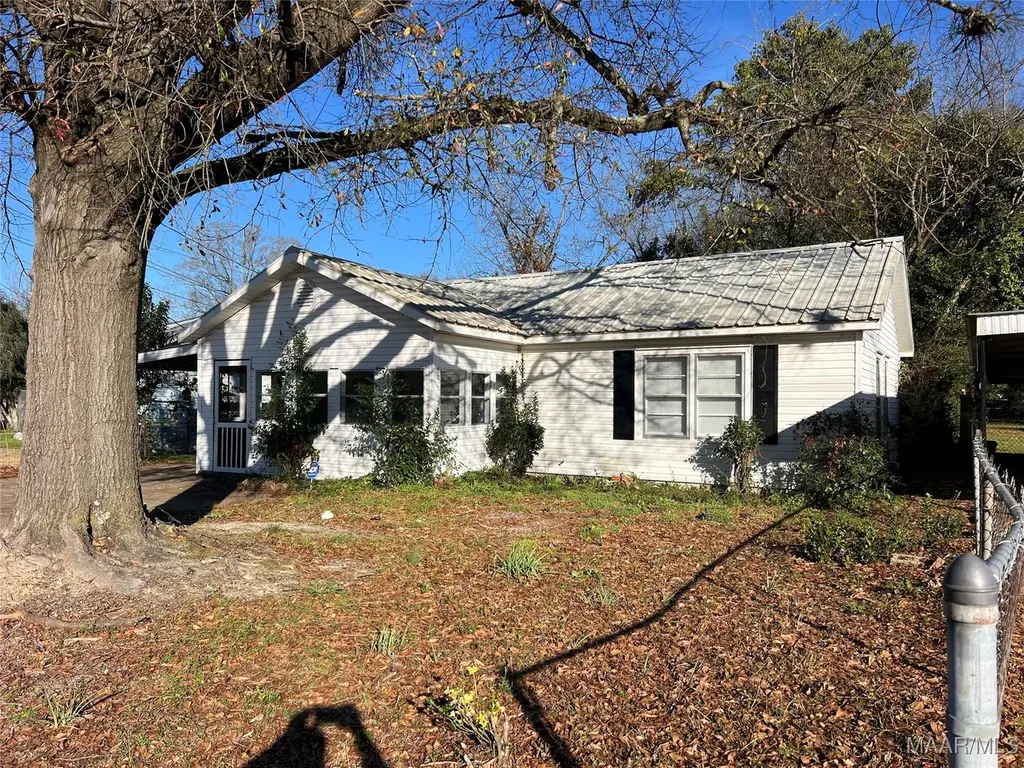
3462 East St · Montgomery, AL
Flood risk 6/10 · Moderate
- FEMA flood zone
- X (unshaded)
- Chance of flooding over 30 yrs
- 0.72%
- Est. flood insurance / yr
- $507 – $1,088
Fire risk 2/10 · Minimal
- Est. fire insurance / yr
- $916 – $1,700
Heat risk 7/10 · Major
- Hot days now (above 107°F)
- 7 days/yr
- Hot days in 30 yrs
- 18 days/yr
Wind risk 8/10 · Major
- Chance of severe wind over 30 yrs
- 80.0%
Air-quality risk 3/10 · Minor
- Unhealthy air days now
- 4 days/yr
- Unhealthy air days in 30 yrs
- 4 days/yr
Risk factors via First Street. Map © Google.
Why this score? — see what drove the B- grade
The composite is a weighted blend of 9 inputs, each scored 0–100. Each bar is that input's sub-score; the figure is the points it added to the 100-point composite (weight × sub-score).
- Cash flow +30.0/30.0
- DSCR +10.0/10.0
- 1% rule +8.6/10.0
- ARV discount +7.5/15.0
- Livability +3.2/5.0
- Rent growth +2.5/5.0
- Condition / age +2.5/5.0
- Schools +1.7/10.0
- Appreciation +0.0/10.0
$72,000
🖨 Deal sheet 📄 Offer letter ✓ Due diligence
Listing remarks MLS
Newly renovated and leased at $915/month. Step away from the worries of finding a property to purchase, completing the renovations, finding a tenant and earning passive income. This property has it all already and upon purchasing it - you will be collecting rental income of $915 per month. Add to your passive income by contacting your favorite REALTOR and lets get this one added to your portfolio. This home and 423 Buford Street, Montgomery, AL. - currently leased to a long term tenant at $600 per month are being offered as a package at an affordable price of $146,000.
Key facts
- Parking
- Built 1954
- Listed 154 days
Neighborhood map
What this means for you Summary
Snapshot
- This is a 2-bed/1.0-bath single-family listed at $72k.
Deal economics
- At list price, monthly cash flow is $335 ($4k/yr) — positive.
- The deal already cash-flows at list — no discount required.
- Meets the 1% rule at list price ($983 rent vs $72k).
- Recommended offer: $63k (12.0% below list) — sets the bar for market timing.
- Cap rate 11.9% vs local median 6.0% in Montgomery — top-decile yield for the area; either an underpriced asset or a hidden risk that comps aren't pricing in. Stress-test before assuming the spread holds.
Location & tenants
- Location reads 65/100 on livability (#138 in AL) — a middle-class / working-renter tenant base. Strengths: cost of living A+, housing A+; Watch: schools C-, employment D, crime F.
- Montgomery County (urban): math 9% / reading 31% proficiency, ranked #106 of 129 in AL (top 82%) — low school quality limits family demand, transient renter base, plan for 1-2y turnover; 70% free/reduced lunch — lower-income household profile, screen leases tightly.
- Market conditions: 62 active listings in the ZIP; 32 comparable units currently listed for rent nearby; rentals lingering (median 44d on market — plan ~5-8 weeks vacancy on turnover, expect pricing pressure); 66% of comp listings sitting > 30 days — soft ceiling on asking rent; 460 units permitted in Montgomery County in 2024 (37 in 5+ unit buildings).
Forward outlook
- Local home prices are declining (-3.0%/yr); year-one equity from $498 of loan paydown is wiped out by about $2k of value loss. Plan a longer hold.
- Montgomery County population projected to shrink 8% by 2050 — rents likely to lag national; underwrite the cash flow, not the appreciation.
- At projected returns (-3.0% appreciation + 3.0% rent growth), your $20k cash investment doubles in ~7 years — after that, you're playing with house money.
Negotiation context
- It's been on market 154 days — a 12% lower offer ($63k) is reasonable based on typical stale-listing flexibility.
- 3 sale attempts since 17y ago; this cycle's ask has dropped $7k (9%) from the opening price — seller is motivated, your offer sets the floor, not the list.
- Current owner paid $52k; 38% above their basis — modest negotiation headroom, anchor on the comps not their cost.
Risks & watch-outs
- Watch-outs: built in 1954 — expect roof / HVAC / electrical / plumbing capex.
- Climate carrying-cost: major flood risk; severe wind risk, 80% chance of damaging wind over 30y; extreme-heat days projected 7→18/yr by 2055 (HVAC capex compounding) — expect insurance premiums to compound above CPI over the hold.
Questions for the listing agent
- It's been on market 154 days. Have you received any prior offers? Is the seller open to a 12% concession, seller financing, or rate buy-down credit?
- Built in 1954 — when were the roof, HVAC, electrical panel, plumbing, and water heater last replaced?
- Why hasn't it sold? Are there any deal-killer items the seller is aware of (foundation, flood, title, zoning, code violations)?
- Is there a deadline driving the sale (1031 exchange, divorce, estate, relocation)? That informs how much negotiation room exists.
- Crime grade is F in this area — have there been break-ins, vandalism, or insurance claims at this property in the last 3 years? What carrier currently insures it and at what premium?
- What's the average days-on-market for RENTAL listings here right now (not sales)? A rising rental-DOM trend means longer vacancies and softer asking-rent achievability than the comps imply.
- What's the recent tenant-quality profile in this submarket — average credit score on applications, eviction rate, late-payment / NSF rate, and stable-employment percentage? A property-management company in the area should have these aggregated.
- How much new for-sale + rental construction is in the pipeline within 1–3 miles? Heavy new supply typically softens prices + rents 12–24 months out; constrained supply supports both.
Investment metrics
- 1% rule
- 1.36% ✓
- Cap rate
- 11.88%
- Cash-on-cash
- 19.97%
- DSCR
- 1.89
- GRM
- 6.1
CMA / ARV
- ARV (median comp)
- $46,277
- List price
- $72,000
- Delta
- 55.59%
- Verdict
- OVERPRICED
- Comps
- 20 within 1.0 mi
Show comp detail 12 sales within ~0.75 mi
| Address | Dist | Beds/Ba | Sqft | Sold | Price | $/sf | Match |
|---|---|---|---|---|---|---|---|
| 3915 Fairground Rd | 0.38mi | 2/1.0 | 792 (0%) | 6mo | $39,500 | $50 | 77 |
| 298 Broadway St | 0.15mi | 2/1.0 | 896 (+13%) | 2mo | $36,000 | $40 | 70 |
| 341 Chisholm St | 0.25mi | 3/1.0 (+1) | 756 (-4%) | 11mo | $33,500 | $44 | 67 |
| 462 E Park Ave | 0.37mi | 2/1.0 | 755 (-5%) | 14mo | $12,000 | $16 | 63 |
| 1625 Champion St | 0.49mi | 3/1.0 (+1) | 840 (+6%) | 0mo | $72,500 | $86 | 62 |
| 1930 Rigby St | 0.28mi | 2/1.0 | 864 (+9%) | 14mo | $11,500 | $13 | 60 |
| 1818 Rigby St | 0.45mi | 3/1.0 (+1) | 832 (+5%) | 7mo | $26,500 | $32 | 59 |
| 3463 Cotton St | 0.43mi | 3/1.0 (+1) | 829 (+5%) | 10mo | $37,500 | $45 | 59 |
| 121 Kiwanis St | 0.62mi | 3/1.0 (+1) | 735 (-7%) | 1mo | $27,000 | $37 | 54 |
| 2056 Amos St | 0.68mi | 3/1.0 (+1) | 812 (+2%) | 9mo | $65,000 | $80 | 52 |
| 1703 Gibson St | 0.51mi | 2/1.0 | 868 (+10%) | 13mo | $26,000 | $30 | 50 |
| 245 Gardendale Dr | 0.36mi | 3/1.0 (+1) | 900 (+14%) | 14mo | $20,000 | $22 | 44 |
Match score weights: distance 35% · size 25% · config 20% · recency 20%. Top-matched comps best support the ARV.
Projected returns pro-forma
-3.0% appreciation · 3.0% rent growth · sell at horizon
- IRR
- 12.1%
- Equity multiple
- 1.48×
- Total profit
- $9,677
- Equity at exit
- $10,735
- IRR
- 21.0%
- Equity multiple
- 2.78×
- Total profit
- $35,855
- Equity at exit
- $6,225
Cash invested: $20,160 (down + closing). Projections, not guarantees.
Landlord ↔ Tenant lean methodology
- Overall (STATE)
- 90 Strongly Landlord-Friendly
- State Alabama
- 90 Strongly Landlord-Friendly · R+15
- County
- — inherits STATE
- City
- — inherits STATE
ZIP-level market 36110
- Home prices YoY
- -34.8%
- Active inventory
- 62
- Price-to-rent
- 6.1×
Monthly cashflow live
- Estimated rent
- $983 high interval (Pro) →
- Mortgage (P&I)
- −$378
- Tax from tax record
- −$33 /mo · $400/yr
- Insurance
- −$30
- HOA
- −$0
- Vacancy / Maint / Mgmt
- −$206
- Net cashflow
- $335
Break-even live
UW: 25.0% down · 7.5% · 30yr · 1.5% tax · 5.0% vac · 8.0% maint · 8.0% mgmt
Financing live
Cash to close
- Down payment
- $18,000
- Closing costs
- $2,160
- Reserves months
- —
- Total cash needed
- —
Loan-product check · same deal, 3 products live
Conventional
25% down · 7.5% · 30yr
- Down + closing
- —
- Monthly P&I
- —
- Monthly cashflow
- —
- DSCR
- —
- Eligible?
- —
Personal DTI + credit; lowest rate.
DSCR
20% down · 8.5% · 30yr
- Down + closing
- —
- Monthly P&I
- —
- Monthly cashflow
- —
- DSCR
- —
- Eligible?
- —
No personal income docs; deal must DSCR.
Hard money
10% down · 12.0% · 12mo
- Down + closing
- —
- Monthly P&I
- —
- Monthly cashflow
- —
- DSCR
- —
- Eligible?
- —
Short-term bridge; refi at stabilization.
Rent comps 32 comps
| Address | Beds | Baths | Sqft | Rent | $/sqft | DOM | Units | Dist |
|---|---|---|---|---|---|---|---|---|
| 298 Broadway St Montgomery, AL | 2.0 | 1.0 | 896 | $900 | $1.00 | 43d | 1 | 0.12mi |
| 2107 Yarbrough Cir Montgomery, AL | 3.0 | 1.0 | 910 | $925 | $1.02 | 43d | 1 | 0.17mi |
| 218 Broadway St Montgomery, AL | 2.0 | 1.0 | 960 | $895 | $0.93 | 13d | 1 | 0.19mi |
| 2111 Yarbrough St Montgomery, AL | 3.0 | 1.0 | 962 | $795 | $0.83 | 43d | 1 | 0.20mi |
| 341 Chisholm St Montgomery, AL | 3.0 | 1.0 | 756 | $1,195 | $1.58 | 20d | 1 | 0.21mi |
| 3329 Texas St Montgomery, AL | 3.0 | 1.0 | 1000 | $1,100 | $1.10 | 43d | 1 | 0.23mi |
| 216 Gardendale Dr Montgomery, AL | 3.0 | 1.0 | 900 | $850 | $0.94 | 20d | 1 | 0.35mi |
| 4010 Vandiver Ct Montgomery, AL | 2.0 | 2.0 | 630 | $1,050 | $1.67 | 43d | 1 | 0.39mi |
| 4029 Chelsea Dr Montgomery, AL | 3.0 | 1.0 | 1000 | $1,200 | $1.20 | 43d | 1 | 0.42mi |
| 3114 Cotton St Montgomery, AL | 3.0 | 1.0 | 888 | $1,100 | $1.24 | 43d | 1 | 0.51mi |
| 1817 Texas Ct Montgomery, AL | 3.0 | 1.0 | 925 | $1,050 | $1.14 | 20d | 1 | 0.55mi |
| 2056 Midway St Montgomery, AL | 3.0 | 1.0 | 1110 | $985 | $0.89 | 43d | 1 | 0.58mi |
| 2076 Midway St Montgomery, AL | 3.0 | 1.0 | 1068 | $1,000 | $0.94 | 43d | 1 | 0.58mi |
| 3042 George B Edmondson Dr Montgomery, AL | 3.0 | 1.0 | 900 | $860 | $0.96 | 43d | 1 | 0.64mi |
| 16 Garden St Montgomery, AL | 3.0 | 1.5 | 1008 | $775 | $0.77 | 44d | 1 | 0.73mi |
| 207 Destin St Montgomery, AL | 3.0 | 1.0 | 966 | $695 | $0.72 | 20d | 1 | 0.81mi |
| 3613 Erwin Dr Montgomery, AL | 3.0 | 2.0 | 1092 | $1,250 | $1.14 | 43d | 1 | 0.82mi |
| 412 Edward St Montgomery, AL | 3.0 | 1.0 | 828 | $800 | $0.97 | 43d | 1 | 0.96mi |
| 429 Edward St Montgomery, AL | 3.0 | 1.0 | 828 | $1,080 | $1.30 | 13d | 1 | 0.96mi |
| 1324 Federal Dr Montgomery, AL | 2.0 | 1.0 | 1000 | $1,100 | $1.10 | 43d | 1 | 1.01mi |
| 142 W Michigan Ave Montgomery, AL | 3.0 | 1.0 | 840 | $995 | $1.18 | 13d | 1 | 1.02mi |
| 2503 Skyline Ave Montgomery, AL | 3.0 | 1.0 | 1015 | $1,150 | $1.13 | 43d | 1 | 1.07mi |
| 2006 Harmon St Unit 3 Montgomery, AL | 3.0 | 1.0 | 800 | $500 | $0.62 | 43d | 1 | 1.12mi |
| 105 Dyas Ct Montgomery, AL | 3.0 | 1.0 | 1025 | $1,095 | $1.07 | 43d | 1 | 1.27mi |
| 325 3rd St Montgomery, AL | 2.0 | 1.0 | 925 | $850 | $0.92 | 43d | 1 | 1.28mi |
| 3024 Tyler Rd Montgomery, AL | 3.0 | 1.0 | 892 | $725 | $0.81 | 20d | 1 | 1.28mi |
| 740 Coliseum Blvd Unit 740A Montgomery, AL | 2.0 | 1.0 | 1100 | $895 | $0.81 | 13d | 1 | 1.33mi |
| 700 Coliseum Blvd Unit 700D Montgomery, AL | 2.0 | 1.0 | 911 | $895 | $0.98 | 43d | 1 | 1.43mi |
| 3070 Tremont St Montgomery, AL | 3.0 | 1.0 | 1102 | $1,450 | $1.32 | 43d | 1 | 1.45mi |
| 408 Briarbrook Dr #204 Montgomery, AL | 3.0 | 2.0 | 1025 | $1,000 | $0.98 | 43d | 1 | 1.48mi |
| 408 Briarbrook Dr Montgomery, AL | 3.0 | 2.0 | 1025 | $960 | $0.94 | 20d | 1 | 1.48mi |
| 3090 Alabama River Pkwy Montgomery, AL | 1.0 | 1.0 | 986 | $1,100 | $1.12 | 13d | 1 | 1.48mi |
Listing history 24 events
-
2026-06-18days on market $72,000 Active 154 DOM
-
2026-06-17days on market $72,000 Active 153 DOM
-
2026-06-16days on market $72,000 Active 152 DOM
-
2026-06-15days on market $72,000 Active 151 DOM
-
2026-06-14days on market $72,000 Active 149 DOM
-
2026-06-13days on market $72,000 Active 148 DOM
-
2026-06-10days on market $72,000 Active 146 DOM
-
2026-06-09days on market $72,000 Active 145 DOM
-
2026-06-08days on market $72,000 Active 144 DOM
-
2026-06-07days on market $72,000 Active 143 DOM
-
2026-06-03days on market $72,000 Active 139 DOM
-
2026-06-02days on market $72,000 Active 138 DOM
-
2026-06-01days on market $72,000 Active 137 DOM
-
2026-05-31days on market $72,000 Active 136 DOM
-
2026-05-30days on market $72,000 Active 135 DOM
-
2026-04-03price $72,000 575-char remark
Show marketing remark (575 chars)
Newly renovated and leased at $915/month. Step away from the worries of finding a property to purchase, completing the renovations, finding a tenant and earning passive income. This property has it all already and upon purchasing it - you will be collecting rental income of $915 per month. Add to your passive income by contacting your favorite REALTOR and lets get this one added to your portfolio. This home and 423 Buford Street, Montgomery, AL. - currently leased to a long term tenant at $600 per month are being offered as a package at an affordable price of $146,000.
-
2026-03-17price $77,000 575-char remark
Show marketing remark (575 chars)
Newly renovated and leased at $915/month. Step away from the worries of finding a property to purchase, completing the renovations, finding a tenant and earning passive income. This property has it all already and upon purchasing it - you will be collecting rental income of $915 per month. Add to your passive income by contacting your favorite REALTOR and lets get this one added to your portfolio. This home and 423 Buford Street, Montgomery, AL. - currently leased to a long term tenant at $600 per month are being offered as a package at an affordable price of $146,000.
-
2026-01-15$79,000 Active 575-char remark
Show marketing remark (575 chars)
Newly renovated and leased at $915/month. Step away from the worries of finding a property to purchase, completing the renovations, finding a tenant and earning passive income. This property has it all already and upon purchasing it - you will be collecting rental income of $915 per month. Add to your passive income by contacting your favorite REALTOR and lets get this one added to your portfolio. This home and 423 Buford Street, Montgomery, AL. - currently leased to a long term tenant at $600 per month are being offered as a package at an affordable price of $146,000.
-
2025-02-28historical $850
-
2025-01-22$850
-
2024-10-11soldstatus $52,000
-
2024-08-12soldstatus $320,000
-
2009-04-24soldstatus $18,000 383-char remark
Show marketing remark (383 chars)
This home is one of the nicest homes in this neighborhood. It will pass an FHA or VA appraisal. Your sure to enjoy the Florida room and the enclosed front porch, also a one car carport. Purchase this home for as little as 3% down, this property is approved for HomePath Renovation Mortgage Financing. Please contact your listing agent for more information or have your agent call me.
-
2009-03-16$19,900 383-char remark
Show marketing remark (383 chars)
This home is one of the nicest homes in this neighborhood. It will pass an FHA or VA appraisal. Your sure to enjoy the Florida room and the enclosed front porch, also a one car carport. Purchase this home for as little as 3% down, this property is approved for HomePath Renovation Mortgage Financing. Please contact your listing agent for more information or have your agent call me.
ⓘ Source: listings_history table (triggers on properties + properties_extension) + one-shot
backfill from property_details.listing_events for pre-trigger history.
Tax reassessment forecast AL · Resets to sale price
- Current annual tax
- $400 · $33/mo
- Projected year-2 tax
- $400 · $33/mo
- Expected delta
- $0/yr ($0/mo · 0.0%)
ⓘ Screening estimate from a state-policy table — verify with the county assessor before closing.
Climate risk First Street
- Flood 6/10 Major FEMA zone X (unshaded) · 72% chance over 30 yrs
- Wildfire 2/10 Low
- Heat 7/10 Severe 7 d/yr ≥107°F today · 18 d/yr by 30 yrs out
- Wind 8/10 Severe 80% chance of damaging wind over 30 yrs
- Air quality 3/10 Moderate 4 unhealthy d/yr today · 4 by 30 yrs out
Nearby sold comps map
Loading sold comps map…
Walkable amenities ~0.75 mi
Loading nearby amenities…
Taxation est. · year 1
- Rental income
- $11,792
- − Mortgage interest
- −$4,033
- − Property taxes
- −$400
- − Insurance
- −$360
- − Repairs & maintenance
- −$943
- − Management
- −$943
- − Depreciation
- −$2,095
- Taxable income
- $3,018
- Est. tax owed @ 24.0%
- −$724
- After-tax cash flow
- $3,301/yr
For passive investors: Depreciation is non-cash, so a rental often shows a tax loss while cash-flowing — sheltering income. Rental losses are passive: they offset passive income freely, and up to $25,000/yr can offset ordinary (W-2) income if you actively participate and your MAGI is under $100k (phasing out to $0 by $150k); unused losses carry forward. On sale, claimed depreciation is recaptured at up to 25%, and gains may owe capital-gains tax (a 1031 exchange can defer both). Figures are a year-1 estimate at your 24.0% rate — not tax advice; consult a CPA.
Schools (NCES district)
- District
- Montgomery County
- NCES district ID
- 0102430
- Math proficiency
- 9% ▼ -21.00%
- Reading proficiency
- 31% ▼ -1.00%
- Median HH income
- $43,902
- Composite
- 17.24/100
- National rank
- #9093
- State rank
- #106 of 129 in AL
Livability — Montgomery
- Score
- 65/100
- State rank
- #138
- US rank
- #13416
Category grades
Schools grade is shown separately in the Schools card above.
Census & demographics
- Census place
- Montgomery, AL
- County
- Montgomery County · 190,016 people
- City population
- 175,913
- Metro
- Montgomery, AL
- Population (ZIP)
- 12,102
- Household income
- $47,315
- Rent vs Own
- Severe rent burden
- 753.0
Population outlook (Montgomery County) Hauer SSP2
- Today (2025)
- 224,008 people
- By 2030
- 221,460 · -1.1%
- By 2040
- 214,179 · -4.4%
- By 2050
- 204,912 · -8.5%
- By 2075
- 177,821 · -20.6%
- By 2100
- 145,134 · -35.2%
Race, ethnicity, and origin ACS 2023
- Neighborhood character
- Predominantly Black (83%)
- Race & ethnicity
- Black 83% White 11% Two or more races 3% Asian 2% Hispanic / Latino 1%
- Common ancestry
- Hispanic 1%
- Foreign-born
- 2% · China, Canada
- Languages at home
- 96% English-only · Spanish 2% Other Asian/Pacific 1%
Political lean MEDSL · Montgomery
- 2024 margin
- Solid D (+30.7) · D 64.8% · R 34.1% · Other 1.1%
- 2008→2024 swing
- +11.5pp toward D · 2008: 19.2pp · 2024: 30.7pp
- All cycles
- 2024: D+30.7 2020: D+31.5 2016: D+26.2 2012: D+24.3 2008: D+19.2
Not yet ingested
- Civics
- —
Market trends
- HPI YoY
- ▼ -35.37%
- Current HPI
- 66.3114
- Rent YoY
- —
- Metro
- Montgomery, AL
- State GDP YoY
- ▲ 2.94%
- F500 in state
- 4
Industry mix (Fortune 500 HQ in AL)
| Industry | F500 HQs | Revenue |
|---|---|---|
| Financial Services | 1 | $8B |
|
||
| Healthcare | 1 | $5B |
|
||
Price history
+261.8% since first listed9 events — show timeline
- 2026-04-03 Price Changed $72,000 MAAR
- 2026-03-17 Price Changed $77,000 MAAR
- 2026-01-15 Listed $79,000 MAAR
- 2025-02-28 Rental Removed $850 APPFOLIO
- 2025-01-22 Listed for Rent $850 APPFOLIO
- 2024-10-11 Sold (Public Records) $52,000 Public Records
- 2024-08-12 Sold (Public Records) $320,000 Public Records
- 2009-04-24 Sold (MLS) $18,000 MAAR
- 2009-03-16 Listed $19,900 MAAR
Property tax history
+8.1%/yrLatest (2025): $400 · +1.2% YoY. Source: county tax records.
Cash-flow waterfall
monthlySold comps — $/sqft
last 12 mo · ≤1 miLoading sold comps…