 Duplex
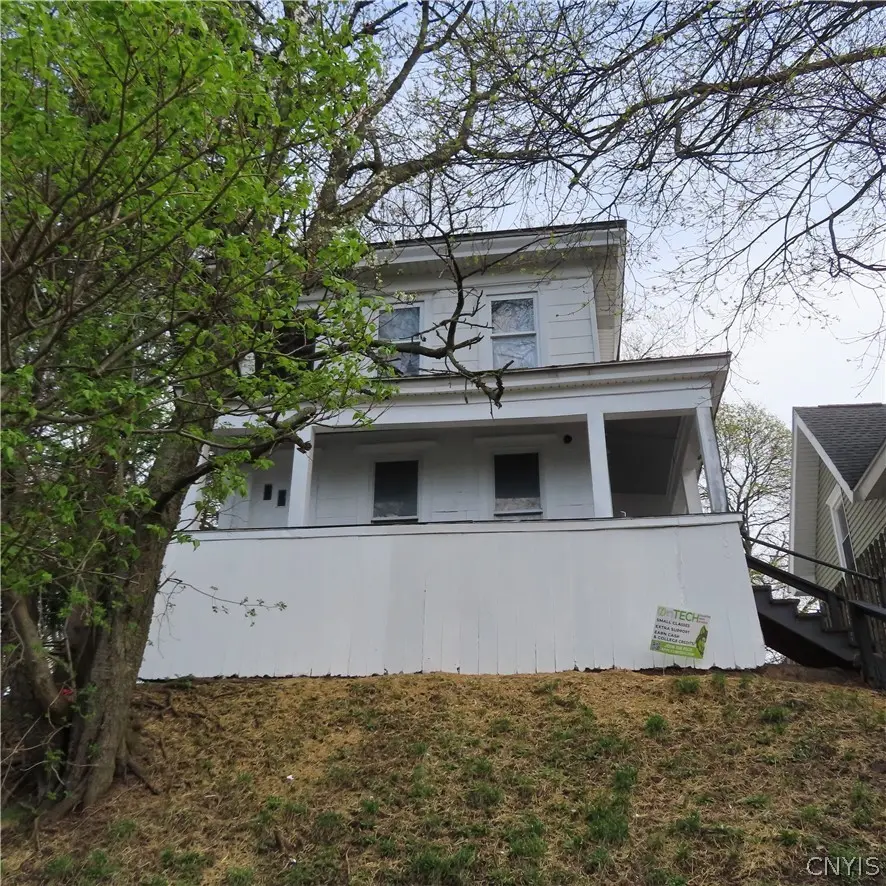
306 Shuart Ave · Syracuse, NY
Flood risk 1/10 · Minimal
- FEMA flood zone
- X (unshaded)
- Chance of flooding over 30 yrs
- 0.0%
- Est. flood insurance / yr
- $473 – $860
Fire risk 1/10 · Minimal
- Est. fire insurance / yr
- $691 – $1,283
Heat risk 3/10 · Minor
- Hot days now (above 94°F)
- 7 days/yr
- Hot days in 30 yrs
- 15 days/yr
Wind risk 1/10 · Minimal
- Chance of severe wind over 30 yrs
- 0.0%
Air-quality risk 2/10 · Minimal
- Unhealthy air days now
- 0 days/yr
- Unhealthy air days in 30 yrs
- 1 days/yr
Risk factors via First Street. Map © Google.
Why this score? — see what drove the B+ grade
The composite is a weighted blend of 9 inputs, each scored 0–100. Each bar is that input's sub-score; the figure is the points it added to the 100-point composite (weight × sub-score).
- Cash flow +30.0/30.0
- ARV discount +14.7/15.0
- 1% rule +10.0/10.0
- DSCR +10.0/10.0
- Rent growth +4.6/5.0
- Livability +3.9/5.0
- Condition / age +2.5/5.0
- Schools +1.8/10.0
- Appreciation +0.0/10.0
$235,000
🖨 Deal sheet 📄 Offer letter ✓ Due diligence
Multi-family units
County records classify this as Multi-Family (2-4 Unit). Listing-text estimate: 2 units. confirmed
Listing remarks MLS
Well maintained 2-family between Lincoln Park & Eastwood area. Property has been remodeled with new flooring throughout, new kitchens, new bathrooms & new appliances. First floor has been rented for $1650/month & upstairs tenants are paying $1550/month. Separate utilities. Turn key operation and great investment opportunity with over 13% cash on cash return. Some photos have been virtually staged.
Key facts
- Remodeled
- New kitchens
- Turn key operation
Tags
Neighborhood map
What this means for you Summary
Snapshot
- This is a 2 × 3-bed/1.0-bath units multifamily listed at $235k.
Deal economics
- At list price, monthly cash flow is $1k ($16k/yr) — positive. Per door: $678/mo.
- The deal already cash-flows at list — no discount required.
- Meets the 1% rule at list price ($4k rent vs $235k).
- Recommended offer: $207k (12.0% below list) — sets the bar for market timing.
- Cap rate 13.2% vs local median 8.2% in Syracuse — top-decile yield for the area; either an underpriced asset or a hidden risk that comps aren't pricing in. Stress-test before assuming the spread holds.
Location & tenants
- Location reads 77/100 on livability (#187 in NY, #2,869 nationally) — a middle-class / working-renter tenant base. Strengths: amenities A+, commute A+, cost of living A+; Watch: schools D+, crime F, employment D-.
- Syracuse City School District (urban): math 18% / reading 26% proficiency, ranked #590 of 590 in NY (top 100%) — low school quality limits family demand, transient renter base, plan for 1-2y turnover; 74% free/reduced lunch — lower-income household profile, screen leases tightly.
- Market conditions: Rents rising fast (+8.4%/yr); 55 active listings in the ZIP; 3 comparable units currently listed for rent nearby; rentals lingering (median 44d on market — plan ~5-8 weeks vacancy on turnover, expect pricing pressure); 67% of comp listings sitting > 30 days — soft ceiling on asking rent; 616 units permitted in Onondaga County in 2024 (256 in 5+ unit buildings).
- At $3,546/mo this rent would consume 91% of the median local household income ($47k/yr) (locally 1566% of renters already pay >50% of income on rent) — very limited rent-growth headroom before tenants either downsize or default.
Forward outlook
- Local home prices are declining (-3.0%/yr); year-one equity from $2k of loan paydown is wiped out by about $7k of value loss. Plan a longer hold.
- Onondaga County population projected to shrink 9% by 2050 — rents likely to lag national; underwrite the cash flow, not the appreciation.
- At projected returns (-3.0% appreciation + 8.0% rent growth), your $66k cash investment doubles in ~5 years — after that, you're playing with house money.
Negotiation context
- It's been on market 162 days — a 12% lower offer ($207k) is reasonable based on typical stale-listing flexibility.
- 2 sale attempts since 14y ago; this cycle's ask has dropped $20k (8%) from the opening price — seller is motivated, your offer sets the floor, not the list.
- Current owner paid $25k; list at $235k implies a 840% gain — meaningful room to come down on a strong offer.
Risks & watch-outs
- Watch-outs: built in 1900 — expect roof / HVAC / electrical / plumbing capex.
Questions for the listing agent
- It's been on market 162 days. Have you received any prior offers? Is the seller open to a 12% concession, seller financing, or rate buy-down credit?
- Can we see the unit-by-unit rent roll, current vacancy, and any below-market leases? What's the average tenancy length?
- What capital expenditures (roof, boiler, parking lot, exteriors) have been made in the last 5 years, and what's planned in the next 2?
- Built in 1900 — when were the roof, HVAC, electrical panel, plumbing, and water heater last replaced?
- Why hasn't it sold? Are there any deal-killer items the seller is aware of (foundation, flood, title, zoning, code violations)?
- Is there a deadline driving the sale (1031 exchange, divorce, estate, relocation)? That informs how much negotiation room exists.
- Schools are D-rated, which usually means shorter tenancies and higher turnover. Who's the typical renter profile here, and what's been the actual vacancy rate?
- Crime grade is F in this area — have there been break-ins, vandalism, or insurance claims at this property in the last 3 years? What carrier currently insures it and at what premium?
- What's the average days-on-market for RENTAL listings here right now (not sales)? A rising rental-DOM trend means longer vacancies and softer asking-rent achievability than the comps imply.
- What's the recent tenant-quality profile in this submarket — average credit score on applications, eviction rate, late-payment / NSF rate, and stable-employment percentage? A property-management company in the area should have these aggregated.
- How much new apartment / multifamily construction is in the pipeline within 1–3 miles? Heavy new supply (>2% of stock underway) typically softens rents 12–24 months out; light construction supports rent growth.
Investment metrics
- 1% rule
- 1.51% ✓
- Cap rate
- 13.21%
- Cash-on-cash
- 24.71%
- DSCR
- 2.10
- GRM
- 5.5
CMA / ARV
- ARV (median comp)
- $279,778
- List price
- $235,000
- Delta
- -16.00%
- Verdict
- UNDERPRICED
- Comps
- 20 within 1.0 mi
Show comp detail 12 sales within ~0.75 mi
| Address | Dist | Beds/Ba | Sqft | Sold | Price | $/sf | Match |
|---|---|---|---|---|---|---|---|
| 512 Boyden St | 0.38mi | 4/2.0 (-1) | 2,128 (+1%) | 6mo | $257,500 | $121 | 71 |
| 107 Craton St | 0.30mi | 5/2.0 | 2,228 (+6%) | 7mo | $280,000 | $126 | 71 |
| 263-265 Mather St | 0.32mi | 6/2.0 (+1) | 2,064 (-2%) | 7mo | $170,000 | $82 | 71 |
| 327 Robinson St | 0.23mi | 4/2.0 (-1) | 1,935 (-8%) | 0mo | $163,000 | $84 | 70 |
| 300 Helen St | 0.55mi | 5/2.0 | 2,098 (-1%) | 4mo | $165,000 | $79 | 70 |
| 932-934 Oak St | 0.58mi | 5/2.0 | 2,050 (-3%) | 2mo | $105,000 | $51 | 66 |
| 149-51 Mooney Ave | 0.29mi | 4/2.0 (-1) | 1,944 (-8%) | 9mo | $210,000 | $108 | 61 |
| 807 Burnet Ave | 0.63mi | 4/2.0 (-1) | 2,016 (-4%) | 4mo | $205,000 | $102 | 54 |
| 309 Mildred Ave #11 | 0.65mi | 4/2.0 (-1) | 2,028 (-4%) | 5mo | $220,000 | $108 | 54 |
| 501-503 Dewitt St | 0.53mi | 4/2.0 (-1) | 2,370 (+12%) | 2mo | $198,000 | $84 | 48 |
| 113 Grumbach Ave | 0.72mi | 4/2.0 (-1) | 1,888 (-10%) | 0mo | $183,000 | $97 | 44 |
| 143 Highland Ave | 0.66mi | 5/2.5 | 1,850 (-12%) | 7mo | $215,000 | $116 | 41 |
Match score weights: distance 35% · size 25% · config 20% · recency 20%. Top-matched comps best support the ARV.
Projected returns pro-forma
-3.0% appreciation · 8.0% rent growth · sell at horizon
- IRR
- 23.3%
- Equity multiple
- 2.02×
- Total profit
- $66,914
- Equity at exit
- $35,039
- IRR
- 34.2%
- Equity multiple
- 4.87×
- Total profit
- $254,471
- Equity at exit
- $20,319
Cash invested: $65,800 (down + closing). Projections, not guarantees.
Landlord ↔ Tenant lean methodology
- Overall (STATE)
- 15 Strongly Tenant-Friendly
- State New York
- 15 Strongly Tenant-Friendly · D+10
- County
- — inherits STATE
- City
- — inherits STATE
ZIP-level market 13203
- Home prices YoY
- -11.9%
- Rents YoY
- 8.4%
- Active inventory
- 55
- Price-to-rent
- 11.0×
Monthly cashflow live
- Estimated rent
- $3,546 high interval (Pro) →
- Mortgage (P&I)
- −$1,232
- Tax from tax record
- −$116 /mo · $1,391/yr
- Insurance
- −$98
- HOA
- −$0
- Vacancy / Maint / Mgmt
- −$745
- Net cashflow
- $1,355
Break-even live
2-unit breakdown (identical units grouped — click to expand)
| Units | Beds | Baths | Est. rent |
|---|---|---|---|
| 2× units | 3 | 1 | $3,546 |
| #1 | 3 | 1 | $1,773 |
| #2 | 3 | 1 | $1,773 |
| Total (2 units) | $3,546 | ||
UW: 25.0% down · 7.5% · 30yr · 1.5% tax · 5.0% vac · 8.0% maint · 8.0% mgmt
Financing live
Cash to close
- Down payment
- $58,750
- Closing costs
- $7,050
- Reserves months
- —
- Total cash needed
- —
Loan-product check · same deal, 3 products live
Conventional
25% down · 7.5% · 30yr
- Down + closing
- —
- Monthly P&I
- —
- Monthly cashflow
- —
- DSCR
- —
- Eligible?
- —
Personal DTI + credit; lowest rate.
DSCR
20% down · 8.5% · 30yr
- Down + closing
- —
- Monthly P&I
- —
- Monthly cashflow
- —
- DSCR
- —
- Eligible?
- —
No personal income docs; deal must DSCR.
Hard money
10% down · 12.0% · 12mo
- Down + closing
- —
- Monthly P&I
- —
- Monthly cashflow
- —
- DSCR
- —
- Eligible?
- —
Short-term bridge; refi at stabilization.
Rent comps 3 comps
| Address | Beds | Baths | Sqft | Rent | $/sqft | DOM | Units | Dist |
|---|---|---|---|---|---|---|---|---|
| 365 Green St Syracuse, NY | 5.0 | 3.5 | 2263 | $3,300 | $1.46 | 21d | 1 | 0.47mi |
| 746 E Laurel St Unit 1 Syracuse, NY | 4.0 | 2.0 | 1400 | $1,500 | $1.07 | 43d | 1 | 0.89mi |
| 1205 Madison St Fl -1 Syracuse, NY | 4.0 | 3.0 | 2988 | $2,640 | $0.88 | 43d | 1 | 1.07mi |
Listing history 23 events
-
2026-06-18days on market $235,000 Active 162 DOM
-
2026-06-17days on market $235,000 Active 161 DOM
-
2026-06-16days on market $235,000 Active 160 DOM
-
2026-06-15days on market $235,000 Active 159 DOM
-
2026-06-14days on market $235,000 Active 157 DOM
-
2026-06-13days on market $235,000 Active 156 DOM
-
2026-06-10days on market $235,000 Active 154 DOM
-
2026-06-09days on market $235,000 Active 153 DOM
-
2026-06-08days on market $235,000 Active 152 DOM
-
2026-06-07days on market $235,000 Active 151 DOM
-
2026-06-05days on market $235,000 Active 148 DOM
-
2026-06-02days on market $235,000 Active 146 DOM
-
2026-06-01days on market $235,000 Active 145 DOM
-
2026-05-31days on market $235,000 Active 144 DOM
-
2026-05-30days on market $235,000 Active 143 DOM
-
2026-05-04price $235,000 418-char remark
Show marketing remark (418 chars)
Well maintained 2-family between Lincoln Park & Eastwood area. Property has been remodeled with new flooring throughout, new kitchens, new bathrooms & new appliances. First floor has been rented for $1650/month & upstairs tenants are paying $1550/month. Separate utilities. Turn key operation and great investment opportunity with over 13% cash on cash return. Some photos have been virtually staged.
-
2026-03-16price $245,000 418-char remark
Show marketing remark (418 chars)
Well maintained 2-family between Lincoln Park & Eastwood area. Property has been remodeled with new flooring throughout, new kitchens, new bathrooms & new appliances. First floor has been rented for $1650/month & upstairs tenants are paying $1550/month. Separate utilities. Turn key operation and great investment opportunity with over 13% cash on cash return. Some photos have been virtually staged.
-
2026-01-07$255,000 Active 418-char remark
Show marketing remark (418 chars)
Well maintained 2-family between Lincoln Park & Eastwood area. Property has been remodeled with new flooring throughout, new kitchens, new bathrooms & new appliances. First floor has been rented for $1650/month & upstairs tenants are paying $1550/month. Separate utilities. Turn key operation and great investment opportunity with over 13% cash on cash return. Some photos have been virtually staged.
-
2012-07-05historical 164-char remark
Show marketing remark (164 chars)
Two family opportunity on the Lincoln Park area of Syracuse. Each apartment has over 1000 square feet and has three bedrooms. Call today to view this 2 family home.
-
2012-07-03soldstatus $25,000
-
2012-06-29soldstatus $25,000 164-char remark
Show marketing remark (164 chars)
Two family opportunity on the Lincoln Park area of Syracuse. Each apartment has over 1000 square feet and has three bedrooms. Call today to view this 2 family home.
-
2012-03-26$35,000 164-char remark
Show marketing remark (164 chars)
Two family opportunity on the Lincoln Park area of Syracuse. Each apartment has over 1000 square feet and has three bedrooms. Call today to view this 2 family home.
-
2001-03-02soldstatus $55,000
ⓘ Source: listings_history table (triggers on properties + properties_extension) + one-shot
backfill from property_details.listing_events for pre-trigger history.
Tax reassessment forecast NY · Partial reset (capped growth)
- Current annual tax
- $1,391 · $116/mo
- Projected year-2 tax
- $2,681 · $223/mo
- Expected delta
- +$1,290/yr (+$108/mo · 92.8%)
ⓘ Screening estimate from a state-policy table — verify with the county assessor before closing.
Climate risk First Street
- Flood 1/10 Low FEMA zone X (unshaded) · 0% chance over 30 yrs
- Wildfire 1/10 Low
- Heat 3/10 Moderate 7 d/yr ≥94°F today · 15 d/yr by 30 yrs out
- Wind 1/10 Low 0% chance of damaging wind over 30 yrs
- Air quality 2/10 Low 0 unhealthy d/yr today · 1 by 30 yrs out
Nearby sold comps map
Loading sold comps map…
Walkable amenities ~0.75 mi
Loading nearby amenities…
Taxation est. · year 1
- Rental income
- $42,552
- − Mortgage interest
- −$13,164
- − Property taxes
- −$1,391
- − Insurance
- −$1,175
- − Repairs & maintenance
- −$3,404
- − Management
- −$3,404
- − Depreciation
- −$6,836
- Taxable income
- $13,178
- Est. tax owed @ 24.0%
- −$3,163
- After-tax cash flow
- $13,099/yr
For passive investors: Depreciation is non-cash, so a rental often shows a tax loss while cash-flowing — sheltering income. Rental losses are passive: they offset passive income freely, and up to $25,000/yr can offset ordinary (W-2) income if you actively participate and your MAGI is under $100k (phasing out to $0 by $150k); unused losses carry forward. On sale, claimed depreciation is recaptured at up to 25%, and gains may owe capital-gains tax (a 1031 exchange can defer both). Figures are a year-1 estimate at your 24.0% rate — not tax advice; consult a CPA.
Schools (NCES district)
- District
- Syracuse City School District
- NCES district ID
- 3628590
- Math proficiency
- 18% ▼ -5.00%
- Reading proficiency
- 26% ▬ 0.00%
- Median HH income
- $32,097
- Composite
- 17.83/100
- National rank
- #9007
- State rank
- #590 of 590 in NY
Livability — Syracuse
- Score
- 77/100
- State rank
- #187
- US rank
- #2869
Category grades
Schools grade is shown separately in the Schools card above.
Census & demographics
- Census place
- Syracuse, NY
- County
- Onondaga County · 247,257 people
- City population
- 152,627
- Metro
- Syracuse, NY
- Population (ZIP)
- 16,180
- Household income
- $46,997
- Rent vs Own
- Severe rent burden
- 1566.0
Population outlook (Onondaga County) Hauer SSP2
- Today (2025)
- 467,894 people
- By 2030
- 463,381 · -1.0%
- By 2040
- 447,697 · -4.3%
- By 2050
- 426,399 · -8.9%
- By 2075
- 373,661 · -20.1%
- By 2100
- 307,967 · -34.2%
Race, ethnicity, and origin ACS 2023
- Neighborhood character
- Diverse neighborhood (Simpson 0.67)
- Race & ethnicity
- White 52% Black 22% Hispanic / Latino 11% Two or more races 9% Asian 7%
- Hispanic origin (detail)
- Puerto Rican 6% Cuban 2%
- Common ancestry
- Romanian 3% Lithuanian 2% Iranian 2%
- Foreign-born
- 13% · Canada, India, Philippines
- Languages at home
- 81% English-only · Spanish 6% Other Indo-European 3% Other Asian/Pacific 3%
Political lean MEDSL · Onondaga
- 2024 margin
- D (+17.3) · D 58.6% · R 41.4%
- 2008→2024 swing
- -3.0pp toward R · 2008: 20.3pp · 2024: 17.3pp
- All cycles
- 2024: D+17.3 2020: D+20.6 2016: D+12.8 2012: D+21.1 2008: D+20.3
Not yet ingested
- Civics
- —
Market trends
- HPI YoY
- ▼ -35.69%
- Current HPI
- 263.2588
- Rent YoY
- ▲ 8.39%
- Metro
- Syracuse, NY
- State GDP YoY
- ▲ 2.60%
- F500 in state
- 92
Industry mix (Fortune 500 HQ in NY)
| Industry | F500 HQs | Revenue |
|---|---|---|
| Financial Services | 10 | $950B |
|
||
| Consumer Goods | 9 | $162B |
|
||
| Insurance | 4 | $225B |
|
||
| Telecommunications | 2 | $144B |
|
||
| Pharmaceuticals | 2 | $112B |
|
||
| Media / Entertainment | 2 | $69B |
|
||
Price history
+327.3% since first listed8 events — show timeline
- 2026-05-04 Price Changed $235,000 CNYIS
- 2026-03-16 Price Changed $245,000 CNYIS
- 2026-01-07 Listed $255,000 CNYIS
- 2012-07-05 Listing Removed — CNYIS
- 2012-07-03 Sold (Public Records) $25,000 Public Records
- 2012-06-29 Sold (MLS) $25,000 CNYIS
- 2012-03-26 Listed $35,000 CNYIS
- 2001-03-02 Sold (Public Records) $55,000 Public Records
Property tax history
+1.5%/yrLatest (2025): $1,391 · +0.0% YoY. Source: county tax records.
Cash-flow waterfall
monthlySold comps — $/sqft
last 12 mo · ≤1 miLoading sold comps…