2106 35 Unit C3 · New York, NY
Flood risk 1/10 · Minimal
- FEMA flood zone
- X (unshaded)
- Chance of flooding over 30 yrs
- 0.0%
- Est. flood insurance / yr
- $507 – $1,088
Fire risk 1/10 · Minimal
- Est. fire insurance / yr
- $691 – $1,283
Heat risk 6/10 · Moderate
- Hot days now (above 99°F)
- 7 days/yr
- Hot days in 30 yrs
- 15 days/yr
Wind risk 6/10 · Moderate
- Chance of severe wind over 30 yrs
- 27.0%
Air-quality risk 4/10 · Minor
- Unhealthy air days now
- 5 days/yr
- Unhealthy air days in 30 yrs
- 6 days/yr
Risk factors via First Street. Map © Google.
Why this score? — see what drove the C+ grade
The composite is a weighted blend of 9 inputs, each scored 0–100. Each bar is that input's sub-score; the figure is the points it added to the 100-point composite (weight × sub-score).
- Cash flow +21.6/30.0
- ARV discount +7.5/15.0
- DSCR +6.9/10.0
- 1% rule +5.7/10.0
- Appreciation +5.1/10.0
- Schools +5.0/10.0
- Condition / age +4.0/5.0
- Livability +3.8/5.0
- Rent growth +3.7/5.0
$349,000
🖨 Deal sheet 📄 Offer letter ✓ Due diligence
Listing remarks
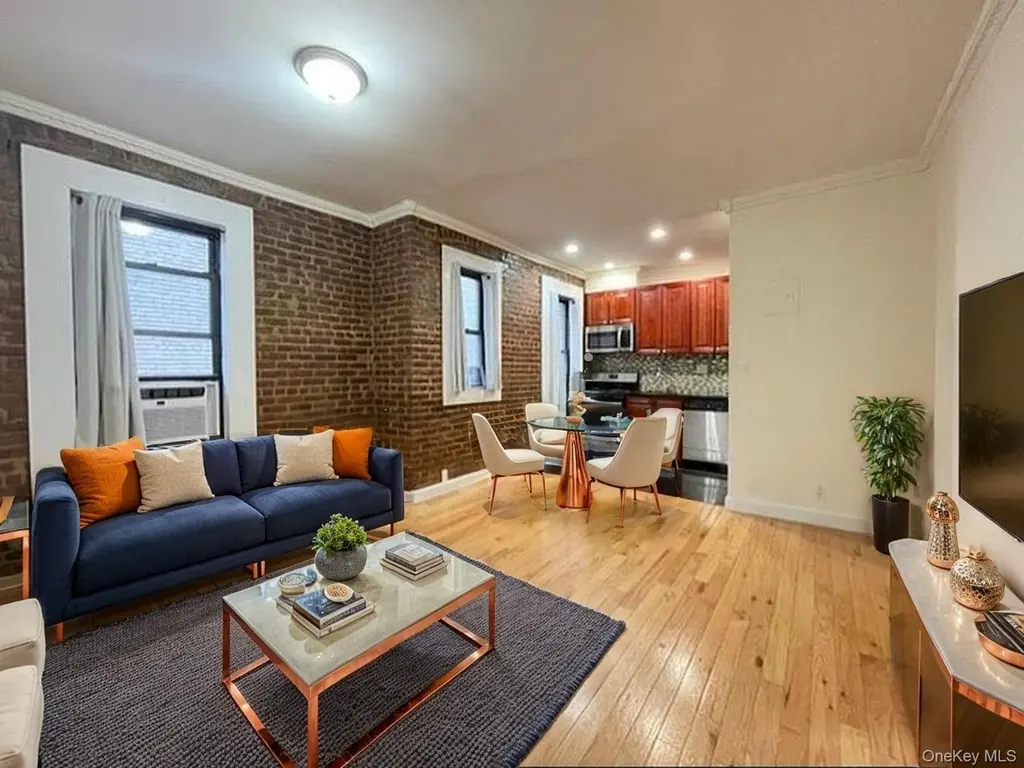
Sun-Drenched 2-Bedroom Gem in Prime Astoria Welcome home to this majestic, impeccably maintained 2-bedroom apartment located in the highly sought-after Ditmars Avenue Complex. Combining classic charm with modern convenience, this sun-kissed residence features: Bright & Airy Living Space: A sprawling, sun-drenched living room illuminated by three expansive windows. Classic Finishes: Beautiful hardwood flooring throughout and a gorgeous, character-rich exposed brick accent wall. Chef’s Kitchen: Sleek granite countertops paired with full-sized stainless-steel appliances. Symmetrical Layout: Two equally sized bedrooms, each boasting its own closet and bright window. The Location
Key facts
- Granite countertops
- Built 1923
- Listed 15 days
Tags
Property features AI
Exterior
- Parking: No carport; No parking features listed
- Utilities: Public sewer; Cable available; Natural gas connected; Phone available; Public trash collection; Water available
- Home design: Stock cooperative
- Construction: Block construction
- Exterior features: Block construction; Not waterfront
Interior
- Kitchen: Dishwasher; Gas oven; Gas range; Microwave; ENERGY STAR qualified appliances
- Bedrooms: Entry level: 1
- Bathrooms: 1 full bathroom
- Heating & cooling: Steam heating; Wall/window air conditioning units
- Interior features: First-floor bedroom; First-floor full bathroom; Crown molding
Neighborhood map
What this means for you Summary
Snapshot
- This is a 2-bed/1.0-bath condo listed at $349k. Condition is rated good.
Deal economics
- At list price, monthly cash flow is $528 ($6k/yr) — positive.
- The deal already cash-flows at list — no discount required.
- Meets the 1% rule at list price ($4k rent vs $349k).
- Recommended offer: $344k (1.5% below list) — sets the bar for market timing.
- Cap rate 8.1% vs local median 2.6% in New York — top-decile yield for the area; either an underpriced asset or a hidden risk that comps aren't pricing in. Stress-test before assuming the spread holds.
Location & tenants
- Location reads 75/100 on livability (#268 in NY, #4,188 nationally) — a middle-class / working-renter tenant base. Strengths: amenities A+, commute A+, health & safety A; Watch: crime F, cost of living F.
- Market conditions: Rents rising fast (+4.8%/yr); 114 active listings in the ZIP; 1 comparable units currently listed for rent nearby; solid renter incomes; 5,302 units permitted in Queens County in 2024 (4,918 in 5+ unit buildings).
- At $3,722/mo this rent would consume 46% of the median local household income ($97k/yr) (locally 2407% of renters already pay >50% of income on rent) — very limited rent-growth headroom before tenants either downsize or default.
Forward outlook
- In year one you build about $3k of equity ($2k loan paydown + $573 appreciation (0.2% local appreciation)).
- Queens County population projected at +16% by 2050 — long-run rental-demand tailwind backs the buy-and-hold thesis.
- At projected returns (0.2% appreciation + 4.8% rent growth), your $98k cash investment doubles in ~7 years — after that, you're playing with house money.
- By year 9, paydown + projected appreciation supports a ~$34k cash-out refi (75% LTV) — recoverable capital for the next deal without selling this one.
Negotiation context
- It's been on market 15 days — a 2% lower offer ($344k) is reasonable based on typical stale-listing flexibility.
Risks & watch-outs
- Watch-outs: built in 1923 — expect roof / HVAC / electrical / plumbing capex.
- Climate carrying-cost: major wind risk, 27% chance of damaging wind over 30y; extreme-heat days projected 7→15/yr by 2055 (HVAC capex compounding) — expect insurance premiums to compound above CPI over the hold.
Questions for the listing agent
- Built in 1923 — when were the roof, HVAC, electrical panel, plumbing, and water heater last replaced?
- Any open or pending special assessments — roof, HVAC, plumbing, elevator, façade? What's the per-unit balance and payoff schedule, and is the seller paying it off at close or rolling it to the buyer?
- Is there a deadline driving the sale (1031 exchange, divorce, estate, relocation)? That informs how much negotiation room exists.
- Schools are B-rated — typically a magnet for longer-tenancy family renters. What's the average tenant stay here, and is there a school-zone premium baked into asking?
- Crime grade is F in this area — have there been break-ins, vandalism, or insurance claims at this property in the last 3 years? What carrier currently insures it and at what premium?
- What's the average days-on-market for RENTAL listings here right now (not sales)? A rising rental-DOM trend means longer vacancies and softer asking-rent achievability than the comps imply.
- What's the recent tenant-quality profile in this submarket — average credit score on applications, eviction rate, late-payment / NSF rate, and stable-employment percentage? A property-management company in the area should have these aggregated.
- How much new apartment / multifamily construction is in the pipeline within 1–3 miles? Heavy new supply (>2% of stock underway) typically softens rents 12–24 months out; light construction supports rent growth.
Investment metrics
- 1% rule
- 1.07% ✓
- Cap rate
- 8.11%
- Cash-on-cash
- 6.49%
- DSCR
- 1.29
- GRM
- 7.8
CMA / ARV
No comps found within radius.
Projected returns pro-forma
0.16% appreciation · 4.79% rent growth · sell at horizon
- IRR
- 6.9%
- Equity multiple
- 1.34×
- Total profit
- $33,016
- Equity at exit
- $104,212
- IRR
- 13.1%
- Equity multiple
- 2.54×
- Total profit
- $150,197
- Equity at exit
- $127,584
Cash invested: $97,720 (down + closing). Projections, not guarantees.
Landlord ↔ Tenant lean methodology
- Overall (CITY)
- 0 Strongly Tenant-Friendly
- State New York
- 15 Strongly Tenant-Friendly · D+10
- County
- — inherits STATE
- City New York
- 0 Strongly Tenant-Friendly · D+34
ZIP-level market 11102
- Home prices YoY
- 0.1%
- Rents YoY
- 4.8%
- Active inventory
- 114
- Price-to-rent
- 7.8×
Monthly cashflow live
- Estimated rent
- $3,722 medium interval (Pro) →
- Mortgage (P&I)
- −$1,830
- Tax est. 1.5%
- −$436 /mo · $5,235/yr
- Insurance
- −$145
- HOA
- −$0
- Vacancy / Maint / Mgmt
- −$782
- Net cashflow
- $528
Break-even live
UW: 25.0% down · 7.5% · 30yr · 1.5% tax · 5.0% vac · 8.0% maint · 8.0% mgmt
Financing live
Cash to close
- Down payment
- $87,250
- Closing costs
- $10,470
- Reserves months
- —
- Total cash needed
- —
Loan-product check · same deal, 3 products live
Conventional
25% down · 7.5% · 30yr
- Down + closing
- —
- Monthly P&I
- —
- Monthly cashflow
- —
- DSCR
- —
- Eligible?
- —
Personal DTI + credit; lowest rate.
DSCR
20% down · 8.5% · 30yr
- Down + closing
- —
- Monthly P&I
- —
- Monthly cashflow
- —
- DSCR
- —
- Eligible?
- —
No personal income docs; deal must DSCR.
Hard money
10% down · 12.0% · 12mo
- Down + closing
- —
- Monthly P&I
- —
- Monthly cashflow
- —
- DSCR
- —
- Eligible?
- —
Short-term bridge; refi at stabilization.
Rent comps 1 comps
| Address | Beds | Baths | Sqft | Rent | $/sqft | DOM | Units | Dist |
|---|---|---|---|---|---|---|---|---|
| 1420 27th Ave Astoria, NY | 1.0–2.0 | 1.0–2.0 | 887 | $4,899 | $5.52 | 3d | 9 | 1.17mi |
HOA detail condo
- Monthly dues
- $0 · $0/yr
- Assessments
- None detected in remarks — confirm with the listing agent.
Listing history 10 events
-
2026-06-18days on market $349,000 Active 15 DOM
-
2026-06-17days on market $349,000 Active 14 DOM
-
2026-06-16days on market $349,000 Active 13 DOM
-
2026-06-15days on market $349,000 Active 12 DOM
-
2026-06-13days on market $349,000 Active 10 DOM
-
2026-06-09days on market $349,000 Active 6 DOM
-
2026-06-08days on market $349,000 Active 5 DOM
-
2026-06-07days on market $349,000 Active 4 DOM
-
2026-06-04remarks 689-char remark
-
2026-06-04$349,000 Active 1 DOM
ⓘ Source: listings_history table (triggers on properties + properties_extension) + one-shot
backfill from property_details.listing_events for pre-trigger history.
Climate risk First Street
- Flood 1/10 Low FEMA zone X (unshaded) · 0% chance over 30 yrs
- Wildfire 1/10 Low
- Heat 6/10 Major 7 d/yr ≥99°F today · 15 d/yr by 30 yrs out
- Wind 6/10 Major 27% chance of damaging wind over 30 yrs
- Air quality 4/10 Moderate 5 unhealthy d/yr today · 6 by 30 yrs out
Nearby sold comps map
Loading sold comps map…
Walkable amenities ~0.75 mi
Loading nearby amenities…
Taxation est. · year 1
- Rental income
- $44,660
- − Mortgage interest
- −$19,549
- − Property taxes
- −$5,235
- − Insurance
- −$1,745
- − Repairs & maintenance
- −$3,573
- − Management
- −$3,573
- − Depreciation
- −$10,153
- Taxable income
- $832
- Est. tax owed @ 24.0%
- −$200
- After-tax cash flow
- $6,139/yr
For passive investors: Depreciation is non-cash, so a rental often shows a tax loss while cash-flowing — sheltering income. Rental losses are passive: they offset passive income freely, and up to $25,000/yr can offset ordinary (W-2) income if you actively participate and your MAGI is under $100k (phasing out to $0 by $150k); unused losses carry forward. On sale, claimed depreciation is recaptured at up to 25%, and gains may owe capital-gains tax (a 1031 exchange can defer both). Figures are a year-1 estimate at your 24.0% rate — not tax advice; consult a CPA.
Condition & rehab AI · 8 photos
This 2-bedroom condo in Astoria is in good condition with a good layout and finishes. It needs some exterior painting and window cleaning to enhance its curb appeal and resale value.
Value-add opportunities
- Both Paint the exterior — Enhances curb appeal and resale value
- Both Replace the windows — Improves energy efficiency and resale value
Renovation cost estimate screening
Value-add ROI direction
- Both Paint the exterior — Enhances curb appeal and resale value ↑
- Both Replace the windows — Improves energy efficiency and resale value ↑
ⓘ Cost ranges are severity-bucket heuristics (US national rule-of-thumb). Get contractor quotes + a written scope before underwriting a rehab budget.
Schools (NCES district)
No district data.
Livability — New York
- Score
- 75/100
- State rank
- #268
- US rank
- #4188
Category grades
Schools grade is shown separately in the Schools card above.
Census & demographics
- Census place
- New York, NY
- County
- Queens County · 1,914,869 people
- City population
- 7,731,280
- Metro
- New York-Newark-Jersey City, NY-NJ-PA
- Population (ZIP)
- 28,503
- Household income
- $96,617
- Rent vs Own
- Severe rent burden
- 2407.0
Population outlook (Queens County) Hauer SSP2
- Today (2025)
- 2,546,320 people
- By 2030
- 2,643,059 · +3.8%
- By 2040
- 2,815,563 · +10.6%
- By 2050
- 2,944,423 · +15.6%
- By 2075
- 3,123,338 · +22.7%
- By 2100
- 3,098,688 · +21.7%
Race, ethnicity, and origin ACS 2023
- Neighborhood character
- Diverse neighborhood (Simpson 0.69)
- Race & ethnicity
- White 47% Hispanic / Latino 26% Asian 15% Two or more races 12% Black 6%
- Hispanic origin (detail)
- Mexican 4% Puerto Rican 5% Dominican 3%
- Common ancestry
- Romanian 2% Lithuanian 1% Italian 1%
- Foreign-born
- 34% · Canada, China, Jamaica
- Languages at home
- 55% English-only · Spanish 21% Other Indo-European 14% Russian/Polish/Slavic 3%
Political lean MEDSL · Queens
- 2024 margin
- Strong D (+24.6) · D 62.3% · R 37.7%
- 2008→2024 swing
- -26.2pp toward R · 2008: 50.8pp · 2024: 24.6pp
- All cycles
- 2024: D+24.6 2020: D+45.2 2016: D+53.4 2012: D+58.5 2008: D+50.8
Not yet ingested
- Civics
- —
Market trends
- HPI YoY
- ▲ 0.16%
- Current HPI
- 144.3118
- Rent YoY
- ▲ 4.79%
- Metro
- New York-Newark-Jersey City, NY-NJ-PA
- State GDP YoY
- ▲ 2.60%
- F500 in state
- 92
Industry mix (Fortune 500 HQ in NY)
| Industry | F500 HQs | Revenue |
|---|---|---|
| Financial Services | 10 | $950B |
|
||
| Consumer Goods | 9 | $162B |
|
||
| Insurance | 4 | $225B |
|
||
| Telecommunications | 2 | $144B |
|
||
| Pharmaceuticals | 2 | $112B |
|
||
| Media / Entertainment | 2 | $69B |
|
||
Price history
1 event — show timeline
- 2026-06-02 Listed $349,000 OneKey® MLS as Distributed by MLS Grid
Cash-flow waterfall
monthlySold comps — $/sqft
last 12 mo · ≤1 miLoading sold comps…