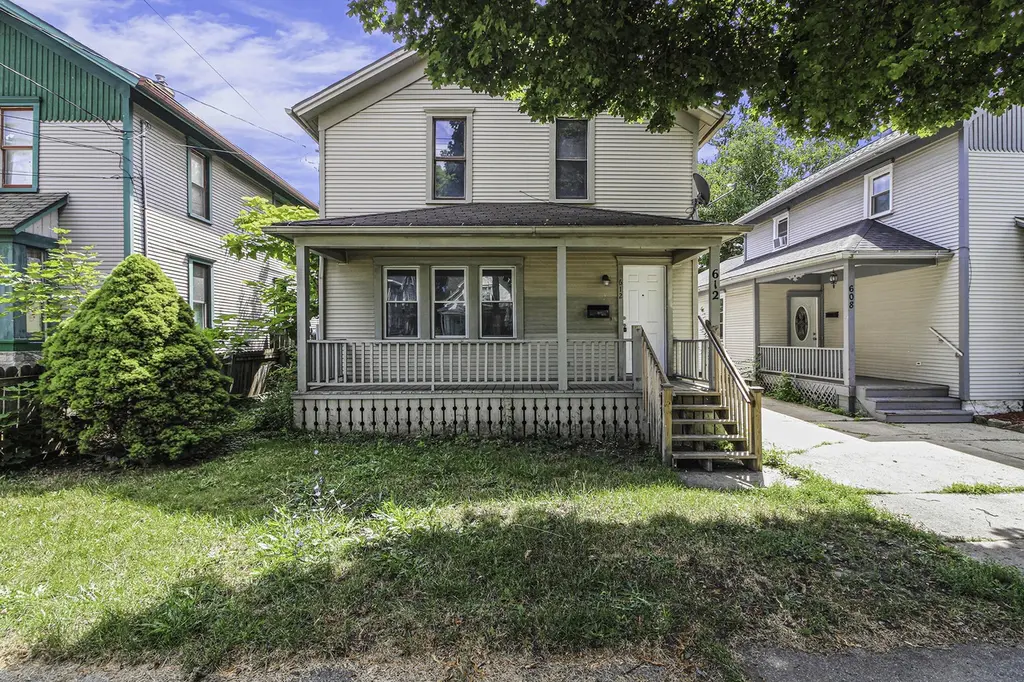
612 N Walnut St · Lansing, MI
Flood risk 1/10 · Minimal
- FEMA flood zone
- X (unshaded)
- Chance of flooding over 30 yrs
- 0.0%
- Est. flood insurance / yr
- $473 – $860
Fire risk 1/10 · Minimal
- Est. fire insurance / yr
- $784 – $1,456
Heat risk 2/10 · Minimal
- Hot days now (above 97°F)
- 7 days/yr
- Hot days in 30 yrs
- 16 days/yr
Wind risk 2/10 · Minimal
- Chance of severe wind over 30 yrs
- —
Air-quality risk 2/10 · Minimal
- Unhealthy air days now
- 1 days/yr
- Unhealthy air days in 30 yrs
- 2 days/yr
Risk factors via First Street. Map © Google.
Why this score? — see what drove the C+ grade
The composite is a weighted blend of 9 inputs, each scored 0–100. Each bar is that input's sub-score; the figure is the points it added to the 100-point composite (weight × sub-score).
- Cash flow +20.7/30.0
- ARV discount +10.0/15.0
- Appreciation +9.7/10.0
- DSCR +6.6/10.0
- 1% rule +6.1/10.0
- Livability +4.0/5.0
- Rent growth +2.5/5.0
- Condition / age +2.5/5.0
- Schools +1.9/10.0
$119,000
🖨 Deal sheet 📄 Offer letter ✓ Due diligence
Listing remarks MLS
Turnkey investment property with rental income! This updated home currently has a tenant in place paying $1,400 per month, with a lease secured through November 15, 2026, offering investors cash flow from day one. Ideally located close to LCC, Quality Dairy, nearby parks, and the Grand River, the property benefits from strong rental demand due to its central location and proximity to local amenities. The home features a traditional floor plan with a bright living room and a spacious dining area, creating an inviting layout that appeals to occupants. An updated kitchen includes durable vinyl flooring and abundant cabinet storage, making it both practical and attractive. Upstairs you'll find all bedrooms, each with neutral paint, comfortable carpeting, and sizable closets, providing functional and appealing living spaces. The basement offers storage potential, while outdoor features include a covered front porch and fenced backyard, adding value and appeal. Don't wait - Inquire today!
Key facts
- Strong rental demand
- Bright living room
- Updated home
Tags
Neighborhood map
What this means for you Summary
Snapshot
- This is a 3-bed/1.0-bath single-family listed at $119k.
Deal economics
- At list price, monthly cash flow is $161 ($2k/yr) — positive.
- The deal already cash-flows at list — no discount required.
- Meets the 1% rule at list price ($1k rent vs $119k).
- Recommended offer: $108k (9.0% below list) — sets the bar for market timing.
- Cap rate 7.9% vs local median 6.0% in Lansing — top-decile yield for the area; either an underpriced asset or a hidden risk that comps aren't pricing in. Stress-test before assuming the spread holds.
Location & tenants
- Location reads 79/100 on livability (#94 in MI, #2,182 nationally) — a middle-class / working-renter tenant base. Strengths: amenities A+, commute A+, cost of living A+; Watch: employment D, schools F, crime F.
- Lansing Public School District (urban): math 14% / reading 23% proficiency, ranked #650 of 760 in MI (top 86%) — low school quality limits family demand, transient renter base, plan for 1-2y turnover; 68% free/reduced lunch — lower-income household profile, screen leases tightly.
- Market conditions: 13 active listings in the ZIP; 22 comparable units currently listed for rent nearby; rentals lingering (median 44d on market — plan ~5-8 weeks vacancy on turnover, expect pricing pressure); 55% of comp listings sitting > 30 days — soft ceiling on asking rent; lower-income renter base — watch delinquency; 350 units permitted in Ingham County in 2024 (186 in 5+ unit buildings).
- At $1,320/mo this rent would consume 47% of the median local household income ($34k/yr) (locally 413% of renters already pay >50% of income on rent) — very limited rent-growth headroom before tenants either downsize or default.
Forward outlook
- In year one you build about $12k of equity ($823 loan paydown + $11k appreciation (9.4% local appreciation)).
- Ingham County population projected at +11% by 2050 — modest demand growth; plan on rents tracking national, not racing it.
- At projected returns (9.4% appreciation + 3.0% rent growth), your $33k cash investment doubles in ~3 years — after that, you're playing with house money.
- By year 3, paydown + projected appreciation supports a ~$30k cash-out refi (75% LTV) — recoverable capital for the next deal without selling this one.
Negotiation context
- It's been on market 95 days — a 9% lower offer ($108k) is reasonable based on typical stale-listing flexibility.
- 8 sale attempts since 8y ago with the ask held roughly flat each time — persistent listings suggest the price (not the market) is what's stuck; bring a comps-based counter.
- Current owner paid $59k; list at $119k implies a 102% gain — meaningful room to come down on a strong offer.
Risks & watch-outs
- Watch-outs: built in 1875 — expect roof / HVAC / electrical / plumbing capex.
Questions for the listing agent
- It's been on market 95 days. Have you received any prior offers? Is the seller open to a 9% concession, seller financing, or rate buy-down credit?
- Built in 1875 — when were the roof, HVAC, electrical panel, plumbing, and water heater last replaced?
- Why hasn't it sold? Are there any deal-killer items the seller is aware of (foundation, flood, title, zoning, code violations)?
- Is there a deadline driving the sale (1031 exchange, divorce, estate, relocation)? That informs how much negotiation room exists.
- Schools are F-rated, which usually means shorter tenancies and higher turnover. Who's the typical renter profile here, and what's been the actual vacancy rate?
- Crime grade is F in this area — have there been break-ins, vandalism, or insurance claims at this property in the last 3 years? What carrier currently insures it and at what premium?
- What's the average days-on-market for RENTAL listings here right now (not sales)? A rising rental-DOM trend means longer vacancies and softer asking-rent achievability than the comps imply.
- What's the recent tenant-quality profile in this submarket — average credit score on applications, eviction rate, late-payment / NSF rate, and stable-employment percentage? A property-management company in the area should have these aggregated.
- How much new for-sale + rental construction is in the pipeline within 1–3 miles? Heavy new supply typically softens prices + rents 12–24 months out; constrained supply supports both.
Investment metrics
- 1% rule
- 1.11% ✓
- Cap rate
- 7.91%
- Cash-on-cash
- 5.79%
- DSCR
- 1.26
- GRM
- 7.5
CMA / ARV
- ARV (median comp)
- $125,891
- List price
- $119,000
- Delta
- -5.47%
- Verdict
- FAIR
- Comps
- 20 within 1.0 mi
Show comp detail 12 sales within ~0.75 mi
| Address | Dist | Beds/Ba | Sqft | Sold | Price | $/sf | Match |
|---|---|---|---|---|---|---|---|
| 905 N Sycamore St | 0.36mi | 3/1.5 | 1,368 (+4%) | 0mo | $130,000 | $95 | 75 |
| 908 N Walnut St | 0.25mi | 4/1.5 (+1) | 1,248 (-6%) | 1mo | $125,000 | $100 | 71 |
| 806 Princeton Ave | 0.49mi | 3/1.0 | 1,344 (+2%) | 6mo | $60,000 | $45 | 69 |
| 113 W Willow St | 0.59mi | 3/1.0 | 1,287 (-2%) | 0mo | $85,000 | $66 | 68 |
| 1217 W Shiawassee St | 0.69mi | 3/1.5 | 1,316 (-0%) | 3mo | $147,000 | $112 | 63 |
| 921 N Sycamore St | 0.38mi | 3/1.0 | 1,460 (+11%) | 3mo | $99,900 | $68 | 62 |
| 502 N Butler Blvd | 0.40mi | 3/1.0 | 1,176 (-11%) | 1mo | $144,000 | $122 | 62 |
| 738 W Lapeer St | 0.34mi | 3/1.5 | 1,479 (+12%) | 2mo | $158,000 | $107 | 61 |
| 511 N Martin Luther King Jr Blvd | 0.56mi | 3/1.0 | 1,231 (-7%) | 5mo | $130,000 | $106 | 59 |
| 1313 S Genesee Dr | 0.74mi | 3/2.0 | 1,351 (+2%) | 4mo | $218,000 | $161 | 54 |
| 920 Clyde St | 0.65mi | 3/1.5 | 1,204 (-9%) | 2mo | $170,000 | $141 | 52 |
| 908 Clyde St | 0.64mi | 2/1.0 (-1) | 1,222 (-7%) | 3mo | $138,000 | $113 | 50 |
Match score weights: distance 35% · size 25% · config 20% · recency 20%. Top-matched comps best support the ARV.
Projected returns pro-forma
9.36% appreciation · 3.0% rent growth · sell at horizon
- IRR
- 27.2%
- Equity multiple
- 3.10×
- Total profit
- $69,897
- Equity at exit
- $101,668
- IRR
- 24.0%
- Equity multiple
- 6.90×
- Total profit
- $196,704
- Equity at exit
- $213,616
Cash invested: $33,320 (down + closing). Projections, not guarantees.
Landlord ↔ Tenant lean methodology
- Overall (STATE)
- 62 Landlord-Friendly
- State Michigan
- 62 Landlord-Friendly · EVEN
- County
- — inherits STATE
- City
- — inherits STATE
ZIP-level market 48933
- Home prices YoY
- 4.1%
- Active inventory
- 13
- Price-to-rent
- 7.5×
Monthly cashflow live
- Estimated rent
- $1,320 high interval (Pro) →
- Mortgage (P&I)
- −$624
- Tax from tax record
- −$209 /mo · $2,504/yr
- Insurance
- −$50
- HOA
- −$0
- Vacancy / Maint / Mgmt
- −$277
- Net cashflow
- $161
Break-even live
UW: 25.0% down · 7.5% · 30yr · 1.5% tax · 5.0% vac · 8.0% maint · 8.0% mgmt
Financing live
Cash to close
- Down payment
- $29,750
- Closing costs
- $3,570
- Reserves months
- —
- Total cash needed
- —
Loan-product check · same deal, 3 products live
Conventional
25% down · 7.5% · 30yr
- Down + closing
- —
- Monthly P&I
- —
- Monthly cashflow
- —
- DSCR
- —
- Eligible?
- —
Personal DTI + credit; lowest rate.
DSCR
20% down · 8.5% · 30yr
- Down + closing
- —
- Monthly P&I
- —
- Monthly cashflow
- —
- DSCR
- —
- Eligible?
- —
No personal income docs; deal must DSCR.
Hard money
10% down · 12.0% · 12mo
- Down + closing
- —
- Monthly P&I
- —
- Monthly cashflow
- —
- DSCR
- —
- Eligible?
- —
Short-term bridge; refi at stabilization.
Rent comps 22 comps
| Address | Beds | Baths | Sqft | Rent | $/sqft | DOM | Units | Dist |
|---|---|---|---|---|---|---|---|---|
| 524 N Walnut St Lansing, MI | 2.0 | 1.0 | 1000 | $1,150 | $1.15 | 43d | 1 | 0.04mi |
| 433 Seymour Ave Unit 3 Lansing, MI | 3.0 | 1.0 | 1250 | $1,395 | $1.12 | 43d | 1 | 0.13mi |
| 712 N Sycamore St Lansing, MI | 3.0 | 1.0 | 1100 | $1,650 | $1.50 | 21d | 1 | 0.25mi |
| 731 N Sycamore St Unit 1 Lansing, MI | 2.0 | 1.0 | 950 | $945 | $0.99 | 43d | 1 | 0.29mi |
| 919 Princeton Ave Lansing, MI | 3.0 | 1.5 | 1119 | $1,475 | $1.32 | 21d | 1 | 0.55mi |
| 832 N Larch St Apt 3 Lansing, MI | 2.0 | 1.0 | 890 | $1,095 | $1.23 | 43d | 1 | 0.68mi |
| 620 May St Lansing, MI | 1.0–2.0 | 1.0–2.0 | 1126 | $1,578 | $1.40 | 13d | 12 | 0.70mi |
| 401 S Washington Sq Unit 201 Lansing, MI | 3.0 | 1.0 | 1254 | $1,560 | $1.24 | 43d | 1 | 0.76mi |
| 401 S Washington Sq Unit 205 Lansing, MI | 2.0 | 1.0 | 968 | $1,355 | $1.40 | 43d | 1 | 0.76mi |
| 113 Pere Marquette Dr Lansing, MI | 1.0–2.0 | 1.0–2.0 | 1065 | $2,250 | $2.11 | 13d | 9 | 0.79mi |
| 1012 Ontario St Lansing, MI | 4.0 | 2.0 | 1320 | $1,600 | $1.21 | 21d | 1 | 0.85mi |
| 921 Linden Grove Ave Lansing, MI | 3.0 | 1.0 | 1694 | $1,499 | $0.88 | 43d | 1 | 0.94mi |
| 605 S Grand Ave Unit 2 Lansing, MI | 4.0 | 1.0 | 1200 | $1,100 | $0.92 | 43d | 1 | 0.96mi |
| 507 S Hosmer St Lansing, MI | 2.0 | 1.0 | 1120 | $1,075 | $0.96 | 43d | 1 | 1.14mi |
| 1330 W Hillsdale St Lansing, MI | 3.0 | 1.0 | 1008 | $1,550 | $1.54 | 43d | 1 | 1.14mi |
| 920 S Washington Ave Lansing, MI | 1.0–2.0 | 1.0–2.0 | 900 | $1,250 | $1.39 | 13d | 1 | 1.15mi |
| 805 Bement St Unit Hosmer 507 Lansing, MI | 2.0 | 1.0 | 1120 | $1,075 | $0.96 | 43d | 1 | 1.16mi |
| 208 S Bingham St Lansing, MI | 4.0 | 1.0 | 1020 | $1,500 | $1.47 | 13d | 1 | 1.18mi |
| 1561 Massachusetts Ave Lansing, MI | 3.0 | 2.0 | 1100 | $1,400 | $1.27 | 43d | 1 | 1.33mi |
| 1102 Clark St Lansing, MI | 3.0 | 1.0 | 1232 | $1,550 | $1.26 | 21d | 1 | 1.34mi |
| 1100 Malcolm X St Unit B Lansing, MI | 2.0 | 1.0 | 979 | $1,050 | $1.07 | 13d | 1 | 1.47mi |
| 1027 Climax St Lansing, MI | 3.0 | 1.5 | 1298 | $1,550 | $1.19 | 13d | 1 | 1.47mi |
Listing history 27 events
-
2026-06-18days on market $119,000 Active 95 DOM
-
2026-06-17days on market $119,000 Active 94 DOM
-
2026-06-16days on market $119,000 Active 93 DOM
-
2026-06-15days on market $119,000 Active 92 DOM
-
2026-06-14days on market $119,000 Active 90 DOM
-
2026-06-13statusdays on market $119,000 Active 89 DOM
-
2026-06-03status $119,000 Pending 88 DOM
-
2026-06-02days on market $119,000 Active 88 DOM
-
2026-06-01days on market $119,000 Active 87 DOM
-
2026-05-31days on market $119,000 Active 86 DOM
-
2026-05-30days on market $119,000 Active 85 DOM
-
2026-03-06$119,000 Active 997-char remark
Show marketing remark (997 chars)
Turnkey investment property with rental income! This updated home currently has a tenant in place paying $1,400 per month, with a lease secured through November 15, 2026, offering investors cash flow from day one. Ideally located close to LCC, Quality Dairy, nearby parks, and the Grand River, the property benefits from strong rental demand due to its central location and proximity to local amenities. The home features a traditional floor plan with a bright living room and a spacious dining area, creating an inviting layout that appeals to occupants. An updated kitchen includes durable vinyl flooring and abundant cabinet storage, making it both practical and attractive. Upstairs you'll find all bedrooms, each with neutral paint, comfortable carpeting, and sizable closets, providing functional and appealing living spaces. The basement offers storage potential, while outdoor features include a covered front porch and fenced backyard, adding value and appeal. Don't wait - Inquire today!
-
2026-03-06$119,000 Active
Show marketing remark (997 chars)
Turnkey investment property with rental income! This updated home currently has a tenant in place paying $1,400 per month, with a lease secured through November 15, 2026, offering investors cash flow from day one. Ideally located close to LCC, Quality Dairy, nearby parks, and the Grand River, the property benefits from strong rental demand due to its central location and proximity to local amenities. The home features a traditional floor plan with a bright living room and a spacious dining area, creating an inviting layout that appeals to occupants. An updated kitchen includes durable vinyl flooring and abundant cabinet storage, making it both practical and attractive. Upstairs you'll find all bedrooms, each with neutral paint, comfortable carpeting, and sizable closets, providing functional and appealing living spaces. The basement offers storage potential, while outdoor features include a covered front porch and fenced backyard, adding value and appeal. Don't wait - Inquire today!
-
2022-07-06historical
-
2022-06-06status Active
-
2022-05-31status Pending
-
2022-05-31historical
-
2022-05-17price $99,900
-
2022-04-23$99,900
-
2022-04-23$109,900 Active
-
2018-03-23soldstatus $59,000
-
2018-03-23soldstatus $59,000
-
2018-02-07$59,900
-
2018-02-07$59,900
-
2004-08-19soldstatus $87,000
-
2001-01-03soldstatus $74,900
ⓘ Source: listings_history table (triggers on properties + properties_extension) + one-shot
backfill from property_details.listing_events for pre-trigger history.
Tax reassessment forecast MI · Partial reset (capped growth)
- Current annual tax
- $2,504 · $209/mo
- Projected year-2 tax
- $2,504 · $209/mo
- Expected delta
- $0/yr ($0/mo · 0.0%)
ⓘ Screening estimate from a state-policy table — verify with the county assessor before closing.
Climate risk First Street
- Flood 1/10 Low FEMA zone X (unshaded) · 0% chance over 30 yrs
- Wildfire 1/10 Low
- Heat 2/10 Low 7 d/yr ≥97°F today · 16 d/yr by 30 yrs out
- Wind 2/10 Low
- Air quality 2/10 Low 1 unhealthy d/yr today · 2 by 30 yrs out
Nearby sold comps map
Loading sold comps map…
Walkable amenities ~0.75 mi
Loading nearby amenities…
Taxation est. · year 1
- Rental income
- $15,843
- − Mortgage interest
- −$6,666
- − Property taxes
- −$2,504
- − Insurance
- −$595
- − Repairs & maintenance
- −$1,267
- − Management
- −$1,267
- − Depreciation
- −$3,462
- Taxable income
- $81
- Est. tax owed @ 24.0%
- −$19
- After-tax cash flow
- $1,909/yr
For passive investors: Depreciation is non-cash, so a rental often shows a tax loss while cash-flowing — sheltering income. Rental losses are passive: they offset passive income freely, and up to $25,000/yr can offset ordinary (W-2) income if you actively participate and your MAGI is under $100k (phasing out to $0 by $150k); unused losses carry forward. On sale, claimed depreciation is recaptured at up to 25%, and gains may owe capital-gains tax (a 1031 exchange can defer both). Figures are a year-1 estimate at your 24.0% rate — not tax advice; consult a CPA.
Schools (NCES district)
- District
- Lansing Public School District
- NCES district ID
- 2621150
- Math proficiency
- 14% ▲ 1.00%
- Reading proficiency
- 23% ▲ 3.00%
- Median HH income
- $37,453
- Composite
- 18.76/100
- National rank
- #14002
- State rank
- #650 of 760 in MI
Livability — Lansing
- Score
- 79/100
- State rank
- #94
- US rank
- #2182
Category grades
Schools grade is shown separately in the Schools card above.
Census & demographics
- Census place
- Lansing, MI
- County
- Ingham County · 237,052 people
- City population
- 161,269
- Metro
- Lansing-East Lansing, MI
- Population (ZIP)
- 3,107
- Household income
- $33,589
- Rent vs Own
- Severe rent burden
- 413.0
Population outlook (Ingham County) Hauer SSP2
- Today (2025)
- 300,362 people
- By 2030
- 307,808 · +2.5%
- By 2040
- 320,492 · +6.7%
- By 2050
- 333,223 · +10.9%
- By 2075
- 373,693 · +24.4%
- By 2100
- 392,021 · +30.5%
Race, ethnicity, and origin ACS 2023
- Neighborhood character
- Diverse neighborhood (Simpson 0.66)
- Race & ethnicity
- White 48% Black 33% Two or more races 10% Hispanic / Latino 7% Asian 3%
- Hispanic origin (detail)
- Mexican 4%
- Common ancestry
- Ukrainian 12% Romanian 8% Slovak 2%
- Foreign-born
- 16% · Canada, South Korea
- Languages at home
- 80% English-only · Spanish 3% Arabic 2% Other Asian/Pacific 2%
Political lean MEDSL · Ingham
- 2024 margin
- Strong D (+29.7) · D 63.9% · R 34.2% · Other 2.0%
- 2008→2024 swing
- -3.6pp toward R · 2008: 33.3pp · 2024: 29.7pp
- All cycles
- 2024: D+29.7 2020: D+32.2 2016: D+27.6 2012: D+27.9 2008: D+33.3
Not yet ingested
- Civics
- —
Market trends
- HPI YoY
- ▲ 9.36%
- Current HPI
- 237.0666
- Rent YoY
- —
- Metro
- Lansing-East Lansing, MI
- State GDP YoY
- ▲ 1.37%
- F500 in state
- 28
Industry mix (Fortune 500 HQ in MI)
| Industry | F500 HQs | Revenue |
|---|---|---|
| Automotive Parts | 3 | $48B |
|
||
| Automotive | 2 | $372B |
|
||
| Chemicals | 1 | $45B |
|
||
| Automotive Retail | 1 | $29B |
|
||
| Healthcare / Medical Devices | 1 | $23B |
|
||
| Automotive Technology | 1 | $20B |
|
||
Price history
+58.9% since first listed16 events — show timeline
- 2026-03-06 Listed $119,000 SW Michigan MLS
- 2026-03-06 Listed $119,000 REALCOMP
- 2026-03-06 Listed $119,000 MiRealSource-MiMLS
- 2022-07-06 Listing Removed — REALCOMP
- 2022-06-06 Relisted — Greater Lansing AoR
- 2022-05-31 Pending — Greater Lansing AoR
- 2022-05-31 Listing Removed — Greater Lansing AoR
- 2022-05-17 Price Changed $99,900 Greater Lansing AoR
- 2022-04-23 Listed $109,900 Greater Lansing AoR
- 2022-04-23 Listed $99,900 REALCOMP
- 2018-03-23 Sold (MLS) $59,000 Greater Lansing AoR
- 2018-03-23 Sold (MLS) $59,000 REALCOMP
- 2018-02-07 Listed $59,900 Greater Lansing AoR
- 2018-02-07 Listed $59,900 REALCOMP
- 2004-08-19 Sold (Public Records) $87,000 Public Records
- 2001-01-03 Sold (Public Records) $74,900 Public Records
Property tax history
+1.2%/yrLatest (2025): $2,504 · +3.0% YoY. Source: county tax records.
Cash-flow waterfall
monthlySold comps — $/sqft
last 12 mo · ≤1 miLoading sold comps…