 Duplex
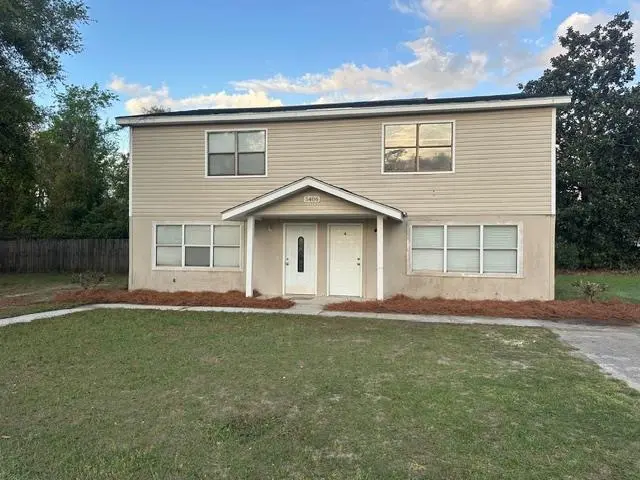
5406, 10 Worthington St Unit 06-10 · Lake Park, GA
Flood risk No data
- FEMA flood zone
- —
- Chance of flooding over 30 yrs
- —
- Est. flood insurance / yr
- —
Fire risk No data
- Est. fire insurance / yr
- —
Heat risk No data
- Hot days now (above threshold)
- —
- Hot days in 30 yrs
- —
Wind risk No data
- Chance of severe wind over 30 yrs
- —
Air-quality risk No data
- Unhealthy air days now
- —
- Unhealthy air days in 30 yrs
- —
Risk factors via First Street. Map © Google.
Why this score? — see what drove the C- grade
The composite is a weighted blend of 9 inputs, each scored 0–100. Each bar is that input's sub-score; the figure is the points it added to the 100-point composite (weight × sub-score).
- Cash flow +14.2/30.0
- Appreciation +10.0/10.0
- ARV discount +7.5/15.0
- Schools +4.7/10.0
- DSCR +4.3/10.0
- 1% rule +4.0/10.0
- Livability +3.5/5.0
- Condition / age +2.8/5.0
- Rent growth +2.5/5.0
$499,000
🖨 Deal sheet 📄 Offer letter ✓ Due diligence
Multi-family units
County records classify this as Multi-Family (2-4 Unit). Listing-text estimate: 2 units. confirmed
Listing remarks MLS
Great Investment Opportunity in very popular Twin Lakes. 2 duplexes. 4 units. Each unit is 2184 square feet. 3 bedrooms and 2 . 5 baths. Tile in kitchen with refrigerator and stove. LVP throughout. Laundry room. Large backyard with patio. .46 acre lot. Great rental history. Extremely convenient location. 1 minute to Lake Park shopping, restaurants, and I-75. Boating, fishing, camping are all available in this slow pace lake community. Wild Adventures Theme Park is also easily accessible. One could live in a unit and rent the others. Great opportunity!!! One of the listing agents is related to the seller.
Key facts
- Lake community
- Tile in kitchen
- Laundry room
Tags
Neighborhood map
What this means for you Summary
Snapshot
- This is a 2 × 6-bed/?-bath units multifamily listed at $499k. Condition is rated average.
Deal economics
- At list price, monthly cash flow is $85 ($1k/yr) — positive. Per door: $43/mo.
- The deal already cash-flows at list — no discount required.
- To meet the 1% rule (rent ≥ 1% of price), the offer needs to be $447k (10.4% below list).
- Recommended offer: $447k (10.4% below list) — sets the bar for 1% rule.
- Cap rate 6.5% vs local median 3.9% in Lake Park — top-decile yield for the area; either an underpriced asset or a hidden risk that comps aren't pricing in. Stress-test before assuming the spread holds.
Location & tenants
- Location reads 69/100 on livability (#119 in GA) — a middle-class / working-renter tenant base. Strengths: cost of living A+, health & safety A+, crime A; Watch: schools D+, amenities F, commute F.
- Lowndes County (rural): math 59% / reading 52% proficiency, ranked #8 of 174 in GA (top 5%) — acceptable for families but not a draw, mixed tenant base, ~2y average lease.
- Market conditions: 189 active listings in the ZIP; solid renter incomes; 896 units permitted in Lowndes County in 2024 (0 in 5+ unit buildings).
- At $4,473/mo this rent would consume 64% of the median local household income ($84k/yr) (locally 73% of renters already pay >50% of income on rent) — very limited rent-growth headroom before tenants either downsize or default.
Forward outlook
- In year one you build about $53k of equity ($3k loan paydown + $50k appreciation (10.0% local appreciation)).
- Lowndes County population projected at +10% by 2050 — modest demand growth; plan on rents tracking national, not racing it.
- At projected returns (10.0% appreciation + 3.0% rent growth), your $140k cash investment doubles in ~3 years — after that, you're playing with house money.
- By year 2, paydown + projected appreciation supports a ~$86k cash-out refi (75% LTV) — recoverable capital for the next deal without selling this one.
Negotiation context
- It's been on market 94 days — a 9% lower offer ($454k) is reasonable based on typical stale-listing flexibility.
Questions for the listing agent
- It's been on market 94 days. Have you received any prior offers? Is the seller open to a 10% concession, seller financing, or rate buy-down credit?
- Can we see the unit-by-unit rent roll, current vacancy, and any below-market leases? What's the average tenancy length?
- What capital expenditures (roof, boiler, parking lot, exteriors) have been made in the last 5 years, and what's planned in the next 2?
- Why hasn't it sold? Are there any deal-killer items the seller is aware of (foundation, flood, title, zoning, code violations)?
- Is there a deadline driving the sale (1031 exchange, divorce, estate, relocation)? That informs how much negotiation room exists.
- Schools are D-rated, which usually means shorter tenancies and higher turnover. Who's the typical renter profile here, and what's been the actual vacancy rate?
- What's the average days-on-market for RENTAL listings here right now (not sales)? A rising rental-DOM trend means longer vacancies and softer asking-rent achievability than the comps imply.
- What's the recent tenant-quality profile in this submarket — average credit score on applications, eviction rate, late-payment / NSF rate, and stable-employment percentage? A property-management company in the area should have these aggregated.
- How much new apartment / multifamily construction is in the pipeline within 1–3 miles? Heavy new supply (>2% of stock underway) typically softens rents 12–24 months out; light construction supports rent growth.
Investment metrics
- 1% rule
- 0.90% ✗
- Cap rate
- 6.50%
- Cash-on-cash
- 0.73%
- DSCR
- 1.03
- GRM
- 9.3
CMA / ARV
No comps found within radius.
Projected returns pro-forma
10.0% appreciation · 3.0% rent growth · sell at horizon
- IRR
- 24.8%
- Equity multiple
- 2.98×
- Total profit
- $277,262
- Equity at exit
- $449,539
- IRR
- 21.9%
- Equity multiple
- 6.81×
- Total profit
- $812,358
- Equity at exit
- $969,447
Cash invested: $139,720 (down + closing). Projections, not guarantees.
Landlord ↔ Tenant lean methodology
- Overall (STATE)
- 90 Strongly Landlord-Friendly
- State Georgia
- 90 Strongly Landlord-Friendly · R+3
- County
- — inherits STATE
- City
- — inherits STATE
ZIP-level market 31632
- Home prices YoY
- 8.1%
- Active inventory
- 189
- Price-to-rent
- 18.6×
Monthly cashflow live
- Estimated rent
- $4,473 medium interval (Pro) →
- Mortgage (P&I)
- −$2,617
- Tax est. 1.5%
- −$624 /mo · $7,485/yr
- Insurance
- −$208
- HOA
- −$0
- Vacancy / Maint / Mgmt
- −$939
- Net cashflow
- $85
Break-even live
2-unit breakdown (identical units grouped — click to expand)
| Units | Beds | Baths | Est. rent |
|---|---|---|---|
| 2× units | 6 | — | $4,472 |
| #1 | 6 | — | $2,236 |
| #2 | 6 | — | $2,236 |
| Total (2 units) | $4,473 | ||
UW: 25.0% down · 7.5% · 30yr · 1.5% tax · 5.0% vac · 8.0% maint · 8.0% mgmt
Financing live
Cash to close
- Down payment
- $124,750
- Closing costs
- $14,970
- Reserves months
- —
- Total cash needed
- —
Loan-product check · same deal, 3 products live
Conventional
25% down · 7.5% · 30yr
- Down + closing
- —
- Monthly P&I
- —
- Monthly cashflow
- —
- DSCR
- —
- Eligible?
- —
Personal DTI + credit; lowest rate.
DSCR
20% down · 8.5% · 30yr
- Down + closing
- —
- Monthly P&I
- —
- Monthly cashflow
- —
- DSCR
- —
- Eligible?
- —
No personal income docs; deal must DSCR.
Hard money
10% down · 12.0% · 12mo
- Down + closing
- —
- Monthly P&I
- —
- Monthly cashflow
- —
- DSCR
- —
- Eligible?
- —
Short-term bridge; refi at stabilization.
Listing history 18 events
-
2026-06-19days on market $499,000 Active 94 DOM
-
2026-06-18days on market $499,000 Active 93 DOM
-
2026-06-17days on market $499,000 Active 92 DOM
-
2026-06-16days on market $499,000 Active 91 DOM
-
2026-06-15days on market $499,000 Active 90 DOM
-
2026-06-14days on market $499,000 Active 88 DOM
-
2026-06-13days on market $499,000 Active 87 DOM
-
2026-06-10days on market $499,000 Active 85 DOM
-
2026-06-09days on market $499,000 Active 84 DOM
-
2026-06-08days on market $499,000 Active 83 DOM
-
2026-06-07days on market $499,000 Active 82 DOM
-
2026-06-05days on market $499,000 Active 79 DOM
-
2026-06-03days on market $499,000 Active 78 DOM
-
2026-06-02days on market $499,000 Active 77 DOM
-
2026-06-01days on market $499,000 Active 76 DOM
-
2026-05-31days on market $499,000 Active 75 DOM
-
2026-05-30days on market $499,000 Active 74 DOM
-
2026-03-18$499,000 Active 611-char remark
Show marketing remark (611 chars)
Great Investment Opportunity in very popular Twin Lakes. 2 duplexes. 4 units. Each unit is 2184 square feet. 3 bedrooms and 2 . 5 baths. Tile in kitchen with refrigerator and stove. LVP throughout. Laundry room. Large backyard with patio. .46 acre lot. Great rental history. Extremely convenient location. 1 minute to Lake Park shopping, restaurants, and I-75. Boating, fishing, camping are all available in this slow pace lake community. Wild Adventures Theme Park is also easily accessible. One could live in a unit and rent the others. Great opportunity!!! One of the listing agents is related to the seller.
ⓘ Source: listings_history table (triggers on properties + properties_extension) + one-shot
backfill from property_details.listing_events for pre-trigger history.
Nearby sold comps map
Loading sold comps map…
Walkable amenities ~0.75 mi
Loading nearby amenities…
Taxation est. · year 1
- Rental income
- $53,676
- − Mortgage interest
- −$27,952
- − Property taxes
- −$7,485
- − Insurance
- −$2,495
- − Repairs & maintenance
- −$4,294
- − Management
- −$4,294
- − Depreciation
- −$14,516
- Taxable loss
- −$7,360
- Est. tax savings @ 24.0%
- +$1,766
- After-tax cash flow
- $2,789/yr
For passive investors: Depreciation is non-cash, so a rental often shows a tax loss while cash-flowing — sheltering income. Rental losses are passive: they offset passive income freely, and up to $25,000/yr can offset ordinary (W-2) income if you actively participate and your MAGI is under $100k (phasing out to $0 by $150k); unused losses carry forward. On sale, claimed depreciation is recaptured at up to 25%, and gains may owe capital-gains tax (a 1031 exchange can defer both). Figures are a year-1 estimate at your 24.0% rate — not tax advice; consult a CPA.
Condition & rehab AI · 10 photos
This property offers a good investment opportunity with a cosmetic rehab level. It requires minor repairs and maintenance, and updating the paint and landscaping can significantly increase its value.
Repairs flagged
- Minor paint — some discoloration on walls
- Minor landscaping — overgrown areas
Value-add opportunities
- Both painting — Fresh paint can enhance curb appeal and interior aesthetics
- Both landscaping — Well-maintained landscaping can improve curb appeal and attract potential tenants
Renovation cost estimate screening
| Repair item | Severity | Est. cost |
|---|---|---|
| paint · some discoloration on walls | Minor | $500–3,000 |
| landscaping · overgrown areas | Minor | $500–3,000 |
| Total estimated repair cost · 2 items | $1,000–6,000 |
Value-add ROI direction
- Both painting — Fresh paint can enhance curb appeal and interior aesthetics ↑
- Both landscaping — Well-maintained landscaping can improve curb appeal and attract potential tenants ↑
ⓘ Cost ranges are severity-bucket heuristics (US national rule-of-thumb). Get contractor quotes + a written scope before underwriting a rehab budget.
Schools (NCES district)
- District
- Lowndes County
- NCES district ID
- 1303390
- Math proficiency
- 59% ▼ -1.00%
- Reading proficiency
- 52% ▼ -2.00%
- Median HH income
- $48,221
- Composite
- 47.21/100
- National rank
- #2317
- State rank
- #8 of 174 in GA
Livability — Lake Park
- Score
- 69/100
- State rank
- #119
- US rank
- #8632
Category grades
Schools grade is shown separately in the Schools card above.
Census & demographics
- County
- Lowndes County · 107,801 people
- Metro
- Valdosta, GA
- Population (ZIP)
- 15,942
- Household income
- $83,946
- Rent vs Own
- Severe rent burden
- 73.0
Population outlook (Lowndes County) Hauer SSP2
- Today (2025)
- 120,348 people
- By 2030
- 123,469 · +2.6%
- By 2040
- 128,482 · +6.8%
- By 2050
- 131,907 · +9.6%
- By 2075
- 139,080 · +15.6%
- By 2100
- 133,649 · +11.1%
Race, ethnicity, and origin ACS 2023
- Neighborhood character
- Predominantly White (79%)
- Race & ethnicity
- White 79% Black 12% Hispanic / Latino 6% Two or more races 5%
- Hispanic origin (detail)
- Mexican 2% Puerto Rican 2%
- Common ancestry
- Slovak 3% Serbian 2% Italian 1%
- Foreign-born
- 2% · Canada, Jamaica
- Languages at home
- 96% English-only · Spanish 3%
Political lean MEDSL · Lowndes
- 2024 margin
- R (+18.0) · D 40.8% · R 58.8%
- 2008→2024 swing
- -8.6pp toward R · 2008: -9.4pp · 2024: -18.0pp
- All cycles
- 2024: R+18.0 2020: R+12.0 2016: R+18.2 2012: R+10.5 2008: R+9.4
Not yet ingested
- Civics
- —
Market trends
- HPI YoY
- ▲ 19.44%
- Current HPI
- 259.01
- Rent YoY
- —
- Metro
- Valdosta, GA
- State GDP YoY
- ▲ 2.66%
- F500 in state
- 28
Industry mix (Fortune 500 HQ in GA)
| Industry | F500 HQs | Revenue |
|---|---|---|
| Paper / Packaging | 2 | $29B |
|
||
| Retail | 1 | $160B |
|
||
| Transportation / Logistics | 1 | $91B |
|
||
| Airlines | 1 | $62B |
|
||
| Consumer Goods | 1 | $47B |
|
||
| Utilities | 1 | $25B |
|
||
Price history
1 event — show timeline
- 2026-03-18 Listed $499,000 SGMLS
Cash-flow waterfall
monthlySold comps — $/sqft
last 12 mo · ≤1 miLoading sold comps…