 5-Plex
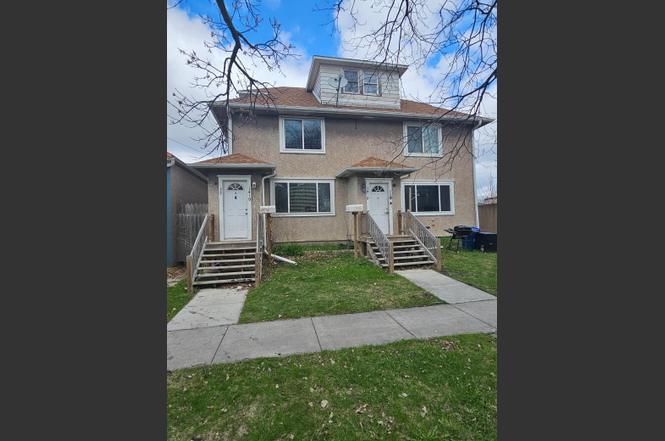
1419 4th Ave N · Fargo, ND
Flood risk 1/10 · Minimal
- FEMA flood zone
- X (shaded)
- Chance of flooding over 30 yrs
- 0.0%
- Est. flood insurance / yr
- $507 – $1,088
Fire risk 1/10 · Minimal
- Est. fire insurance / yr
- $1,289 – $2,393
Heat risk 2/10 · Minimal
- Hot days now (above 98°F)
- 7 days/yr
- Hot days in 30 yrs
- 12 days/yr
Wind risk 2/10 · Minimal
- Chance of severe wind over 30 yrs
- —
Air-quality risk 3/10 · Minor
- Unhealthy air days now
- 3 days/yr
- Unhealthy air days in 30 yrs
- 3 days/yr
Risk factors via First Street. Map © Google.
Why this score? — see what drove the B grade
The composite is a weighted blend of 9 inputs, each scored 0–100. Each bar is that input's sub-score; the figure is the points it added to the 100-point composite (weight × sub-score).
- Cash flow +30.0/30.0
- 1% rule +10.0/10.0
- DSCR +10.0/10.0
- ARV discount +7.5/15.0
- Livability +4.2/5.0
- Rent growth +3.7/5.0
- Schools +3.6/10.0
- Condition / age +2.5/5.0
- Appreciation +0.0/10.0
$269,000
🖨 Deal sheet (PDF) 📄 Offer letter ✓ Due diligence
Multi-family units
County records classify this as Multi-Family (2-4 Unit). Listing-text estimate: 5 units. estimate disagrees with records
Listing remarks MLS
CASH FLOWING investment property located close to Downtown Fargo! Enjoy a lot of new in this 4-plex. Newer plumbing, electrical, gas furnace, flooring, kitchen cabinets, vinyl windows, updated baths, water heater, and more. Get this property added to your portfolio before it's too late!
Key facts
- Parking area
- Large back yard
- 7,492 sq ft lot
Tags
Property features AI
Finance
- Financial info: Gross annual income reported: $35,478; Owner pays all utilities; Rental license: Standard
Exterior
- Parking: 1-car garage
- Utilities: City water connected; City sewer connected; Electric and natural gas service
- Home design: Residential income property; Two-story building; Not owner-occupied
- Construction: Block foundation
- Exterior features: Stucco exterior; Lot about 0.172 acres
Interior
- Bedrooms: 16 bedrooms
- Heating & cooling: Baseboard heating; Forced air heating
- Interior features: Unfinished basement; Two levels
Neighborhood map
What this means for you Summary
Snapshot
- This is a 5 × 3-bed/?-bath units multifamily listed at $269k.
Deal economics
- At list price, monthly cash flow is $4k ($44k/yr) — positive. Per door: $726/mo.
- The deal already cash-flows at list — no discount required.
- Meets the 1% rule at list price ($7k rent vs $269k).
- Recommended offer: $237k (12.0% below list) — sets the bar for market timing.
- Cap rate 22.5% vs local median 2.5% in Fargo — top-decile yield for the area; either an underpriced asset or a hidden risk that comps aren't pricing in. Stress-test before assuming the spread holds.
Location & tenants
- Location reads 85/100 on livability (#1 in ND, #605 nationally) — a professional / high-income tenant draw. Strengths: amenities A+, commute A+, cost of living A+; Watch: crime F.
- Fargo 1 (urban): math 41% / reading 44% proficiency, ranked #28 of 53 in ND (top 53%) — families likely to look elsewhere, expect single-tenant / working-renter base with shorter leases.
- Zoned schools: Horace Mann Roosevelt Elementary School (math 37% / reading 37%, grade F, #152 of 236 statewide, top 68%, 368 students, 53% FRL); Ben Franklin Middle School (math 52% / reading 47%, grade C, #6 of 35 statewide, top 18%, 883 students, 32% FRL); North High School (math 45% / reading 63%, grade C-, #13 of 144 statewide, top 8%, 1,083 students, 26% FRL).
- Market conditions: Rents rising fast (+4.7%/yr); 205 active listings in the ZIP; 1,218 units permitted in Cass County in 2024 (410 in 5+ unit buildings).
- At $6,949/mo this rent would consume 140% of the median local household income ($60k/yr) (locally 1919% of renters already pay >50% of income on rent) — very limited rent-growth headroom before tenants either downsize or default.
Forward outlook
- Local home prices are declining (-3.0%/yr); year-one equity from $2k of loan paydown is wiped out by about $8k of value loss. Plan a longer hold.
- Cass County population projected at +69% by 2050 — long-run rental-demand tailwind backs the buy-and-hold thesis.
- At projected returns (-3.0% appreciation + 4.7% rent growth), your $75k cash investment doubles in ~2 years — after that, you're playing with house money.
Negotiation context
- It's been on market 235 days — a 12% lower offer ($237k) is reasonable based on typical stale-listing flexibility.
- 6 sale attempts since 11y ago with the ask held roughly flat each time — persistent listings suggest the price (not the market) is what's stuck; bring a comps-based counter.
Risks & watch-outs
- Watch-outs: built in 1900 — expect roof / HVAC / electrical / plumbing capex.
Questions for the listing agent
- It's been on market 235 days. Have you received any prior offers? Is the seller open to a 12% concession, seller financing, or rate buy-down credit?
- Can we see the unit-by-unit rent roll, current vacancy, and any below-market leases? What's the average tenancy length?
- What capital expenditures (roof, boiler, parking lot, exteriors) have been made in the last 5 years, and what's planned in the next 2?
- Built in 1900 — when were the roof, HVAC, electrical panel, plumbing, and water heater last replaced?
- Why hasn't it sold? Are there any deal-killer items the seller is aware of (foundation, flood, title, zoning, code violations)?
- Is there a deadline driving the sale (1031 exchange, divorce, estate, relocation)? That informs how much negotiation room exists.
- Crime grade is F in this area — have there been break-ins, vandalism, or insurance claims at this property in the last 3 years? What carrier currently insures it and at what premium?
- What's the average days-on-market for RENTAL listings here right now (not sales)? A rising rental-DOM trend means longer vacancies and softer asking-rent achievability than the comps imply.
- What's the recent tenant-quality profile in this submarket — average credit score on applications, eviction rate, late-payment / NSF rate, and stable-employment percentage? A property-management company in the area should have these aggregated.
- How much new apartment / multifamily construction is in the pipeline within 1–3 miles? Heavy new supply (>2% of stock underway) typically softens rents 12–24 months out; light construction supports rent growth.
Investment metrics
- 1% rule
- 2.58% ✓
- Cap rate
- 22.49%
- Cash-on-cash
- 57.84%
- DSCR
- 3.57
- GRM
- 3.2
CMA / ARV
No comps found within radius.
Projected returns pro-forma
-3.0% appreciation · 4.71% rent growth · sell at horizon
- IRR
- 58.3%
- Equity multiple
- 3.65×
- Total profit
- $199,916
- Equity at exit
- $40,109
- IRR
- 63.8%
- Equity multiple
- 7.96×
- Total profit
- $523,940
- Equity at exit
- $23,258
Cash invested: $75,320 (down + closing). Projections, not guarantees.
Landlord ↔ Tenant lean methodology
- Overall (STATE)
- 82 Strongly Landlord-Friendly
- State North Dakota
- 82 Strongly Landlord-Friendly · R+20
- County
- — inherits STATE
- City
- — inherits STATE
ZIP-level market 58102
- Rents YoY
- 4.7%
- Active inventory
- 205
- Price-to-rent
- 16.1×
Monthly cashflow live
- Estimated rent
- $6,949 high interval (Pro) →
- Mortgage (P&I)
- −$1,411
- Tax est. 1.5%
- −$336 /mo · $4,035/yr
- Insurance
- −$112
- HOA
- −$0
- Vacancy / Maint / Mgmt
- −$1,459
- Net cashflow
- $3,631
Break-even live
Sensitivity live
| Price | -10% $3,817 | -5% $3,724 | +0% $3,631 | +5% $3,538 | +10% $3,445 |
|---|---|---|---|---|---|
| Rent | -10% $3,082 | -5% $3,356 | +0% $3,631 | +5% $3,905 | +10% $4,180 |
| Rate | -1.0pp $3,766 | -0.5pp $3,699 | base $3,631 | +0.5pp $3,561 | +1.0pp $3,490 |
5-unit breakdown (identical units grouped — click to expand)
| Units | Beds | Baths | Est. rent |
|---|---|---|---|
| 5× units | 3 | — | $6,950 |
| #1 | 3 | — | $1,390 |
| #2 | 3 | — | $1,390 |
| #3 | 3 | — | $1,390 |
| #4 | 3 | — | $1,390 |
| #5 | 3 | — | $1,390 |
| Total (5 units) | $6,949 | ||
UW: 25.0% down · 7.5% · 30yr · 1.5% tax · 5.0% vac · 8.0% maint · 8.0% mgmt
Financing live
Cash to close
- Down payment
- $67,250
- Closing costs
- $8,070
- Reserves months
- —
- Total cash needed
- —
Loan-product check · same deal, 3 products live
Conventional
25% down · 7.5% · 30yr
- Down + closing
- —
- Monthly P&I
- —
- Monthly cashflow
- —
- DSCR
- —
- Eligible?
- —
Personal DTI + credit; lowest rate.
DSCR
20% down · 8.5% · 30yr
- Down + closing
- —
- Monthly P&I
- —
- Monthly cashflow
- —
- DSCR
- —
- Eligible?
- —
No personal income docs; deal must DSCR.
Hard money
10% down · 12.0% · 12mo
- Down + closing
- —
- Monthly P&I
- —
- Monthly cashflow
- —
- DSCR
- —
- Eligible?
- —
Short-term bridge; refi at stabilization.
Listing history 26 events
-
2026-06-21days on market $269,000 Active 235 DOM
-
2026-06-18days on market $269,000 Active 232 DOM
-
2026-06-17days on market $269,000 Active 231 DOM
-
2026-06-16days on market $269,000 Active 230 DOM
-
2026-06-15days on market $269,000 Active 229 DOM
-
2026-06-14days on market $269,000 Active 227 DOM
-
2026-06-13days on market $269,000 Active 226 DOM
-
2026-06-10days on market $269,000 Active 224 DOM
-
2026-06-09days on market $269,000 Active 223 DOM
-
2026-06-08days on market $269,000 Active 222 DOM
-
2026-06-07days on market $269,000 Active 221 DOM
-
2026-06-02days on market $269,000 Active 216 DOM
-
2026-06-01days on market $269,000 Active 215 DOM
-
2026-05-31days on market $269,000 Active 214 DOM
-
2026-05-30days on market $269,000 Active 213 DOM
-
2025-10-29$269,000 Active
-
2025-06-21historical
-
2025-05-02$280,000 Active
-
2022-02-21soldstatus $260,000 287-char remark
Show marketing remark (287 chars)
CASH FLOWING investment property located close to Downtown Fargo! Enjoy a lot of new in this 4-plex. Newer plumbing, electrical, gas furnace, flooring, kitchen cabinets, vinyl windows, updated baths, water heater, and more. Get this property added to your portfolio before it's too late!
-
2022-01-17$270,000 287-char remark
Show marketing remark (287 chars)
CASH FLOWING investment property located close to Downtown Fargo! Enjoy a lot of new in this 4-plex. Newer plumbing, electrical, gas furnace, flooring, kitchen cabinets, vinyl windows, updated baths, water heater, and more. Get this property added to your portfolio before it's too late!
-
2019-08-21historical
-
2019-05-21$239,900
-
2019-03-31historical
-
2018-11-15$269,900
-
2015-06-05soldstatus $90,300
-
2015-04-17$88,100
ⓘ Source: listings_history table (triggers on properties + properties_extension) + one-shot
backfill from property_details.listing_events for pre-trigger history.
Climate risk First Street
- Flood 1/10 Low FEMA zone X (shaded) · 0% chance over 30 yrs
- Wildfire 1/10 Low
- Heat 2/10 Low 7 d/yr ≥98°F today · 12 d/yr by 30 yrs out
- Wind 2/10 Low
- Air quality 3/10 Moderate 3 unhealthy d/yr today · 3 by 30 yrs out
Nearby sold comps map
Loading sold comps map…
Walkable amenities ~0.75 mi
Loading nearby amenities…
Taxation est. · year 1
- Rental income
- $83,388
- − Mortgage interest
- −$15,068
- − Property taxes
- −$4,035
- − Insurance
- −$1,345
- − Repairs & maintenance
- −$6,671
- − Management
- −$6,671
- − Depreciation
- −$7,825
- Taxable income
- $41,772
- Est. tax owed @ 24.0%
- −$10,025
- After-tax cash flow
- $33,543/yr
For passive investors: Depreciation is non-cash, so a rental often shows a tax loss while cash-flowing — sheltering income. Rental losses are passive: they offset passive income freely, and up to $25,000/yr can offset ordinary (W-2) income if you actively participate and your MAGI is under $100k (phasing out to $0 by $150k); unused losses carry forward. On sale, claimed depreciation is recaptured at up to 25%, and gains may owe capital-gains tax (a 1031 exchange can defer both). Figures are a year-1 estimate at your 24.0% rate — not tax advice; consult a CPA.
Schools (NCES district)
- District
- Fargo 1
- NCES district ID
- 3806780
- Math proficiency
- 41% ▼ -7.00%
- Reading proficiency
- 44% ▼ -7.00%
- Median HH income
- $46,524
- Composite
- 36.23/100
- National rank
- #4721
- State rank
- #28 of 53 in ND
Livability — Fargo
- Score
- 85/100
- State rank
- #1
- US rank
- #605
Category grades
Schools grade is shown separately in the Schools card above.
Census & demographics
- Census place
- Fargo, ND
- County
- Cass County · 177,143 people
- City population
- 130,876
- Metro
- Fargo, ND-MN
- Population (ZIP)
- 32,912
- Household income
- $59,533
- Rent vs Own
- Severe rent burden
- 1919.0
Population outlook (Cass County) Hauer SSP2
- Today (2025)
- 223,771 people
- By 2030
- 251,835 · +12.5%
- By 2040
- 311,816 · +39.3%
- By 2050
- 378,694 · +69.2%
- By 2075
- 571,386 · +155.3%
- By 2100
- 769,727 · +244.0%
Race, ethnicity, and origin ACS 2023
- Neighborhood character
- Predominantly White (84%)
- Race & ethnicity
- White 84% Hispanic / Latino 5% Two or more races 5% Black 4% Asian 3%
- Hispanic origin (detail)
- Mexican 2% Puerto Rican 2%
- Common ancestry
- Portuguese 27% Romanian 3% Scottish 2%
- Foreign-born
- 4% · Canada, China
- Languages at home
- 92% English-only · Spanish 3% Other Indo-European 2%
Political lean MEDSL · Cass
- 2024 margin
- Lean R (+8.4) · D 44.9% · R 53.3% · Other 1.9%
- 2008→2024 swing
- -15.5pp toward R · 2008: 7.1pp · 2024: -8.4pp
- All cycles
- 2024: R+8.4 2020: R+2.7 2016: R+10.7 2012: R+3.0 2008: D+7.1
Not yet ingested
- Civics
- —
Market trends
- HPI YoY
- ▼ -171.16%
- Current HPI
- 155.885
- Rent YoY
- ▲ 4.71%
- Metro
- Fargo, ND-MN
- State GDP YoY
- ▲ 2.09%
- F500 in state
- 2
Industry mix (Fortune 500 HQ in ND)
| Industry | F500 HQs | Revenue |
|---|---|---|
| Utilities / Construction | 1 | $6B |
|
||
Price history
+205.3% since first listed11 events — show timeline
- 2025-10-29 Listed $269,000 NORTHSTARMLS as Distributed by MLS Grid
- 2025-06-21 Listing Removed — NORTHSTARMLS as Distributed by MLS Grid
- 2025-05-02 Listed $280,000 NORTHSTARMLS as Distributed by MLS Grid
- 2022-02-21 Sold (MLS) $260,000 NORTHSTARMLS as Distributed by MLS Grid
- 2022-01-17 Listed $270,000 NORTHSTARMLS as Distributed by MLS Grid
- 2019-08-21 Listing Removed — NORTHSTARMLS as Distributed by MLS Grid
- 2019-05-21 Listed $239,900 NORTHSTARMLS as Distributed by MLS Grid
- 2019-03-31 Listing Removed — NORTHSTARMLS as Distributed by MLS Grid
- 2018-11-15 Listed $269,900 NORTHSTARMLS as Distributed by MLS Grid
- 2015-06-05 Sold (MLS) $90,300 NORTHSTARMLS as Distributed by MLS Grid
- 2015-04-17 Listed $88,100 NORTHSTARMLS as Distributed by MLS Grid
Cash-flow waterfall
monthlySold comps — $/sqft
last 12 mo · ≤1 miLoading sold comps…