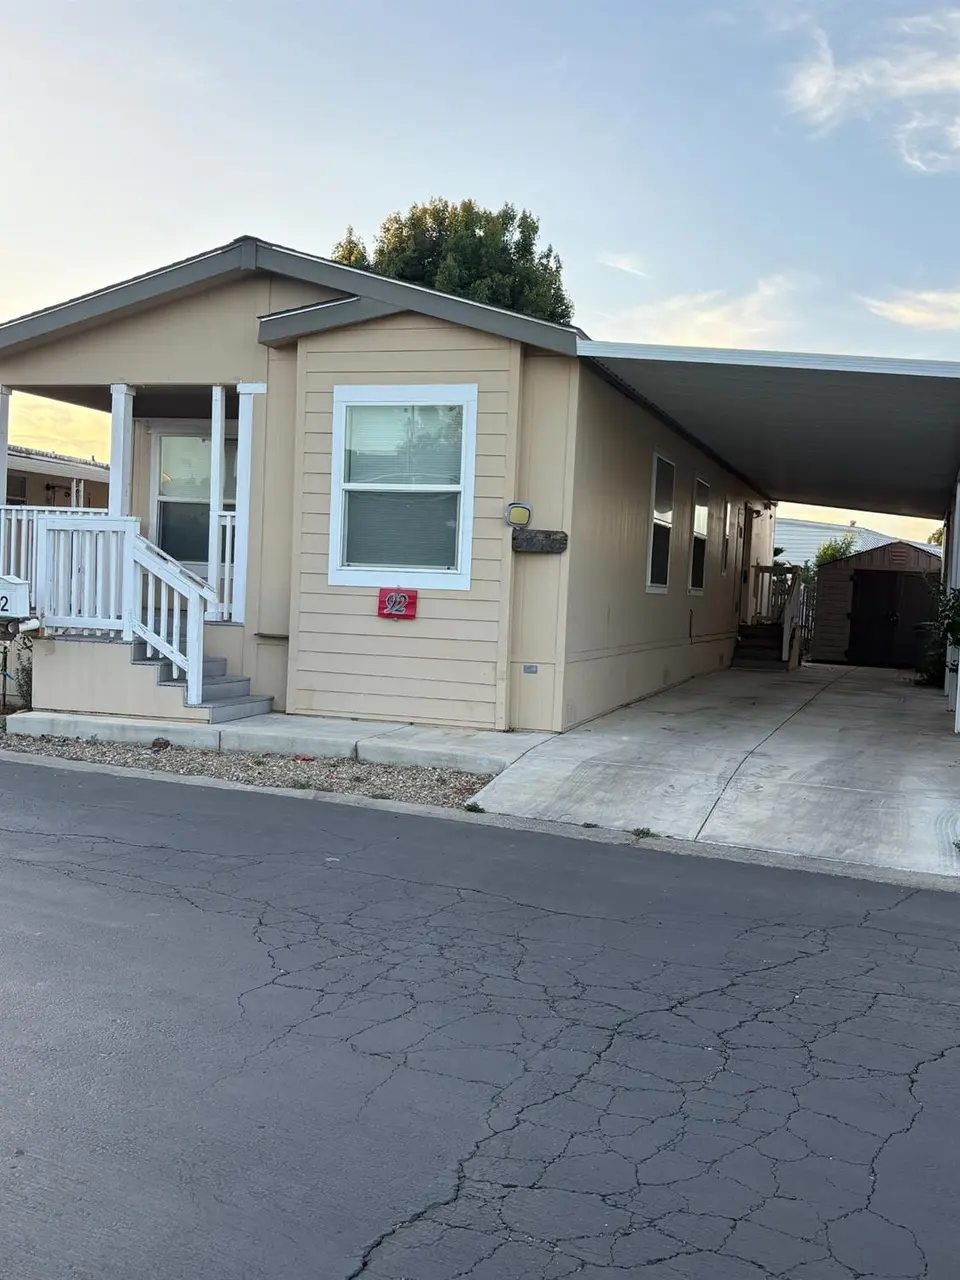
8600 West Ln #92 · Stockton, CA
Flood risk 1/10 · Minimal
- FEMA flood zone
- X
- Chance of flooding over 30 yrs
- 0.0%
- Est. flood insurance / yr
- $507 – $1,088
Fire risk 3/10 · Minor
- Est. fire insurance / yr
- $659 – $1,223
Heat risk 6/10 · Moderate
- Hot days now (above 102°F)
- 6 days/yr
- Hot days in 30 yrs
- 13 days/yr
Wind risk 1/10 · Minimal
- Chance of severe wind over 30 yrs
- —
Air-quality risk 10/10 · Severe
- Unhealthy air days now
- 30 days/yr
- Unhealthy air days in 30 yrs
- 30 days/yr
Risk factors via First Street. Map © Google.
Why this score? — see what drove the B+ grade
The composite is a weighted blend of 9 inputs, each scored 0–100. Each bar is that input's sub-score; the figure is the points it added to the 100-point composite (weight × sub-score).
- Cash flow +30.0/30.0
- 1% rule +10.0/10.0
- DSCR +10.0/10.0
- Appreciation +10.0/10.0
- ARV discount +7.8/15.0
- Rent growth +3.5/5.0
- Livability +2.9/5.0
- Condition / age +2.8/5.0
- Schools +2.7/10.0
$110,000
🖨 Deal sheet 📄 Offer letter ✓ Due diligence
Listing remarks
BACK ON THE MARKET, NO FAULT OF SELLER11 VERY MOTIVATED SELLER!! Mobile unit is 5 years old. Senior living in a quiet park. Great if you are looking for space, value and potential. You can enjoy it in it's as-is condition or slowly make it your own with upgrades over time. A $1000.00 credit towards painting will help jumpstart your project. Fruit trees, nice shed for storage and well maintained yard. Nice porch for those nice evenings. Ceiling fans throughout. Close to shopping, churches, restaurants, Costco, medical facilities and easy access to freeways. Public transportation close outside the park. Come and enjoy your viewing of what could be home. Refrigerator not included in sale.
Key facts
- Well maintained yard
- Nice porch
- Ceiling fans
Tags
Neighborhood map
What this means for you Summary
Snapshot
- This is a 2-bed/2.0-bath manufactured listed at $110k. Condition is rated average.
Deal economics
- At list price, monthly cash flow is $707 ($8k/yr) — positive.
- The deal already cash-flows at list — no discount required.
- Meets the 1% rule at list price ($2k rent vs $110k).
- Recommended offer: $108k (1.5% below list) — sets the bar for market timing.
- Cap rate 14.0% vs local median 3.6% in Stockton — top-decile yield for the area; either an underpriced asset or a hidden risk that comps aren't pricing in. Stress-test before assuming the spread holds.
Location & tenants
- Location reads 57/100 on livability (#734 in CA) — a working-class tenant base; expect higher turnover. Strengths: housing A+, health & safety A, amenities A-; Watch: employment C-, schools D-, crime F.
- Lodi Unified (urban): math 24% / reading 36% proficiency, ranked #325 of 517 in CA (top 63%) — families likely to look elsewhere, expect single-tenant / working-renter base with shorter leases.
- Market conditions: Rents rising fast (+4.2%/yr); 213 active listings in the ZIP; 23 comparable units currently listed for rent nearby; rentals at typical pace (median 23d on market — plan ~3-4 weeks tenant-placement turnaround); 43% of comp listings sitting > 30 days — soft ceiling on asking rent; high-income renter base; 3,779 units permitted in San Joaquin County in 2024 (0 in 5+ unit buildings).
Forward outlook
- In year one you build about $12k of equity ($761 loan paydown + $11k appreciation (10.0% local appreciation)).
- San Joaquin County population projected at +17% by 2050 — long-run rental-demand tailwind backs the buy-and-hold thesis.
- At projected returns (10.0% appreciation + 4.2% rent growth), your $31k cash investment doubles in ~2 years — after that, you're playing with house money.
- By year 4, paydown + projected appreciation supports a ~$42k cash-out refi (75% LTV) — recoverable capital for the next deal without selling this one.
Negotiation context
- It's been on market 19 days — a 2% lower offer ($108k) is reasonable based on typical stale-listing flexibility.
Risks & watch-outs
- Climate carrying-cost: extreme-heat days projected 6→13/yr by 2055 (HVAC capex compounding) — expect insurance premiums to compound above CPI over the hold.
Questions for the listing agent
- Is there a deadline driving the sale (1031 exchange, divorce, estate, relocation)? That informs how much negotiation room exists.
- Schools are D-rated, which usually means shorter tenancies and higher turnover. Who's the typical renter profile here, and what's been the actual vacancy rate?
- Crime grade is F in this area — have there been break-ins, vandalism, or insurance claims at this property in the last 3 years? What carrier currently insures it and at what premium?
- What's the average days-on-market for RENTAL listings here right now (not sales)? A rising rental-DOM trend means longer vacancies and softer asking-rent achievability than the comps imply.
- What's the recent tenant-quality profile in this submarket — average credit score on applications, eviction rate, late-payment / NSF rate, and stable-employment percentage? A property-management company in the area should have these aggregated.
- How much new for-sale + rental construction is in the pipeline within 1–3 miles? Heavy new supply typically softens prices + rents 12–24 months out; constrained supply supports both.
Investment metrics
- 1% rule
- 1.69% ✓
- Cap rate
- 14.01%
- Cash-on-cash
- 27.54%
- DSCR
- 2.23
- GRM
- 4.9
CMA / ARV
- ARV (on-the-fly)
- $110,800
- Comps found
- 12
Show comp detail 12 sales within ~0.75 mi
| Address | Dist | Beds/Ba | Sqft | Sold | Price | $/sf | Match |
|---|---|---|---|---|---|---|---|
| 8600 West Ln #25 | 0.00mi | 3/2.0 (+1) | 1,064 (-4%) | 11mo | $143,000 | $134 | 79 |
| 8600 West Ln | 0.09mi | 2/2.0 | 1,000 (-10%) | 1mo | $34,000 | $34 | 79 |
| 8700 NW 8700 West Ln #44 | 0.12mi | 2/2.0 | 1,080 (-2%) | 16mo | $110,000 | $102 | 77 |
| 8600 West Ln #19 | 0.00mi | 2/2.0 | 1,040 (-6%) | 15mo | $110,000 | $106 | 77 |
| 8600 West Ln #7 | 0.00mi | 2/2.0 | 1,200 (+8%) | 14mo | $122,500 | $102 | 74 |
| 8700 West Ln #186 | 0.11mi | 2/2.0 | 1,248 (+13%) | 0mo | $85,000 | $68 | 74 |
| 8700 West Ln #3 | 0.15mi | 2/2.0 | 1,152 (+4%) | 16mo | $115,000 | $100 | 73 |
| 8600 West Ln #116 | 0.00mi | 2/2.0 | 960 (-13%) | 8mo | $60,500 | $63 | 72 |
| 8700 West Ln #72 | 0.12mi | 2/2.0 | 1,200 (+8%) | 15mo | $140,000 | $117 | 68 |
| 8600 West Ln #146 | 0.00mi | 3/2.0 (+1) | 1,200 (+8%) | 19mo | $68,000 | $57 | 65 |
| 8600 West Ln #68 | 0.19mi | 2/1.0 | 960 (-13%) | 6mo | $85,000 | $89 | 59 |
| 152 Clearwater Pl | 0.23mi | 3/2.0 (+1) | 1,200 (+8%) | 14mo | $65,000 | $54 | 59 |
Match score weights: distance 35% · size 25% · config 20% · recency 20%. Top-matched comps best support the ARV.
Projected returns pro-forma
10.0% appreciation · 4.16% rent growth · sell at horizon
- IRR
- 45.8%
- Equity multiple
- 4.48×
- Total profit
- $107,155
- Equity at exit
- $99,097
- IRR
- 40.2%
- Equity multiple
- 10.25×
- Total profit
- $284,867
- Equity at exit
- $213,706
Cash invested: $30,800 (down + closing). Projections, not guarantees.
Landlord ↔ Tenant lean methodology
- Overall (STATE)
- 18 Strongly Tenant-Friendly
- State California
- 18 Strongly Tenant-Friendly · D+13
- County
- — inherits STATE
- City
- — inherits STATE
ZIP-level market 95219
- Home prices YoY
- 6.6%
- Rents YoY
- 4.2%
- Active inventory
- 213
- Price-to-rent
- 4.9×
Monthly cashflow live
- Estimated rent
- $1,857 high interval (Pro) →
- Mortgage (P&I)
- −$577
- Tax est. 1.5%
- −$138 /mo · $1,650/yr
- Insurance
- −$46
- HOA
- −$0
- Vacancy / Maint / Mgmt
- −$390
- Net cashflow
- $707
Break-even live
UW: 25.0% down · 7.5% · 30yr · 1.5% tax · 5.0% vac · 8.0% maint · 8.0% mgmt
Financing live
Cash to close
- Down payment
- $27,500
- Closing costs
- $3,300
- Reserves months
- —
- Total cash needed
- —
Loan-product check · same deal, 3 products live
Conventional
25% down · 7.5% · 30yr
- Down + closing
- —
- Monthly P&I
- —
- Monthly cashflow
- —
- DSCR
- —
- Eligible?
- —
Personal DTI + credit; lowest rate.
DSCR
20% down · 8.5% · 30yr
- Down + closing
- —
- Monthly P&I
- —
- Monthly cashflow
- —
- DSCR
- —
- Eligible?
- —
No personal income docs; deal must DSCR.
Hard money
10% down · 12.0% · 12mo
- Down + closing
- —
- Monthly P&I
- —
- Monthly cashflow
- —
- DSCR
- —
- Eligible?
- —
Short-term bridge; refi at stabilization.
Rent comps 23 comps
| Address | Beds | Baths | Sqft | Rent | $/sqft | DOM | Units | Dist |
|---|---|---|---|---|---|---|---|---|
| 9211 Dalewood St Stockton, CA | 2.0 | 1.0 | 898 | $1,495 | $1.66 | 3d | 1 | 0.30mi |
| 1768 Crestwood Cir Stockton, CA | 3.0 | 2.0 | 1389 | $2,500 | $1.80 | 43d | 1 | 0.31mi |
| 1031 Fallbrook Dr Stockton, CA | 2.0 | 2.0 | 962 | $1,695 | $1.76 | 43d | 1 | 0.40mi |
| 7936 Montauban Ave Unit Labs Stockton, CA | 2.0 | 2.0 | 1000 | $1,700 | $1.70 | 10d | 1 | 0.51mi |
| 826 Astor Dr Stockton, CA | 2.0 | 1.0 | 850 | $1,400 | $1.65 | 23d | 1 | 0.65mi |
| 718 Bedlow Dr Stockton, CA | 2.0 | 1.0 | 929 | $1,250 | $1.35 | 43d | 1 | 0.71mi |
| 718 Bedlow Dr Unit 720 Stockton, CA | 2.0 | 1.0 | 929 | $1,250 | $1.35 | 2d | 1 | 0.71mi |
| 326 Sue Ct Stockton, CA | 3.0 | 2.0 | 1153 | $2,495 | $2.16 | 23d | 1 | 0.84mi |
| 326 Sue Ct Stockton, CA | 3.0 | 2.0 | 1153 | $2,495 | $2.16 | 21d | 1 | 0.84mi |
| 7409 Village Green Dr Stockton, CA | 3.0 | 2.0 | 1141 | $2,000 | $1.75 | 43d | 1 | 0.89mi |
| 7926 Diana Marie Dr Unit 7926 Stockton, CA | 2.0 | 1.0 | 900 | $1,800 | $2.00 | 2d | 1 | 0.96mi |
| 307 Goya Dr Stockton, CA | 2.0 | 1.0 | 808 | $1,395 | $1.73 | 43d | 1 | 1.04mi |
| 6465 West Ln Stockton, CA | 2.0 | 1.0 | 1200 | $1,625 | $1.35 | 44d | 1 | 1.13mi |
| 8446 N El Dorado St Stockton, CA | 3.0 | 2.0 | 1269 | $2,300 | $1.81 | 43d | 1 | 1.26mi |
| 7620 N El Dorado St Stockton, CA | 1.0–3.0 | 1.0–2.0 | 827 | $1,538 | $1.86 | 43d | 1 | 1.31mi |
| 6807 N El Dorado St Stockton, CA | 2.0 | 1.5 | 980 | $1,750 | $1.79 | 23d | 1 | 1.32mi |
| 8125 Kiltie Way Unit 8125 Stockton, CA | 2.0 | 1.0 | 800 | $1,600 | $2.00 | 18d | 1 | 1.38mi |
| 764 E Swain Rd Stockton, CA | 2.0 | 1.0 | 915 | $1,675 | $1.83 | 10d | 1 | 1.43mi |
| 764 E Swain Rd Unit SW-12 Stockton, CA | 2.0 | 1.0 | 915 | $1,655 | $1.81 | 18d | 1 | 1.43mi |
| 764 E Swain Rd Unit SW-05 Stockton, CA | 2.0 | 1.0 | 915 | $1,675 | $1.83 | 2d | 1 | 1.43mi |
| 8626 Acapulco Way Unit 4 Stockton, CA | 3.0 | 2.0 | 1154 | $1,895 | $1.64 | 43d | 1 | 1.49mi |
| 8650 Acapulco Way Stockton, CA | 3.0 | 1.5 | 1100 | $2,000 | $1.82 | 43d | 1 | 1.49mi |
| 742 Ponce De Leon Ave Apt 2 Stockton, CA | 3.0 | 1.5 | 1200 | $1,825 | $1.52 | 10d | 1 | 1.49mi |
Climate risk First Street
- Flood 1/10 Low FEMA zone X · 0% chance over 30 yrs
- Wildfire 3/10 Moderate
- Heat 6/10 Major 6 d/yr ≥102°F today · 13 d/yr by 30 yrs out
- Wind 1/10 Low
- Air quality 10/10 Extreme 30 unhealthy d/yr today · 30 by 30 yrs out
Nearby sold comps map
Loading sold comps map…
Walkable amenities ~0.75 mi
Loading nearby amenities…
Taxation est. · year 1
- Rental income
- $22,286
- − Mortgage interest
- −$6,162
- − Property taxes
- −$1,650
- − Insurance
- −$550
- − Repairs & maintenance
- −$1,783
- − Management
- −$1,783
- − Depreciation
- −$3,200
- Taxable income
- $7,158
- Est. tax owed @ 24.0%
- −$1,718
- After-tax cash flow
- $6,765/yr
For passive investors: Depreciation is non-cash, so a rental often shows a tax loss while cash-flowing — sheltering income. Rental losses are passive: they offset passive income freely, and up to $25,000/yr can offset ordinary (W-2) income if you actively participate and your MAGI is under $100k (phasing out to $0 by $150k); unused losses carry forward. On sale, claimed depreciation is recaptured at up to 25%, and gains may owe capital-gains tax (a 1031 exchange can defer both). Figures are a year-1 estimate at your 24.0% rate — not tax advice; consult a CPA.
Condition & rehab AI · 5 photos
This mobile home is in average condition with minor repairs needed, offering a good starting point for a cosmetic renovation.
Repairs flagged
- Minor Paint — Paint appears slightly worn
- Minor Ceiling fans — Ceiling fans are present but may need cleaning
Value-add opportunities
- Both Painting — Fresh paint can improve both resale and rental value
- Both Ceiling fans — Clean ceiling fans can enhance comfort and value
- Both Landscaping — Landscaping can significantly boost curb appeal and value
Renovation cost estimate screening
| Repair item | Severity | Est. cost |
|---|---|---|
| Paint · Paint appears slightly worn | Minor | $500–3,000 |
| Ceiling fans · Ceiling fans are present but may need cleaning | Minor | $500–3,000 |
| Total estimated repair cost · 2 items | $1,000–6,000 |
Value-add ROI direction
- Both Painting — Fresh paint can improve both resale and rental value ↑
- Both Ceiling fans — Clean ceiling fans can enhance comfort and value ↑
- Both Landscaping — Landscaping can significantly boost curb appeal and value ↑
ⓘ Cost ranges are severity-bucket heuristics (US national rule-of-thumb). Get contractor quotes + a written scope before underwriting a rehab budget.
Schools (NCES district)
- District
- Lodi Unified
- NCES district ID
- 0622230
- Math proficiency
- 24% ▼ -8.00%
- Reading proficiency
- 36% ▼ -8.00%
- Median HH income
- $57,165
- Composite
- 26.84/100
- National rank
- #7108
- State rank
- #325 of 517 in CA
Livability — Stockton
- Score
- 57/100
- State rank
- #734
- US rank
- #21638
Category grades
Schools grade is shown separately in the Schools card above.
Census & demographics
- Census place
- Stockton, CA
- County
- San Joaquin County · 729,570 people
- City population
- 332,006
- Metro
- Stockton, CA
- Population (ZIP)
- 31,713
- Household income
- $112,268
- Rent vs Own
- Severe rent burden
- 825.0
Population outlook (San Joaquin County) Hauer SSP2
- Today (2025)
- 796,965 people
- By 2030
- 828,849 · +4.0%
- By 2040
- 885,611 · +11.1%
- By 2050
- 929,798 · +16.7%
- By 2075
- 994,578 · +24.8%
- By 2100
- 971,291 · +21.9%
Race, ethnicity, and origin ACS 2023
- Neighborhood character
- Highly diverse neighborhood (Simpson 0.75)
- Race & ethnicity
- White 33% Hispanic / Latino 30% Asian 21% Two or more races 18% Black 9%
- Hispanic origin (detail)
- Mexican 27%
- Common ancestry
- Slovak 2% Italian 2% Portuguese 1%
- Foreign-born
- 20% · Canada, China, Vietnam
- Languages at home
- 69% English-only · Spanish 14% Other Indo-European 4% Other Asian/Pacific 4%
Political lean MEDSL · San Joaquin
- 2024 margin
- Toss-up / Even · D 48.0% · R 48.9% · Other 3.0%
- 2008→2024 swing
- -11.6pp toward R · 2008: 10.7pp · 2024: -0.9pp
- All cycles
- 2024: R+0.9 2020: D+13.9 2016: D+12.9 2012: D+8.9 2008: D+10.7
Not yet ingested
- Civics
- —
Market trends
- HPI YoY
- ▲ 69.26%
- Current HPI
- 1122.61
- Rent YoY
- ▲ 4.16%
- Metro
- Stockton, CA
- State GDP YoY
- ▲ 3.21%
- F500 in state
- 116
Industry mix (Fortune 500 HQ in CA)
| Industry | F500 HQs | Revenue |
|---|---|---|
| Technology | 27 | $1,492B |
|
||
| Financial Services | 3 | $174B |
|
||
| Retail | 3 | $44B |
|
||
| Insurance | 3 | $26B |
|
||
| Media / Entertainment | 2 | $115B |
|
||
| Pharmaceuticals / Biotech | 2 | $62B |
|
||
Cash-flow waterfall
monthlySold comps — $/sqft
last 12 mo · ≤1 miLoading sold comps…