 Duplex
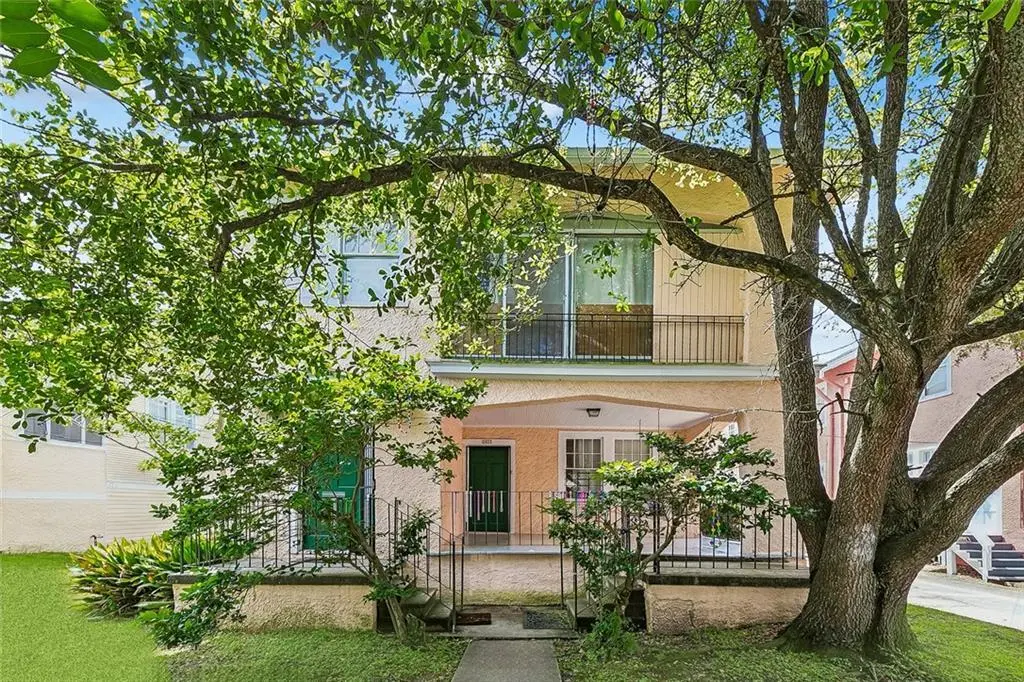
1617-19 Broadway St · New Orleans, LA
Flood risk 8/10 · Major
- FEMA flood zone
- X (shaded)
- Chance of flooding over 30 yrs
- 0.6%
- Est. flood insurance / yr
- $507 – $1,088
Fire risk 1/10 · Minimal
- Est. fire insurance / yr
- $1,269 – $2,357
Heat risk 10/10 · Severe
- Hot days now (above 108°F)
- 7 days/yr
- Hot days in 30 yrs
- 21 days/yr
Wind risk 10/10 · Severe
- Chance of severe wind over 30 yrs
- 99.0%
Air-quality risk 3/10 · Minor
- Unhealthy air days now
- 3 days/yr
- Unhealthy air days in 30 yrs
- 4 days/yr
Risk factors via First Street. Map © Google.
Why this score? — see what drove the D+ grade
The composite is a weighted blend of 9 inputs, each scored 0–100. Each bar is that input's sub-score; the figure is the points it added to the 100-point composite (weight × sub-score).
- Cash flow +21.0/30.0
- DSCR +6.7/10.0
- 1% rule +5.0/10.0
- Livability +4.0/5.0
- Rent growth +2.7/5.0
- Condition / age +2.5/5.0
- Schools +1.6/10.0
- ARV discount +1.4/15.0
- Appreciation +0.0/10.0
$625,000
🖨 Deal sheet (PDF) 📄 Offer letter ✓ Due diligence
Multi-family units
County records classify this as Multi-Family (2-4 Unit). Listing-text estimate: 2 units. confirmed
Listing remarks MLS
Exceptional investment opportunity in the heart of Uptown New Orleans! This classic duplex at 1617-19 Broadway Street is ideally situated just blocks from Tulane University, Loyola University, Audubon Park, and the vibrant shops, restaurants, and entertainment along Maple Street and Carrollton Avenue. The property offers two spacious units with timeless New Orleans character, high ceilings, abundant natural light, and the flexibility to serve as an income-producing investment or owner-occupied residence. Set on a desirable Broadway Street location, the property combines historic charm with strong rental appeal in one of the city's most sought-after neighborhoods. Tenants and owners alike will appreciate the walkability, proximity to the St. Charles Avenue streetcar, and easy access to downtown, the universities, and all that Uptown has to offer. Whether you're looking to expand your investment portfolio or secure a property in a premier New Orleans location, this duplex presents a rare opportunity in an area known for consistent demand and enduring value.
Key facts
- Two spacious units
- High ceilings
- Classic duplex
Tags
Property features AI
Finance
- Financial info: Two-unit property; Tenants pay electricity, gas, and water
Exterior
- Parking: Attached carport
- Utilities: Public water; Public sewer
- Home design: Two-story property; Raised foundation; Very good condition
- Construction: Stucco construction; Shingle roof; Built with raised foundation
- Exterior features: Porch; City lot; Rectangular lot; Lot dimensions approximately 45 x 120
Interior
- Bathrooms: Four full bathrooms
- Heating & cooling: Central heating; Window unit heating; Central air conditioning; Window unit air conditioning
- Interior features: Porch
- Laundry & utility: Laundry room
Neighborhood map
What this means for you Summary
Snapshot
- This is a 2 × 4-bed/2.0-bath units multifamily listed at $625k.
Deal economics
- At list price, monthly cash flow is $813 ($10k/yr) — positive. Per door: $406/mo.
- The deal already cash-flows at list — no discount required.
- Meets the 1% rule at list price ($6k rent vs $625k).
- Cap rate 8.0% vs local median 4.4% in New Orleans — top-decile yield for the area; either an underpriced asset or a hidden risk that comps aren't pricing in. Stress-test before assuming the spread holds.
Location & tenants
- Location reads 81/100 on livability (#3 in LA, #1,383 nationally) — a professional / high-income tenant draw. Strengths: amenities A+, commute A+, health & safety A+; Watch: crime C-, employment D.
- Orleans Parish (urban): math 11% / reading 27% proficiency, ranked #69 of 98 in LA (top 70%) — low school quality limits family demand, transient renter base, plan for 1-2y turnover; 68% free/reduced lunch — lower-income household profile, screen leases tightly.
- Market conditions: Rents flat; 279 active listings in the ZIP; 34 comparable units currently listed for rent nearby; rentals lingering (median 44d on market — plan ~5-8 weeks vacancy on turnover, expect pricing pressure); 56% of comp listings sitting > 30 days — soft ceiling on asking rent; 710 units permitted in Orleans Parish in 2024 (244 in 5+ unit buildings).
- At $6,267/mo this rent would consume 118% of the median local household income ($64k/yr) (locally 2237% of renters already pay >50% of income on rent) — very limited rent-growth headroom before tenants either downsize or default.
Forward outlook
- Local home prices are declining (-3.0%/yr); year-one equity from $4k of loan paydown is wiped out by about $19k of value loss. Plan a longer hold.
- Orleans County population projected at +61% by 2050 — long-run rental-demand tailwind backs the buy-and-hold thesis.
Negotiation context
- Only 10 days on market — expect competitive offers; lowballing is unlikely to land.
- 2 sale attempts with the ask held roughly flat each time — persistent listings suggest the price (not the market) is what's stuck; bring a comps-based counter.
Risks & watch-outs
- Watch-outs: flood insurance adds $66/mo; built in 1930 — expect roof / HVAC / electrical / plumbing capex.
- Climate carrying-cost: severe flood risk; severe wind risk, 99% chance of damaging wind over 30y; extreme-heat days projected 7→21/yr by 2055 (HVAC capex compounding) — expect insurance premiums to compound above CPI over the hold.
Questions for the listing agent
- Can we see the unit-by-unit rent roll, current vacancy, and any below-market leases? What's the average tenancy length?
- What capital expenditures (roof, boiler, parking lot, exteriors) have been made in the last 5 years, and what's planned in the next 2?
- Built in 1930 — when were the roof, HVAC, electrical panel, plumbing, and water heater last replaced?
- What's the actual annual flood-insurance premium (NFIP or private), and is the property in a SFHA with mandatory coverage?
- Is there a deadline driving the sale (1031 exchange, divorce, estate, relocation)? That informs how much negotiation room exists.
- The area grade is low — what's the realistic commute time and amenity access for the typical tenant pool here? Any planned neighborhood developments (good or bad) we should know about?
- What's the average days-on-market for RENTAL listings here right now (not sales)? A rising rental-DOM trend means longer vacancies and softer asking-rent achievability than the comps imply.
- What's the recent tenant-quality profile in this submarket — average credit score on applications, eviction rate, late-payment / NSF rate, and stable-employment percentage? A property-management company in the area should have these aggregated.
- How much new apartment / multifamily construction is in the pipeline within 1–3 miles? Heavy new supply (>2% of stock underway) typically softens rents 12–24 months out; light construction supports rent growth.
Investment metrics
- 1% rule
- 1.00% ✓
- Cap rate
- 7.98%
- Cash-on-cash
- 6.03%
- DSCR
- 1.27
- GRM
- 8.3
CMA / ARV
- ARV (on-the-fly)
- $550,800
- Comps found
- 11
Show comp detail 11 sales within ~0.75 mi
| Address | Dist | Beds/Ba | Sqft | Sold | Price | $/sf | Match |
|---|---|---|---|---|---|---|---|
| 7732 34 Sycamore St | 0.44mi | 5/4.0 (+1) | 3,237 (+6%) | 1mo | $555,000 | $171 | 64 |
| 1101/1103 Fern St | 0.52mi | 4/4.0 | 2,920 (-5%) | 9mo | $480,000 | $164 | 61 |
| 3015 Nashville Ave | 0.53mi | 5/3.0 (+1) | 3,308 (+8%) | 2mo | $595,000 | $180 | 51 |
| 2801 Palmer Ave | 0.39mi | 4/4.0 | 2,640 (-14%) | 15mo | $535,000 | $203 | 47 |
| 3000 Calhoun St | 0.32mi | 5/3.0 (+1) | 3,497 (+14%) | 12mo | $650,000 | $186 | 42 |
| 3803 05 State Street Dr | 0.66mi | 5/3.0 (+1) | 2,707 (-12%) | 2mo | $295,000 | $109 | 39 |
| 8015 17 Nelson St | 0.74mi | 4/3.0 | 2,816 (-8%) | 11mo | $376,000 | $134 | 38 |
| 2304 06 Audubon St | 0.46mi | 4/4.0 | 2,612 (-15%) | 19mo | $475,000 | $182 | 38 |
| 729 31 Fern St | 0.70mi | 4/2.0 | 2,652 (-13%) | 4mo | $600,000 | $226 | 34 |
| 8226 28 Panola St | 0.68mi | 4/2.0 | 2,640 (-14%) | 5mo | $490,000 | $186 | 33 |
| 7616-18 Hampson St | 0.69mi | 5/3.0 (+1) | 2,622 (-14%) | 12mo | $465,000 | $177 | 25 |
Match score weights: distance 35% · size 25% · config 20% · recency 20%. Top-matched comps best support the ARV.
Projected returns pro-forma
-3.0% appreciation · 0.97% rent growth · sell at horizon
- IRR
- -9.9%
- Equity multiple
- 0.65×
- Total profit
- $-62,081
- Equity at exit
- $93,190
- IRR
- -3.5%
- Equity multiple
- 0.79×
- Total profit
- $-36,907
- Equity at exit
- $54,039
Cash invested: $175,000 (down + closing). Projections, not guarantees.
Landlord ↔ Tenant lean methodology
- Overall (STATE)
- 90 Strongly Landlord-Friendly
- State Louisiana
- 90 Strongly Landlord-Friendly · R+12
- County
- — inherits STATE
- City
- — inherits STATE
ZIP-level market 70118
- Rents YoY
- 1.0%
- Active inventory
- 279
- Price-to-rent
- 16.6×
Monthly cashflow live
- Estimated rent
- $6,267 high interval (Pro) →
- Mortgage (P&I)
- −$3,278
- Tax from tax record
- −$534 /mo · $6,406/yr
- Insurance
- −$260
- Flood insurance flood zone
- −$66 /mo · $798/yr
- HOA
- −$0
- Vacancy / Maint / Mgmt
- −$1,316
- Net cashflow
- $813
Break-even live
Sensitivity live
| Price | -10% $1,166 | -5% $990 | +0% $813 | +5% $636 | +10% $459 |
|---|---|---|---|---|---|
| Rent | -10% $318 | -5% $565 | +0% $813 | +5% $1,060 | +10% $1,308 |
| Rate | -1.0pp $1,127 | -0.5pp $972 | base $813 | +0.5pp $651 | +1.0pp $486 |
2-unit breakdown (identical units grouped — click to expand)
| Units | Beds | Baths | Est. rent |
|---|---|---|---|
| 2× units | 4 | 2 | $6,268 |
| #1 | 4 | 2 | $3,134 |
| #2 | 4 | 2 | $3,134 |
| Total (2 units) | $6,267 | ||
UW: 25.0% down · 7.5% · 30yr · 1.5% tax · 5.0% vac · 8.0% maint · 8.0% mgmt
Financing live
Cash to close
- Down payment
- $156,250
- Closing costs
- $18,750
- Reserves months
- —
- Total cash needed
- —
Loan-product check · same deal, 3 products live
Conventional
25% down · 7.5% · 30yr
- Down + closing
- —
- Monthly P&I
- —
- Monthly cashflow
- —
- DSCR
- —
- Eligible?
- —
Personal DTI + credit; lowest rate.
DSCR
20% down · 8.5% · 30yr
- Down + closing
- —
- Monthly P&I
- —
- Monthly cashflow
- —
- DSCR
- —
- Eligible?
- —
No personal income docs; deal must DSCR.
Hard money
10% down · 12.0% · 12mo
- Down + closing
- —
- Monthly P&I
- —
- Monthly cashflow
- —
- DSCR
- —
- Eligible?
- —
Short-term bridge; refi at stabilization.
Rent comps 34 comps
| Address | Beds | Baths | Sqft | Rent | $/sqft | DOM | Units | Dist |
|---|---|---|---|---|---|---|---|---|
| 1519 Pine St New Orleans, LA | 5.0 | 3.0 | 3000 | $4,000 | $1.33 | 24d | 1 | 0.08mi |
| 7011 Jeannette St Unit A New Orleans, LA | 5.0 | 3.0 | 2200 | $5,000 | $2.27 | 44d | 1 | 0.13mi |
| 7000 Jeannette St New Orleans, LA | 3.0 | 3.0 | 2390 | $3,250 | $1.36 | 3d | 1 | 0.16mi |
| 2616 Calhoun St New Orleans, LA | 4.0 | 2.5 | 2850 | $2,500 | $0.88 | 44d | 1 | 0.35mi |
| 7325 Sycamore St New Orleans, LA | 4.0 | 3.0 | 2500 | $2,350 | $0.94 | 24d | 1 | 0.38mi |
| 2715 Palmer Ave New Orleans, LA | 5.0 | 2.0 | 2184 | $4,900 | $2.24 | 44d | 1 | 0.41mi |
| 2432 Calhoun St New Orleans, LA | 4.0 | 2.0 | 3300 | $4,400 | $1.33 | 17d | 1 | 0.41mi |
| 2703 Palmer Ave New Orleans, LA | 5.0 | 2.0 | 2349 | $5,500 | $2.34 | 44d | 1 | 0.42mi |
| 1131 Fern St New Orleans, LA | 4.0 | 2.0 | 2427 | $3,600 | $1.48 | 17d | 1 | 0.48mi |
| 5533 S Tonti St New Orleans, LA | 4.0 | 4.0 | 3000 | $3,000 | $1.00 | 15d | 1 | 0.59mi |
| 2107 Calhoun St New Orleans, LA | 3.0 | 2.0 | 3300 | $2,790 | $0.85 | 44d | 1 | 0.60mi |
| 5830 Clara St Unit 1 New Orleans, LA | 4.0 | 2.0 | 2100 | $4,500 | $2.14 | 44d | 1 | 0.61mi |
| 1539 Dante St New Orleans, LA | 3.0 | 2.0 | 2672 | $3,500 | $1.31 | 44d | 1 | 0.63mi |
| 2322 Nashville Ave New Orleans, LA | 4.0 | 2.0 | 2249 | $2,750 | $1.22 | 44d | 1 | 0.69mi |
| 7211 Saint Charles Ave New Orleans, LA | 5.0 | 3.0 | 2800 | $2,999 | $1.07 | 44d | 1 | 0.71mi |
| 544 Lowerline St New Orleans, LA | 3.0 | 2.0 | 2500 | $3,500 | $1.40 | 24d | 1 | 0.79mi |
| 4 Cromwell Pl New Orleans, LA | 5.0 | 2.0 | 2600 | $7,000 | $2.69 | 44d | 1 | 0.79mi |
| 5516 S Robertson St Unit A New Orleans, LA | 3.0 | 2.5 | 3614 | $2,800 | $0.77 | 44d | 1 | 0.81mi |
| 3112 Upperline St New Orleans, LA | 5.0 | 3.5 | 2800 | $3,650 | $1.30 | 24d | 1 | 0.82mi |
| 2306 Octavia St New Orleans, LA | 3.0 | 2.0 | 2254 | $2,650 | $1.18 | 3d | 1 | 0.84mi |
| 528 Walnut St New Orleans, LA | 3.0 | 3.0 | 2300 | $3,950 | $1.72 | 44d | 1 | 0.84mi |
| 3350 Jena St New Orleans, LA | 3.0 | 2.5 | 2200 | $2,500 | $1.14 | 44d | 1 | 0.90mi |
| 4442 S Johnson St Unit 4442 New Orleans, LA | 4.0 | 4.5 | 3000 | $4,500 | $1.50 | 12d | 1 | 0.92mi |
| 427 Lowerline St Unit A New Orleans, LA | 3.0 | 2.0 | 2364 | $3,900 | $1.65 | 24d | 1 | 0.95mi |
| 2217 Jefferson Ave Unit none New Orleans, LA | 3.0 | 2.0 | 2500 | $2,500 | $1.00 | 44d | 1 | 0.95mi |
| 1453 Webster St New Orleans, LA | 3.0 | 3.5 | 2181 | $7,500 | $3.44 | 44d | 1 | 1.15mi |
| 5512 Saint Charles Ave New Orleans, LA | 3.0 | 2.0 | 2161 | $3,800 | $1.76 | 44d | 1 | 1.21mi |
| 4027 S Derbigny St New Orleans, LA | 3.0 | 2.0 | 2950 | $1,950 | $0.66 | 24d | 1 | 1.25mi |
| 2308 Jena St New Orleans, LA | 3.0 | 2.5 | 2550 | $3,300 | $1.29 | 44d | 1 | 1.28mi |
| 4120 Erato St New Orleans, LA | 3.0 | 2.0 | 2250 | $1,750 | $0.78 | 24d | 1 | 1.32mi |
| 5533 Atlanta St New Orleans, LA | 3.0 | 3.0 | 2310 | $7,000 | $3.03 | 3d | 1 | 1.33mi |
| 249 Walnut St New Orleans, LA | 4.0 | 3.5 | 4266 | $22,000 | $5.16 | 44d | 1 | 1.40mi |
| 3200 Washington Ave Unit NA New Orleans, LA | 4.0 | 3.0 | 2490 | $3,400 | $1.37 | 3d | 1 | 1.44mi |
| 2600 Peniston St New Orleans, LA | 4.0 | 2.0 | 2342 | $3,500 | $1.49 | 44d | 1 | 1.44mi |
Listing history 8 events
-
2026-06-18days on market $625,000 Active 10 DOM
-
2026-06-17days on market $625,000 Active 9 DOM
-
2026-06-16days on market $625,000 Active 8 DOM
-
2026-06-15days on market $625,000 Active 7 DOM
-
2026-06-13days on market $625,000 Active 5 DOM
-
2026-06-10days on market $625,000 Active 2 DOM
-
2026-06-09remarks 699-char remark
-
2026-06-09$625,000 Active 1 DOM
ⓘ Source: listings_history table (triggers on properties + properties_extension) + one-shot
backfill from property_details.listing_events for pre-trigger history.
Tax reassessment forecast LA · Resets to sale price
- Current annual tax
- $6,406 · $534/mo
- Projected year-2 tax
- $6,406 · $534/mo
- Expected delta
- $0/yr ($0/mo · 0.0%)
ⓘ Screening estimate from a state-policy table — verify with the county assessor before closing.
Climate risk First Street
- Flood 8/10 Severe FEMA zone X (shaded) · 60% chance over 30 yrs
- Wildfire 1/10 Low
- Heat 10/10 Extreme 7 d/yr ≥108°F today · 21 d/yr by 30 yrs out
- Wind 10/10 Extreme 99% chance of damaging wind over 30 yrs
- Air quality 3/10 Moderate 3 unhealthy d/yr today · 4 by 30 yrs out
Nearby sold comps map
Loading sold comps map…
Walkable amenities ~0.75 mi
Loading nearby amenities…
Taxation est. · year 1
- Rental income
- $75,204
- − Mortgage interest
- −$35,010
- − Property taxes
- −$6,406
- − Insurance
- −$3,922
- − Repairs & maintenance
- −$6,016
- − Management
- −$6,016
- − Depreciation
- −$18,182
- Taxable loss
- −$348
- Est. tax savings @ 24.0%
- +$84
- After-tax cash flow
- $9,836/yr
For passive investors: Depreciation is non-cash, so a rental often shows a tax loss while cash-flowing — sheltering income. Rental losses are passive: they offset passive income freely, and up to $25,000/yr can offset ordinary (W-2) income if you actively participate and your MAGI is under $100k (phasing out to $0 by $150k); unused losses carry forward. On sale, claimed depreciation is recaptured at up to 25%, and gains may owe capital-gains tax (a 1031 exchange can defer both). Figures are a year-1 estimate at your 24.0% rate — not tax advice; consult a CPA.
Schools (NCES district)
- District
- Orleans Parish
- NCES district ID
- 2201170
- Math proficiency
- 11% ▼ -52.00%
- Reading proficiency
- 27% ▼ -46.00%
- Median HH income
- $37,011
- Composite
- 15.78/100
- National rank
- #9271
- State rank
- #69 of 98 in LA
Livability — New Orleans
- Score
- 81/100
- State rank
- #3
- US rank
- #1383
Category grades
Schools grade is shown separately in the Schools card above.
Census & demographics
- Census place
- New Orleans, LA
- County
- Orleans Parish · 338,817 people
- City population
- 338,817
- Metro
- New Orleans-Metairie, LA
- Population (ZIP)
- 36,072
- Household income
- $63,750
- Rent vs Own
- Severe rent burden
- 2237.0
Population outlook (Orleans County) Hauer SSP2
- Today (2025)
- 513,025 people
- By 2030
- 575,781 · +12.2%
- By 2040
- 700,174 · +36.5%
- By 2050
- 826,541 · +61.1%
- By 2075
- 1,123,374 · +119.0%
- By 2100
- 1,355,609 · +164.2%
Race, ethnicity, and origin ACS 2023
- Neighborhood character
- Diverse neighborhood (Simpson 0.65)
- Race & ethnicity
- White 47% Black 34% Hispanic / Latino 11% Two or more races 11% Asian 4%
- Hispanic origin (detail)
- Mexican 2%
- Common ancestry
- Lithuanian 8% Italian 2% Romanian 2%
- Foreign-born
- 9% · Canada, China
- Languages at home
- 86% English-only · Spanish 7% French/Haitian/Cajun 2% Other Indo-European 2%
Political lean MEDSL · Orleans
- 2024 margin
- Solid D (+67.0) · D 82.2% · R 15.2% · Other 2.7%
- 2008→2024 swing
- +6.7pp toward D · 2008: 60.3pp · 2024: 67.0pp
- All cycles
- 2024: D+67.0 2020: D+68.2 2016: D+66.2 2012: D+62.5 2008: D+60.3
Not yet ingested
- Civics
- —
Market trends
- HPI YoY
- ▼ -210.46%
- Current HPI
- 282.9629
- Rent YoY
- ▲ 0.97%
- Metro
- New Orleans-Metairie, LA
- State GDP YoY
- ▲ 3.29%
- F500 in state
- 10
Industry mix (Fortune 500 HQ in LA)
| Industry | F500 HQs | Revenue |
|---|---|---|
| Telecommunications | 2 | $23B |
|
||
| Utilities | 1 | $12B |
|
||
| Wholesale / Distribution | 1 | $5B |
|
||
| Advertising | 1 | $2B |
|
||
Price history
+512.7% since first listed4 events — show timeline
- 2026-06-08 Listed $625,000 AcadianaMLS
- 2026-06-08 Listed $625,000 GSREIN
- 2000-12-21 Sold (Public Records) $561,812 Public Records
- 1992-07-22 Sold (Public Records) $102,000 Public Records
Property tax history
+2.4%/yrLatest (2026): $6,406 · +1.1% YoY. Source: county tax records.
Cash-flow waterfall
monthlySold comps — $/sqft
last 12 mo · ≤1 miLoading sold comps…