27 Becky Ave · Boles Acres, NM
Flood risk 1/10 · Minimal
- FEMA flood zone
- A
- Chance of flooding over 30 yrs
- 0.0%
- Est. flood insurance / yr
- $1,009 – $1,996
Fire risk 4/10 · Minor
- Est. fire insurance / yr
- $706 – $1,312
Heat risk 5/10 · Moderate
- Hot days now (above 100°F)
- 7 days/yr
- Hot days in 30 yrs
- 25 days/yr
Wind risk 1/10 · Minimal
- Chance of severe wind over 30 yrs
- —
Air-quality risk 1/10 · Minimal
- Unhealthy air days now
- 0 days/yr
- Unhealthy air days in 30 yrs
- 0 days/yr
Risk factors via First Street. Map © Google.
Why this score? — see what drove the B- grade
The composite is a weighted blend of 9 inputs, each scored 0–100. Each bar is that input's sub-score; the figure is the points it added to the 100-point composite (weight × sub-score).
- Cash flow +30.0/30.0
- 1% rule +10.0/10.0
- DSCR +10.0/10.0
- ARV discount +7.5/15.0
- Livability +3.2/5.0
- Schools +3.0/10.0
- Rent growth +2.9/5.0
- Condition / age +2.5/5.0
- Appreciation +0.0/10.0
$75,000
🖨 Deal sheet 📄 Offer letter ✓ Due diligence
Listing remarks MLS
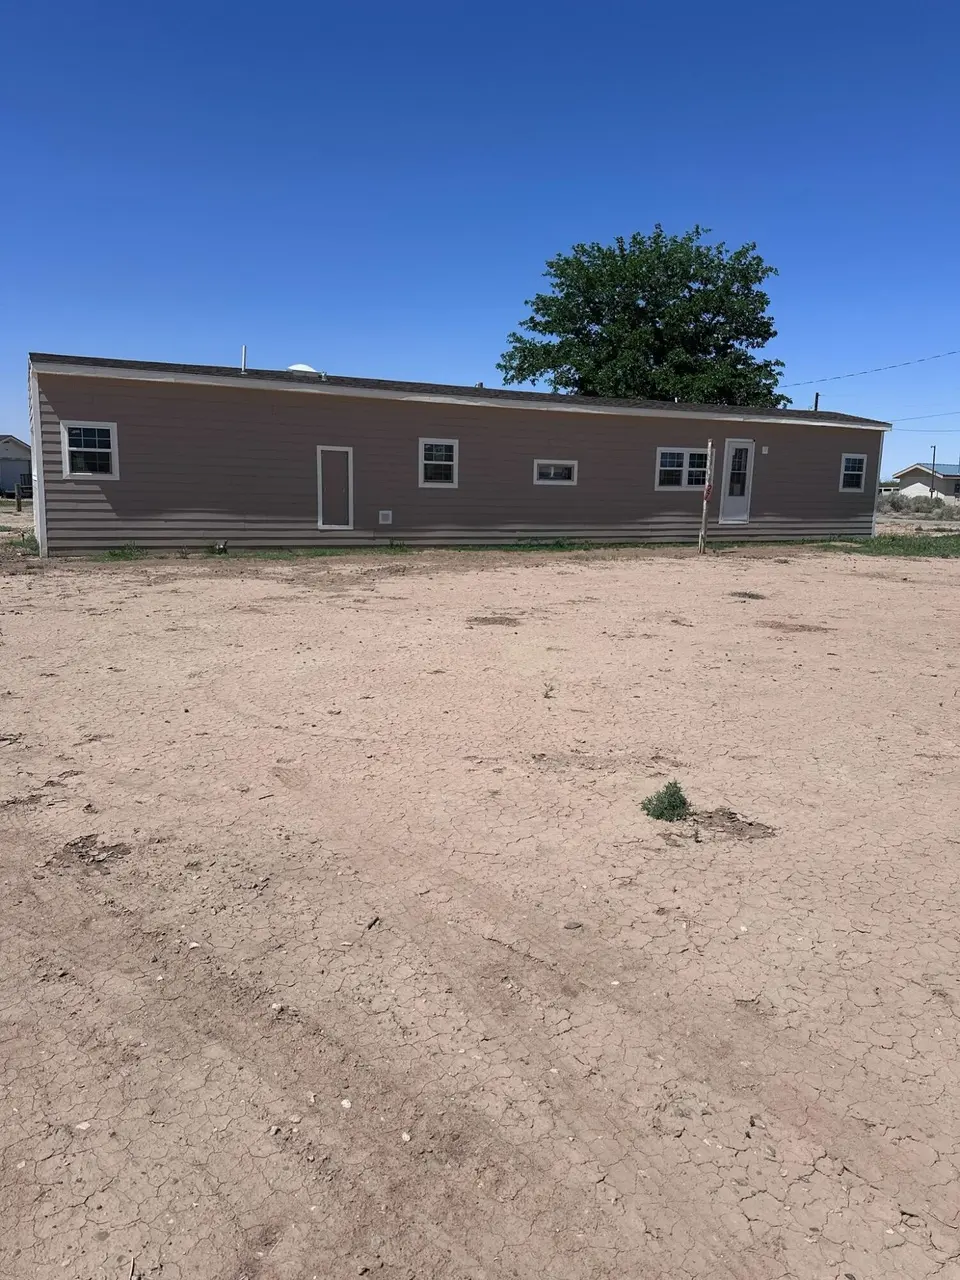
Fix up this 4 BD, 2.5 BA house located on 2.48 acres w/ a work shop & horse corrals. The compact, U-shaped KIT has abundant counter space w/ a breakfast bar, which is perfect for helping the kids with homework while cooking dinner. The wood stove in the living room is great for gathering around on chilly nights while the wet bar is waiting to host get-to-gathers. An enclosed patio is great for holding muddy boots & outdoor gear. Relax your day away in the hot-tub.
Key facts
- 2.48 acre lot
- 2 garage spots
- Built 2002
Property features AI
Finance
- Other: Zoning: R-1; Lot size approximately 2.48 acres
Exterior
- Parking: Attached garage with 2 parking spaces
- Utilities: Cable connected; Electricity connected; Natural gas connected; Sewer connected (private sewer); Water connected (private well)
- Home design: Single-story; Northeast-facing; Resale property
- Construction: Pitched roof; Mobile home dimensions approximately 72 ft by 14 ft
- Exterior features: No special exterior features listed; Gravel road access
Interior
- Bedrooms: Primary bedroom on the main level
- Flooring: Carpet
- Bathrooms: 2 full bathrooms
- Heating & cooling: Ductless heating; Ductless cooling; Window cooling unit(s)
- Interior features: Main level primary bedroom; Vinyl window frames
- Laundry & utility: Washer hookup; Electric dryer hookup; Gas dryer hookup
Neighborhood map
What this means for you Summary
Snapshot
- This is a 3-bed/2.0-bath single-family listed at $75k.
Deal economics
- At list price, monthly cash flow is $753 ($9k/yr) — positive.
- The deal already cash-flows at list — no discount required.
- Meets the 1% rule at list price ($2k rent vs $75k).
- Recommended offer: $73k (3.0% below list) — sets the bar for market timing.
Location & tenants
- Location reads 65/100 on livability (#47 in NM) — a middle-class / working-renter tenant base. Strengths: cost of living A+, housing A+, crime A; Watch: health & safety C-, schools F, amenities F.
- Alamogordo Public Schools (town): math 26% / reading 39% proficiency, ranked #26 of 95 in NM (top 27%) — families likely to look elsewhere, expect single-tenant / working-renter base with shorter leases.
- Market conditions: Rents rising (+1.6%/yr); 444 active listings in the ZIP; 6 units permitted in Otero County in 2024 (0 in 5+ unit buildings).
- This rent runs 35% of the median local income ($57k/yr) — at the standard rent-burdened threshold; future hikes will face affordability resistance.
Forward outlook
- Local home prices are declining (-3.0%/yr); year-one equity from $519 of loan paydown is wiped out by about $2k of value loss. Plan a longer hold.
- Otero County population projected to shrink 7% by 2050 — rents likely to lag national; underwrite the cash flow, not the appreciation.
- At projected returns (-3.0% appreciation + 1.6% rent growth), your $21k cash investment doubles in ~3 years — after that, you're playing with house money.
Negotiation context
- It's been on market 44 days — a 3% lower offer ($73k) is reasonable based on typical stale-listing flexibility.
- 2 sale attempts since 9y ago; this cycle's ask has dropped $44k (37%) from the opening price — seller is motivated, your offer sets the floor, not the list.
Risks & watch-outs
- Watch-outs: flood insurance adds $125/mo.
- Climate carrying-cost: in FEMA flood zone A (mandatory federal flood insurance); extreme-heat days projected 7→25/yr by 2055 (HVAC capex compounding) — expect insurance premiums to compound above CPI over the hold.
Questions for the listing agent
- It's been on market 44 days. Have you received any prior offers? Is the seller open to a 3% concession, seller financing, or rate buy-down credit?
- What's the actual annual flood-insurance premium (NFIP or private), and is the property in a SFHA with mandatory coverage?
- Is there a deadline driving the sale (1031 exchange, divorce, estate, relocation)? That informs how much negotiation room exists.
- Schools are F-rated, which usually means shorter tenancies and higher turnover. Who's the typical renter profile here, and what's been the actual vacancy rate?
- What's the average days-on-market for RENTAL listings here right now (not sales)? A rising rental-DOM trend means longer vacancies and softer asking-rent achievability than the comps imply.
- What's the recent tenant-quality profile in this submarket — average credit score on applications, eviction rate, late-payment / NSF rate, and stable-employment percentage? A property-management company in the area should have these aggregated.
- How much new for-sale + rental construction is in the pipeline within 1–3 miles? Heavy new supply typically softens prices + rents 12–24 months out; constrained supply supports both.
Investment metrics
- 1% rule
- 2.23% ✓
- Cap rate
- 20.34%
- Cash-on-cash
- 50.16%
- DSCR
- 3.23
- GRM
- 3.7
CMA / ARV
No comps found within radius.
Projected returns pro-forma
-3.0% appreciation · 1.65% rent growth · sell at horizon
- IRR
- 38.2%
- Equity multiple
- 2.60×
- Total profit
- $33,595
- Equity at exit
- $11,183
- IRR
- 44.1%
- Equity multiple
- 4.92×
- Total profit
- $82,245
- Equity at exit
- $6,485
Cash invested: $21,000 (down + closing). Projections, not guarantees.
Landlord ↔ Tenant lean methodology
- Overall (STATE)
- 55 Moderately Landlord-Leaning
- State New Mexico
- 55 Moderately Landlord-Leaning · D+3
- County
- — inherits STATE
- City
- — inherits STATE
ZIP-level market 88310
- Rents YoY
- 1.6%
- Active inventory
- 444
- Price-to-rent
- 3.7×
Monthly cashflow live
- Estimated rent
- $1,676 medium interval (Pro) →
- Mortgage (P&I)
- −$393
- Tax from tax record
- −$21 /mo · $258/yr
- Insurance
- −$31
- Flood insurance flood zone
- −$125 /mo · $1,502/yr
- HOA
- −$0
- Vacancy / Maint / Mgmt
- −$352
- Net cashflow
- $753
Break-even live
UW: 25.0% down · 7.5% · 30yr · 1.5% tax · 5.0% vac · 8.0% maint · 8.0% mgmt
Financing live
Cash to close
- Down payment
- $18,750
- Closing costs
- $2,250
- Reserves months
- —
- Total cash needed
- —
Loan-product check · same deal, 3 products live
Conventional
25% down · 7.5% · 30yr
- Down + closing
- —
- Monthly P&I
- —
- Monthly cashflow
- —
- DSCR
- —
- Eligible?
- —
Personal DTI + credit; lowest rate.
DSCR
20% down · 8.5% · 30yr
- Down + closing
- —
- Monthly P&I
- —
- Monthly cashflow
- —
- DSCR
- —
- Eligible?
- —
No personal income docs; deal must DSCR.
Hard money
10% down · 12.0% · 12mo
- Down + closing
- —
- Monthly P&I
- —
- Monthly cashflow
- —
- DSCR
- —
- Eligible?
- —
Short-term bridge; refi at stabilization.
Listing history 20 events
-
2026-06-18days on market $75,000 Active 44 DOM
-
2026-06-17days on market $75,000 Active 43 DOM
-
2026-06-16days on market $75,000 Active 42 DOM
-
2026-06-15days on market $75,000 Active 41 DOM
-
2026-06-13days on market $75,000 Active 39 DOM
-
2026-06-13days on market $75,000 Active 38 DOM
-
2026-06-10days on market $75,000 Active 36 DOM
-
2026-06-09days on market $75,000 Active 35 DOM
-
2026-06-08days on market $75,000 Active 34 DOM
-
2026-06-07pricedays on market $75,000 Active 33 DOM
-
2026-06-05days on market $80,000 Active 30 DOM
-
2026-06-03days on market $80,000 Active 29 DOM
-
2026-06-03days on market $80,000 Active 28 DOM
-
2026-06-01days on market $80,000 Active 27 DOM
-
2026-05-31days on market $80,000 Active 26 DOM
-
2026-05-17price $95,000 132-char remark
-
2026-05-07price $99,000 132-char remark
-
2026-05-02$119,000 Active 132-char remark
-
2017-03-31soldstatus 480-char remark
Show marketing remark (480 chars)
Fix up this 4 BD, 2.5 BA house located on 2.48 acres w/ a work shop & horse corrals. The compact, U-shaped KIT has abundant counter space w/ a breakfast bar, which is perfect for helping the kids with homework while cooking dinner. The wood stove in the living room is great for gathering around on chilly nights while the wet bar is waiting to host get-to-gathers. An enclosed patio is great for holding muddy boots & outdoor gear. Relax your day away in the hot-tub.
-
2017-01-25$19,900 480-char remark
Show marketing remark (480 chars)
Fix up this 4 BD, 2.5 BA house located on 2.48 acres w/ a work shop & horse corrals. The compact, U-shaped KIT has abundant counter space w/ a breakfast bar, which is perfect for helping the kids with homework while cooking dinner. The wood stove in the living room is great for gathering around on chilly nights while the wet bar is waiting to host get-to-gathers. An enclosed patio is great for holding muddy boots & outdoor gear. Relax your day away in the hot-tub.
ⓘ Source: listings_history table (triggers on properties + properties_extension) + one-shot
backfill from property_details.listing_events for pre-trigger history.
Tax reassessment forecast NM · Resets to sale price
- Current annual tax
- $258 · $21/mo
- Projected year-2 tax
- $600 · $50/mo
- Expected delta
- +$342/yr (+$29/mo · 132.6%)
ⓘ Screening estimate from a state-policy table — verify with the county assessor before closing.
Climate risk First Street
- Flood 1/10 Low FEMA zone A · 0% chance over 30 yrs
- Wildfire 4/10 Moderate
- Heat 5/10 Major 7 d/yr ≥100°F today · 25 d/yr by 30 yrs out
- Wind 1/10 Low
- Air quality 1/10 Low 0 unhealthy d/yr today · 0 by 30 yrs out
Nearby sold comps map
Loading sold comps map…
Walkable amenities ~0.75 mi
Loading nearby amenities…
Taxation est. · year 1
- Rental income
- $20,110
- − Mortgage interest
- −$4,201
- − Property taxes
- −$258
- − Insurance
- −$1,877
- − Repairs & maintenance
- −$1,609
- − Management
- −$1,609
- − Depreciation
- −$2,182
- Taxable income
- $8,374
- Est. tax owed @ 24.0%
- −$2,010
- After-tax cash flow
- $7,022/yr
For passive investors: Depreciation is non-cash, so a rental often shows a tax loss while cash-flowing — sheltering income. Rental losses are passive: they offset passive income freely, and up to $25,000/yr can offset ordinary (W-2) income if you actively participate and your MAGI is under $100k (phasing out to $0 by $150k); unused losses carry forward. On sale, claimed depreciation is recaptured at up to 25%, and gains may owe capital-gains tax (a 1031 exchange can defer both). Figures are a year-1 estimate at your 24.0% rate — not tax advice; consult a CPA.
Schools (NCES district)
- District
- Alamogordo Public Schools
- NCES district ID
- 3500030
- Math proficiency
- 26% —
- Reading proficiency
- 39% —
- Median HH income
- $42,194
- Composite
- 30.24/100
- National rank
- #11572
- State rank
- #26 of 95 in NM
Livability — Boles Acres
- Score
- 65/100
- State rank
- #47
- US rank
- #12466
Category grades
Schools grade is shown separately in the Schools card above.
Census & demographics
- Census place
- Boles Acres, NM
- County
- Otero County · 36,983 people
- City population
- 696
- Metro
- Alamogordo, NM
- Population (ZIP)
- 36,983
- Household income
- $57,214
- Rent vs Own
- Severe rent burden
- 1231.0
Population outlook (Otero County) Hauer SSP2
- Today (2025)
- 62,967 people
- By 2030
- 62,164 · -1.3%
- By 2040
- 60,253 · -4.3%
- By 2050
- 58,575 · -7.0%
- By 2075
- 55,411 · -12.0%
- By 2100
- 48,551 · -22.9%
Race, ethnicity, and origin ACS 2023
- Neighborhood character
- Diverse neighborhood (Simpson 0.59)
- Race & ethnicity
- White 56% Hispanic / Latino 31% Two or more races 18% Black 5% Asian 2% Native American 2%
- Hispanic origin (detail)
- Mexican 25%
- Common ancestry
- Slovak 3% Lithuanian 2% Italian 1%
- Foreign-born
- 6% · Canada
- Languages at home
- 85% English-only · Spanish 12% Tagalog/Filipino 1%
Political lean MEDSL · Otero
- 2024 margin
- Strong R (+27.0) · D 35.4% · R 62.4% · Other 2.2%
- 2008→2024 swing
- -7.7pp toward R · 2008: -19.3pp · 2024: -27.0pp
- All cycles
- 2024: R+27.0 2020: R+25.6 2016: R+29.1 2012: R+28.0 2008: R+19.3
Not yet ingested
- Civics
- —
Market trends
- HPI YoY
- ▼ -174.88%
- Current HPI
- 181.737
- Rent YoY
- ▲ 1.65%
- Metro
- Alamogordo, NM
- State GDP YoY
- —
- F500 in state
- 0
Price history
+276.9% since first listed8 events — show timeline
- 2026-06-06 Price Changed $75,000 Southwest MLS
- 2026-05-29 Price Changed $80,000 Southwest MLS
- 2026-05-21 Price Changed $85,000 Southwest MLS
- 2026-05-17 Price Changed $95,000 Southwest MLS
- 2026-05-07 Price Changed $99,000 Southwest MLS
- 2026-05-02 Listed $119,000 Southwest MLS
- 2017-03-31 Sold (MLS) — OCAOR
- 2017-01-25 Listed $19,900 OCAOR
Property tax history
-5.0%/yrLatest (2025): $258 · -27.2% YoY. Source: county tax records.
Cash-flow waterfall
monthlySold comps — $/sqft
last 12 mo · ≤1 miLoading sold comps…