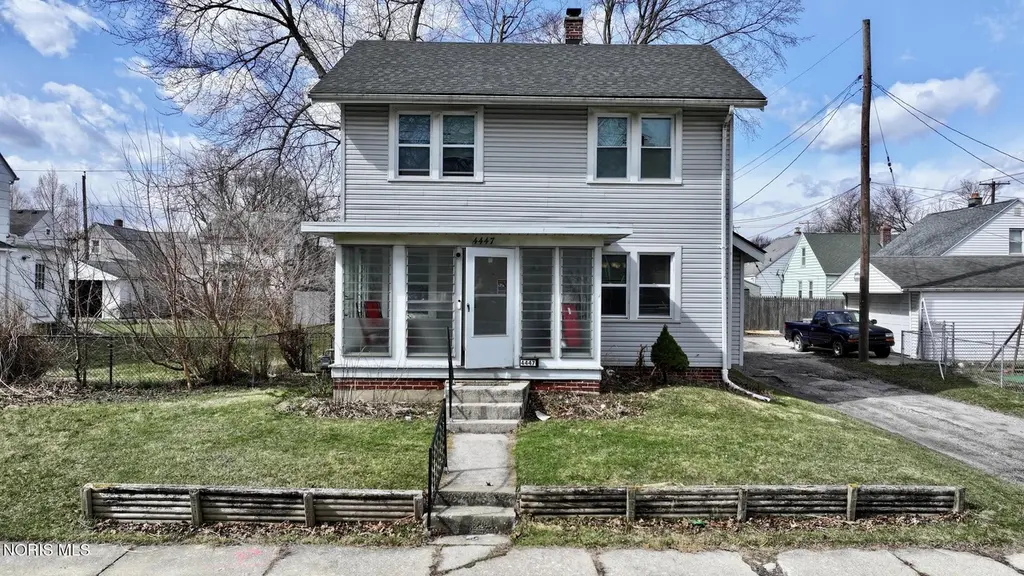
4447 Walker Ave · Toledo, OH
Flood risk 1/10 · Minimal
- FEMA flood zone
- X (unshaded)
- Chance of flooding over 30 yrs
- 0.0%
- Est. flood insurance / yr
- $473 – $860
Fire risk 1/10 · Minimal
- Est. fire insurance / yr
- $713 – $1,323
Heat risk 3/10 · Minor
- Hot days now (above 101°F)
- 7 days/yr
- Hot days in 30 yrs
- 16 days/yr
Wind risk 2/10 · Minimal
- Chance of severe wind over 30 yrs
- —
Air-quality risk 2/10 · Minimal
- Unhealthy air days now
- 1 days/yr
- Unhealthy air days in 30 yrs
- 3 days/yr
Risk factors via First Street. Map © Google.
Why this score? — see what drove the C+ grade
The composite is a weighted blend of 9 inputs, each scored 0–100. Each bar is that input's sub-score; the figure is the points it added to the 100-point composite (weight × sub-score).
- Cash flow +23.5/30.0
- ARV discount +14.8/15.0
- DSCR +7.6/10.0
- 1% rule +6.3/10.0
- Rent growth +4.0/5.0
- Livability +3.3/5.0
- Condition / age +2.5/5.0
- Schools +1.6/10.0
- Appreciation +0.0/10.0
$110,000
🖨 Deal sheet 📄 Offer letter ✓ Due diligence
Listing remarks MLS
Tenant-occupied investment opportunity generating $1,200/month in rental income with lease in place through January 2027. Located in the desirable West Toledo area. Ideal for investors looking for immediate cash flow with long-term upside in a great location. Property management is currently in place, allowing for a smooth and seamless transition for the next owner.
Key facts
- Rental income
- West toledo area
- 4,300 sq ft lot
Tags
Neighborhood map
What this means for you Summary
Snapshot
- This is a 3-bed/1.0-bath single-family listed at $110k.
Deal economics
- At list price, monthly cash flow is $206 ($2k/yr) — positive.
- The deal already cash-flows at list — no discount required.
- Meets the 1% rule at list price ($1k rent vs $110k).
- Recommended offer: $103k (6.0% below list) — sets the bar for market timing.
Location & tenants
- Location reads 66/100 on livability (#645 in OH) — a middle-class / working-renter tenant base. Strengths: cost of living A+, housing A+, health & safety A+; Watch: amenities C-, schools D-, crime F.
- Toledo City (urban): math 15% / reading 24% proficiency, ranked #634 of 656 in OH (top 97%) — low school quality limits family demand, transient renter base, plan for 1-2y turnover; 72% free/reduced lunch — lower-income household profile, screen leases tightly.
- Market conditions: Rents rising fast (+6.0%/yr); 92 active listings in the ZIP; 35 comparable units currently listed for rent nearby; rentals at typical pace (median 24d on market — plan ~3-4 weeks tenant-placement turnaround); 415 units permitted in Lucas County in 2024 (122 in 5+ unit buildings).
Forward outlook
- Local home prices are declining (-3.0%/yr); year-one equity from $761 of loan paydown is wiped out by about $3k of value loss. Plan a longer hold.
- Lucas County population projected at -16% by 2050 — secular population decline; favor cash flow + early exit over multi-decade hold.
- At projected returns (-3.0% appreciation + 6.0% rent growth), your $31k cash investment doubles in ~9 years — after that, you're playing with house money.
Negotiation context
- It's been on market 89 days — a 6% lower offer ($103k) is reasonable based on typical stale-listing flexibility.
- 3 sale attempts since 3y ago; this cycle's ask has dropped $9k (8%) from the opening price — seller is motivated, your offer sets the floor, not the list.
- Current owner paid $92k; 20% above their basis — modest negotiation headroom, anchor on the comps not their cost.
Risks & watch-outs
- Watch-outs: built in 1929 — expect roof / HVAC / electrical / plumbing capex.
Questions for the listing agent
- It's been on market 89 days. Have you received any prior offers? Is the seller open to a 6% concession, seller financing, or rate buy-down credit?
- Built in 1929 — when were the roof, HVAC, electrical panel, plumbing, and water heater last replaced?
- Why hasn't it sold? Are there any deal-killer items the seller is aware of (foundation, flood, title, zoning, code violations)?
- Is there a deadline driving the sale (1031 exchange, divorce, estate, relocation)? That informs how much negotiation room exists.
- Schools are D-rated, which usually means shorter tenancies and higher turnover. Who's the typical renter profile here, and what's been the actual vacancy rate?
- Crime grade is F in this area — have there been break-ins, vandalism, or insurance claims at this property in the last 3 years? What carrier currently insures it and at what premium?
- What's the average days-on-market for RENTAL listings here right now (not sales)? A rising rental-DOM trend means longer vacancies and softer asking-rent achievability than the comps imply.
- What's the recent tenant-quality profile in this submarket — average credit score on applications, eviction rate, late-payment / NSF rate, and stable-employment percentage? A property-management company in the area should have these aggregated.
- How much new for-sale + rental construction is in the pipeline within 1–3 miles? Heavy new supply typically softens prices + rents 12–24 months out; constrained supply supports both.
Investment metrics
- 1% rule
- 1.13% ✓
- Cap rate
- 8.54%
- Cash-on-cash
- 8.01%
- DSCR
- 1.36
- GRM
- 7.4
CMA / ARV
- ARV (median comp)
- $131,468
- List price
- $110,000
- Delta
- -16.33%
- Verdict
- UNDERPRICED
- Comps
- 20 within 1.0 mi
Show comp detail 12 sales within ~0.75 mi
| Address | Dist | Beds/Ba | Sqft | Sold | Price | $/sf | Match |
|---|---|---|---|---|---|---|---|
| 650 Dryden Dr | 0.26mi | 3/1.0 | 1,248 (-9%) | 1mo | $75,000 | $60 | 72 |
| 4321 Burnham Ave | 0.26mi | 3/1.5 | 1,256 (-8%) | 0mo | $85,000 | $68 | 72 |
| 4314 N Haven Ave | 0.29mi | 3/1.0 | 1,564 (+14%) | 0mo | $140,500 | $90 | 62 |
| 4228 N Lockwood Ave | 0.39mi | 3/2.0 | 1,493 (+9%) | 0mo | $85,000 | $57 | 62 |
| 4227 Caroline Ave | 0.37mi | 3/1.5 | 1,210 (-12%) | 0mo | $134,500 | $111 | 61 |
| 3938 Berkeley Dr | 0.55mi | 3/1.0 | 1,472 (+8%) | 1mo | $120,000 | $82 | 61 |
| 439 W Capistrano Ave | 0.60mi | 3/1.0 | 1,244 (-9%) | 1mo | $116,000 | $93 | 56 |
| 1425 Hagley Rd | 0.67mi | 4/1.5 (+1) | 1,436 (+5%) | 1mo | $147,000 | $102 | 53 |
| 1344 Corbin Rd | 0.59mi | 3/1.0 | 1,200 (-12%) | 1mo | $157,500 | $131 | 51 |
| 5069 Tappan Ave | 0.71mi | 3/1.0 | 1,249 (-9%) | 1mo | $155,000 | $124 | 51 |
| 4612 Willys Pkwy | 0.50mi | 3/1.0 | 1,163 (-15%) | 1mo | $85,000 | $73 | 50 |
| 1204 Higley St | 0.42mi | 2/2.0 (-1) | 1,184 (-14%) | 1mo | $119,000 | $101 | 48 |
Match score weights: distance 35% · size 25% · config 20% · recency 20%. Top-matched comps best support the ARV.
Projected returns pro-forma
-3.0% appreciation · 6.01% rent growth · sell at horizon
- IRR
- -0.7%
- Equity multiple
- 0.97×
- Total profit
- $-830
- Equity at exit
- $16,401
- IRR
- 12.0%
- Equity multiple
- 2.08×
- Total profit
- $33,150
- Equity at exit
- $9,511
Cash invested: $30,800 (down + closing). Projections, not guarantees.
Landlord ↔ Tenant lean methodology
- Overall (STATE)
- 73 Landlord-Friendly
- State Ohio
- 73 Landlord-Friendly · R+6
- County
- — inherits STATE
- City
- — inherits STATE
ZIP-level market 43612
- Home prices YoY
- -17.5%
- Rents YoY
- 6.0%
- Active inventory
- 92
- Price-to-rent
- 7.4×
Monthly cashflow live
- Estimated rent
- $1,241 high interval (Pro) →
- Mortgage (P&I)
- −$577
- Tax from tax record
- −$152 /mo · $1,822/yr
- Insurance
- −$46
- HOA
- −$0
- Vacancy / Maint / Mgmt
- −$261
- Net cashflow
- $206
Break-even live
UW: 25.0% down · 7.5% · 30yr · 1.5% tax · 5.0% vac · 8.0% maint · 8.0% mgmt
Financing live
Cash to close
- Down payment
- $27,500
- Closing costs
- $3,300
- Reserves months
- —
- Total cash needed
- —
Loan-product check · same deal, 3 products live
Conventional
25% down · 7.5% · 30yr
- Down + closing
- —
- Monthly P&I
- —
- Monthly cashflow
- —
- DSCR
- —
- Eligible?
- —
Personal DTI + credit; lowest rate.
DSCR
20% down · 8.5% · 30yr
- Down + closing
- —
- Monthly P&I
- —
- Monthly cashflow
- —
- DSCR
- —
- Eligible?
- —
No personal income docs; deal must DSCR.
Hard money
10% down · 12.0% · 12mo
- Down + closing
- —
- Monthly P&I
- —
- Monthly cashflow
- —
- DSCR
- —
- Eligible?
- —
Short-term bridge; refi at stabilization.
Rent comps 35 comps
| Address | Beds | Baths | Sqft | Rent | $/sqft | DOM | Units | Dist |
|---|---|---|---|---|---|---|---|---|
| 4406 Asbury Dr Toledo, OH | 4.0 | 2.0 | 1089 | $1,550 | $1.42 | 14d | 1 | 0.14mi |
| 4459 N Haven Ave Toledo, OH | 3.0 | 1.0 | 1416 | $1,200 | $0.85 | 14d | 1 | 0.27mi |
| 4158 Mayfield Dr Toledo, OH | 2.0 | 1.0 | 960 | $850 | $0.89 | 14d | 1 | 0.32mi |
| 4129 Vermaas Ave Toledo, OH | 3.0 | 1.5 | 1385 | $1,250 | $0.90 | 43d | 1 | 0.34mi |
| 4124 Vermaas Ave Toledo, OH | 2.0 | 1.0 | 1245 | $997 | $0.80 | 43d | 1 | 0.36mi |
| 1016 Mallett St Unit 1 Toledo, OH | 2.0 | 1.0 | 1300 | $900 | $0.69 | 43d | 1 | 0.38mi |
| 4220 Caroline Ave Toledo, OH | 3.0 | 1.0 | 944 | $1,095 | $1.16 | 43d | 1 | 0.39mi |
| 4039 Vermaas Ave Toledo, OH | 2.0 | 1.0 | 900 | $900 | $1.00 | 23d | 1 | 0.40mi |
| 4140 Caroline Ave Toledo, OH | 3.0 | 1.5 | 1378 | $1,650 | $1.20 | 23d | 1 | 0.42mi |
| 4138 N Lockwood Ave Toledo, OH | 2.0 | 1.0 | 1300 | $1,050 | $0.81 | 23d | 1 | 0.42mi |
| 3950 Woodhaven Dr Toledo, OH | 2.0 | 1.0 | 1072 | $745 | $0.69 | 23d | 1 | 0.56mi |
| 3905 Peru St Toledo, OH | 4.0 | 3.0 | 1548 | $1,300 | $0.84 | 21d | 1 | 0.56mi |
| 1338 Crestwood Rd Toledo, OH | 3.0 | 1.0 | 1000 | $1,250 | $1.25 | 14d | 1 | 0.62mi |
| 4223 Birchall Rd Toledo, OH | 3.0 | 1.0 | 1338 | $1,395 | $1.04 | 23d | 1 | 0.68mi |
| 1014 Berdan Ave Toledo, OH | 3.0 | 1.0 | 1215 | $1,200 | $0.99 | 43d | 1 | 0.69mi |
| 3915 Willys Pkwy Unit 3915 Toledo, OH | 3.0 | 1.0 | 1080 | $800 | $0.74 | 21d | 1 | 0.69mi |
| 4120 Parrakeet Ave Toledo, OH | 3.0 | 2.0 | 1410 | $1,450 | $1.03 | 43d | 1 | 0.79mi |
| 3615 Berkeley Dr Toledo, OH | 3.0 | 1.0 | 1096 | $1,400 | $1.28 | 14d | 1 | 0.81mi |
| 3805 Hoiles Ave Toledo, OH | 3.0 | 1.0 | 1370 | $1,025 | $0.75 | 23d | 1 | 0.87mi |
| 1477 W Sylvania Ave Toledo, OH | 3.0 | 1.0 | 1570 | $1,250 | $0.80 | 43d | 1 | 0.89mi |
| 3725 Hoiles Ave Toledo, OH | 3.0 | 1.0 | 1180 | $1,245 | $1.06 | 23d | 1 | 0.89mi |
| 4038 Lyman Ave Toledo, OH | 3.0 | 1.0 | 1175 | $1,395 | $1.19 | 43d | 1 | 0.89mi |
| 4614 Commonwealth Ave Toledo, OH | 3.0 | 1.5 | 1459 | $1,295 | $0.89 | 14d | 1 | 0.90mi |
| 5207 Bennett Rd Toledo, OH | 2.0 | 2.0 | 1109 | $1,200 | $1.08 | 14d | 1 | 0.92mi |
| 3713 Hazelhurst Ave Toledo, OH | 3.0 | 1.5 | 1352 | $1,700 | $1.26 | 43d | 1 | 0.95mi |
| 3541 Willys Pkwy Toledo, OH | 3.0 | 1.0 | 1113 | $1,400 | $1.26 | 43d | 1 | 0.97mi |
| 927 W Northgate Pkwy Toledo, OH | 2.0 | 1.0 | 896 | $1,100 | $1.23 | 14d | 1 | 1.04mi |
| 1489 Berdan Ave Toledo, OH | 3.0 | 1.0 | 1068 | $1,250 | $1.17 | 43d | 1 | 1.07mi |
| 3606 Revere Dr Toledo, OH | 4.0 | 1.0 | 1320 | $1,500 | $1.14 | 43d | 1 | 1.08mi |
| 4315 Garden Park Dr Toledo, OH | 3.0 | 1.0 | 1268 | $1,423 | $1.12 | 23d | 1 | 1.16mi |
| 614 Cadillac Ct Toledo, OH | 3.0 | 1.0 | 1581 | $1,075 | $0.68 | 23d | 1 | 1.26mi |
| 610 Cadillac Ct Toledo, OH | 3.0 | 1.0 | 1409 | $1,050 | $0.75 | 23d | 1 | 1.26mi |
| 31 W Oakland St Toledo, OH | 4.0 | 1.0 | 1188 | $1,249 | $1.05 | 23d | 1 | 1.46mi |
| 1801 Christian Ave Toledo, OH | 1.0–2.0 | 1.0 | 750 | $939 | $1.25 | 14d | 1 | 1.47mi |
| 1731 Mansfield Rd Toledo, OH | 3.0 | 1.0 | 1138 | $1,195 | $1.05 | 23d | 1 | 1.48mi |
Listing history 28 events
-
2026-06-18days on market $110,000 Active 89 DOM
-
2026-06-17days on market $110,000 Active 88 DOM
-
2026-06-16days on market $110,000 Active 87 DOM
-
2026-06-15days on market $110,000 Active 86 DOM
-
2026-06-14days on market $110,000 Active 84 DOM
-
2026-06-10days on market $110,000 Active 81 DOM
-
2026-06-09days on market $110,000 Active 80 DOM
-
2026-06-08days on market $110,000 Active 79 DOM
-
2026-06-07days on market $110,000 Active 78 DOM
-
2026-06-05days on market $110,000 Active 75 DOM
-
2026-06-03days on market $110,000 Active 74 DOM
-
2026-06-02days on market $110,000 Active 73 DOM
-
2026-06-01days on market $110,000 Active 72 DOM
-
2026-05-31days on market $110,000 Active 71 DOM
-
2026-05-30days on market $110,000 Active 70 DOM
-
2026-04-10price $115,000 368-char remark
Show marketing remark (368 chars)
Tenant-occupied investment opportunity generating $1,200/month in rental income with lease in place through January 2027. Located in the desirable West Toledo area. Ideal for investors looking for immediate cash flow with long-term upside in a great location. Property management is currently in place, allowing for a smooth and seamless transition for the next owner.
-
2026-03-26price $117,000 368-char remark
Show marketing remark (368 chars)
Tenant-occupied investment opportunity generating $1,200/month in rental income with lease in place through January 2027. Located in the desirable West Toledo area. Ideal for investors looking for immediate cash flow with long-term upside in a great location. Property management is currently in place, allowing for a smooth and seamless transition for the next owner.
-
2026-02-23$119,000 Active 368-char remark
Show marketing remark (368 chars)
Tenant-occupied investment opportunity generating $1,200/month in rental income with lease in place through January 2027. Located in the desirable West Toledo area. Ideal for investors looking for immediate cash flow with long-term upside in a great location. Property management is currently in place, allowing for a smooth and seamless transition for the next owner.
-
2025-10-14price $92,000 26-char remark
Show marketing remark (26 chars)
Currently rented for $660.
-
2025-01-22historical $1,200
-
2024-11-09$1,200
-
2023-06-15soldstatus $92,000
-
2023-06-03status Pending 26-char remark
Show marketing remark (26 chars)
Currently rented for $660.
-
2023-05-30soldstatus $92,000 Closed 26-char remark
Show marketing remark (26 chars)
Currently rented for $660.
-
2023-05-10historical Contingent 26-char remark
Show marketing remark (26 chars)
Currently rented for $660.
-
2023-04-10price $99,900 26-char remark
Show marketing remark (26 chars)
Currently rented for $660.
-
2023-03-01$110,000 Active 26-char remark
Show marketing remark (26 chars)
Currently rented for $660.
-
1990-08-02soldstatus $49,900
ⓘ Source: listings_history table (triggers on properties + properties_extension) + one-shot
backfill from property_details.listing_events for pre-trigger history.
Tax reassessment forecast OH · Partial reset (capped growth)
- Current annual tax
- $1,822 · $152/mo
- Projected year-2 tax
- $1,822 · $152/mo
- Expected delta
- $0/yr ($0/mo · 0.0%)
ⓘ Screening estimate from a state-policy table — verify with the county assessor before closing.
Climate risk First Street
- Flood 1/10 Low FEMA zone X (unshaded) · 0% chance over 30 yrs
- Wildfire 1/10 Low
- Heat 3/10 Moderate 7 d/yr ≥101°F today · 16 d/yr by 30 yrs out
- Wind 2/10 Low
- Air quality 2/10 Low 1 unhealthy d/yr today · 3 by 30 yrs out
Nearby sold comps map
Loading sold comps map…
Walkable amenities ~0.75 mi
Loading nearby amenities…
Taxation est. · year 1
- Rental income
- $14,888
- − Mortgage interest
- −$6,162
- − Property taxes
- −$1,822
- − Insurance
- −$550
- − Repairs & maintenance
- −$1,191
- − Management
- −$1,191
- − Depreciation
- −$3,200
- Taxable income
- $773
- Est. tax owed @ 24.0%
- −$185
- After-tax cash flow
- $2,282/yr
For passive investors: Depreciation is non-cash, so a rental often shows a tax loss while cash-flowing — sheltering income. Rental losses are passive: they offset passive income freely, and up to $25,000/yr can offset ordinary (W-2) income if you actively participate and your MAGI is under $100k (phasing out to $0 by $150k); unused losses carry forward. On sale, claimed depreciation is recaptured at up to 25%, and gains may owe capital-gains tax (a 1031 exchange can defer both). Figures are a year-1 estimate at your 24.0% rate — not tax advice; consult a CPA.
Schools (NCES district)
- District
- Toledo City
- NCES district ID
- 3904490
- Math proficiency
- 15% ▼ -16.00%
- Reading proficiency
- 24% ▼ -13.00%
- Median HH income
- $32,137
- Composite
- 15.76/100
- National rank
- #9276
- State rank
- #634 of 656 in OH
Livability — Toledo
- Score
- 66/100
- State rank
- #645
- US rank
- #11442
Category grades
Schools grade is shown separately in the Schools card above.
Census & demographics
- Census place
- Toledo, OH
- County
- Lucas County · 380,724 people
- City population
- 280,811
- Metro
- Toledo, OH
- Population (ZIP)
- 28,480
- Household income
- $50,728
- Rent vs Own
- Severe rent burden
- 1203.0
Population outlook (Lucas County) Hauer SSP2
- Today (2025)
- 420,751 people
- By 2030
- 410,187 · -2.5%
- By 2040
- 384,019 · -8.7%
- By 2050
- 355,125 · -15.6%
- By 2075
- 291,683 · -30.7%
- By 2100
- 233,670 · -44.5%
Race, ethnicity, and origin ACS 2023
- Neighborhood character
- Majority White (63%)
- Race & ethnicity
- White 63% Black 23% Two or more races 10% Hispanic / Latino 9%
- Hispanic origin (detail)
- Mexican 6% Puerto Rican 2%
- Common ancestry
- Romanian 9% Lithuanian 3% Italian 1%
- Foreign-born
- 2% · Canada
- Languages at home
- 96% English-only · Spanish 2% French/Haitian/Cajun 1%
Political lean MEDSL · Lucas
- 2024 margin
- D (+12.6) · D 55.8% · R 43.2%
- 2008→2024 swing
- -18.9pp toward R · 2008: 31.4pp · 2024: 12.6pp
- All cycles
- 2024: D+12.6 2020: D+16.8 2016: D+17.4 2012: D+30.4 2008: D+31.4
Not yet ingested
- Civics
- —
Market trends
- HPI YoY
- ▼ -50.05%
- Current HPI
- 235.5389
- Rent YoY
- ▲ 6.01%
- Metro
- Toledo, OH
- State GDP YoY
- ▲ 1.98%
- F500 in state
- 48
Industry mix (Fortune 500 HQ in OH)
| Industry | F500 HQs | Revenue |
|---|---|---|
| Insurance | 3 | $145B |
|
||
| Industrial Machinery | 3 | $49B |
|
||
| Financial Services | 3 | $24B |
|
||
| Consumer Goods | 2 | $93B |
|
||
| Aerospace / Defense | 2 | $47B |
|
||
| Utilities | 2 | $33B |
|
||
Price history
+130.5% since first listed13 events — show timeline
- 2026-04-10 Price Changed $115,000 NORIS
- 2026-03-26 Price Changed $117,000 NORIS
- 2026-02-23 Listed $119,000 NORIS
- 2025-10-14 Price Changed $92,000 NORIS
- 2025-01-22 Rental Removed $1,200 APPFOLIO
- 2024-11-09 Listed for Rent $1,200 APPFOLIO
- 2023-06-15 Sold (Public Records) $92,000 Public Records
- 2023-06-03 Pending — NORIS
- 2023-05-30 Sold (MLS) $92,000 NORIS
- 2023-05-10 Contingent — NORIS
- 2023-04-10 Price Changed $99,900 NORIS
- 2023-03-01 Listed $110,000 NORIS
- 1990-08-02 Sold (Public Records) $49,900 Public Records
Property tax history
+2.5%/yrLatest (2025): $1,822 · +0.3% YoY. Source: county tax records.
Cash-flow waterfall
monthlySold comps — $/sqft
last 12 mo · ≤1 miLoading sold comps…