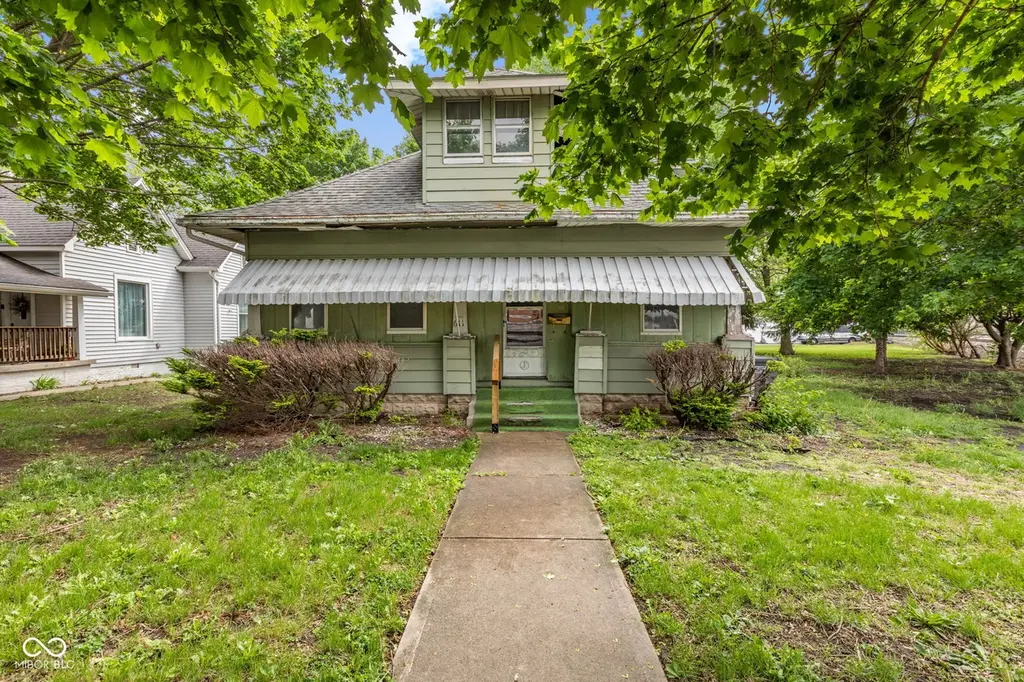
611 N Main St · Tipton, IN
Flood risk 1/10 · Minimal
- FEMA flood zone
- X (unshaded)
- Chance of flooding over 30 yrs
- 0.0%
- Est. flood insurance / yr
- $507 – $1,088
Fire risk 1/10 · Minimal
- Est. fire insurance / yr
- $717 – $1,331
Heat risk 3/10 · Minor
- Hot days now (above 100°F)
- 7 days/yr
- Hot days in 30 yrs
- 18 days/yr
Wind risk 2/10 · Minimal
- Chance of severe wind over 30 yrs
- —
Air-quality risk 3/10 · Minor
- Unhealthy air days now
- 2 days/yr
- Unhealthy air days in 30 yrs
- 4 days/yr
Risk factors via First Street. Map © Google.
Why this score? — see what drove the C grade
The composite is a weighted blend of 9 inputs, each scored 0–100. Each bar is that input's sub-score; the figure is the points it added to the 100-point composite (weight × sub-score).
- Cash flow +20.0/30.0
- ARV discount +15.0/15.0
- DSCR +6.3/10.0
- 1% rule +4.6/10.0
- Livability +4.0/5.0
- Schools +3.5/10.0
- Rent growth +2.5/5.0
- Condition / age +2.5/5.0
- Appreciation +0.0/10.0
$135,000
🖨 Deal sheet (PDF) 📄 Offer letter ✓ Due diligence
Listing remarks
Welcome to 611 N. Main, conveniently located near everything Tipton has to offer. Step into the enclosed front porch and imagine the possibilities; this home is ready for your vision and personal touch. Inside, you'll find original character throughout, including hardwood flooring, wide stained moldings, and a classic wood staircase. The main level features a primary bedroom with its own en-suite bath, while two additional bedrooms and a half bath are located upstairs in the finished attic space. The home is equipped with boiler heat for the colder months, and window air conditioning helps keep things comfortable in the summer. Outside, three parcels combine for a generous 0.37-acre lot, of
Key facts
- 0.37 acre lot
- Garage
- Built 1920
Property features AI
Exterior
- Parking: Detached garage (1 car)
- Utilities: Public water; Municipal sewer connection; Municipal solid waste service
- Home design: Single-family residence; Two levels; Property listed as a fixer; Additional parcels included
- Construction: Aluminum and wood siding; Cellar and crawl space foundation
- Exterior features: Covered, glass-enclosed porch/patio; City lot with curbs, sidewalks and street lights; Mature trees; Irregular lot, not in a subdivision
Interior
- Kitchen: Gas oven; Refrigerator
- Bedrooms: Three bedrooms total — one on the main level and two on the upper level; Upper bedrooms measure approximately 19x11 and 11x10; Main-level bedroom and additional main rooms (including great room and dining room)
- Flooring: Hardwood floors
- Bathrooms: One full bathroom and one half bathroom (full bath on main level, half bath on upper level)
- Heating & cooling: Hot water heating; Wall cooling unit(s)
- Interior features: Attic access; Hardwood floors; Stained woodwork; Cellar and unfinished basement with interior entry
- Laundry & utility: Washer and dryer; Water heater
Neighborhood map
What this means for you Summary
Snapshot
- This is a 3-bed/1.5-bath single-family listed at $135k.
Deal economics
- At list price, monthly cash flow is $166 ($2k/yr) — positive.
- The deal already cash-flows at list — no discount required.
- To meet the 1% rule (rent ≥ 1% of price), the offer needs to be $130k (4.1% below list).
- Recommended offer: $130k (4.1% below list) — sets the bar for 1% rule.
- Cap rate 7.8% vs local median 3.8% in Tipton — top-decile yield for the area; either an underpriced asset or a hidden risk that comps aren't pricing in. Stress-test before assuming the spread holds.
Location & tenants
- Location reads 81/100 on livability (#16 in IN, #1,419 nationally) — a professional / high-income tenant draw. Strengths: crime A+, cost of living A+, housing A+; Watch: commute F.
- Tipton Community School Corporation (town): math 38% / reading 43% proficiency, ranked #130 of 301 in IN (top 43%) — families likely to look elsewhere, expect single-tenant / working-renter base with shorter leases.
- Zoned schools: Tipton Elementary School (math 55% / reading 44%, grade D, #279 of 994 statewide, top 30%, 668 students, 48% FRL); Tipton High School (math 32% / reading 52%, grade F, #197 of 369 statewide, top 57%, 439 students, 33% FRL).
- Market conditions: 52 active listings in the ZIP; 1 comparable units currently listed for rent nearby; 32 units permitted in Tipton County in 2024 (0 in 5+ unit buildings).
Forward outlook
- Local home prices are declining (-3.0%/yr); year-one equity from $933 of loan paydown is wiped out by about $4k of value loss. Plan a longer hold.
- Tipton County population projected at -23% by 2050 — secular population decline; favor cash flow + early exit over multi-decade hold.
Negotiation context
- It's been on market 49 days — a 3% lower offer ($131k) is reasonable based on typical stale-listing flexibility.
Risks & watch-outs
- Watch-outs: built in 1920 — expect roof / HVAC / electrical / plumbing capex.
Questions for the listing agent
- It's been on market 49 days. Have you received any prior offers? Is the seller open to a 4% concession, seller financing, or rate buy-down credit?
- Built in 1920 — when were the roof, HVAC, electrical panel, plumbing, and water heater last replaced?
- Is there a deadline driving the sale (1031 exchange, divorce, estate, relocation)? That informs how much negotiation room exists.
- Schools are D-rated, which usually means shorter tenancies and higher turnover. Who's the typical renter profile here, and what's been the actual vacancy rate?
- What's the average days-on-market for RENTAL listings here right now (not sales)? A rising rental-DOM trend means longer vacancies and softer asking-rent achievability than the comps imply.
- What's the recent tenant-quality profile in this submarket — average credit score on applications, eviction rate, late-payment / NSF rate, and stable-employment percentage? A property-management company in the area should have these aggregated.
- How much new for-sale + rental construction is in the pipeline within 1–3 miles? Heavy new supply typically softens prices + rents 12–24 months out; constrained supply supports both.
Investment metrics
- 1% rule
- 0.96% ✗
- Cap rate
- 7.77%
- Cash-on-cash
- 5.26%
- DSCR
- 1.23
- GRM
- 8.7
CMA / ARV
- ARV (median comp)
- $238,569
- List price
- $135,000
- Delta
- -43.41%
- Verdict
- UNDERPRICED
- Comps
- 20 within 1.0 mi
Show comp detail 12 sales within ~0.75 mi
| Address | Dist | Beds/Ba | Sqft | Sold | Price | $/sf | Match |
|---|---|---|---|---|---|---|---|
| 1026 N Main St | 0.36mi | 3/1.5 | 1,938 (-1%) | 4mo | $205,000 | $106 | 78 |
| 803 N East St | 0.21mi | 3/1.0 | 1,794 (-8%) | 7mo | $170,000 | $95 | 68 |
| 1061 N Main St | 0.43mi | 3/1.0 | 2,036 (+4%) | 6mo | $228,000 | $112 | 67 |
| 337 Sweetland Ave | 0.58mi | 3/1.0 | 1,968 (+0%) | 7mo | $63,000 | $32 | 65 |
| 1050 N Main St | 0.41mi | 3/2.5 | 1,824 (-7%) | 4mo | $275,000 | $151 | 62 |
| 625 N East St | 0.15mi | 4/2.0 (+1) | 1,706 (-13%) | 8mo | $245,900 | $144 | 58 |
| 450 Columbia Ave | 0.42mi | 3/1.0 | 1,821 (-7%) | 11mo | $149,900 | $82 | 58 |
| 114 S Conde St | 0.67mi | 3/2.0 | 1,984 (+1%) | 11mo | $225,000 | $113 | 56 |
| 920 N Main St | 0.28mi | 4/2.0 (+1) | 2,204 (+12%) | 6mo | $258,900 | $117 | 54 |
| 302 N Conde St | 0.46mi | 3/2.0 | 1,758 (-10%) | 13mo | $235,000 | $134 | 48 |
| 222 Oak St | 0.52mi | 3/2.5 | 2,155 (+10%) | 10mo | $330,000 | $153 | 46 |
| 221 N Conde St | 0.50mi | 3/2.0 | 1,666 (-15%) | 9mo | $265,000 | $159 | 42 |
Match score weights: distance 35% · size 25% · config 20% · recency 20%. Top-matched comps best support the ARV.
Projected returns pro-forma
-3.0% appreciation · 3.0% rent growth · sell at horizon
- IRR
- -8.2%
- Equity multiple
- 0.70×
- Total profit
- $-11,340
- Equity at exit
- $20,129
- IRR
- 1.4%
- Equity multiple
- 1.10×
- Total profit
- $3,617
- Equity at exit
- $11,672
Cash invested: $37,800 (down + closing). Projections, not guarantees.
Landlord ↔ Tenant lean methodology
- Overall (STATE)
- 90 Strongly Landlord-Friendly
- State Indiana
- 90 Strongly Landlord-Friendly · R+11
- County
- — inherits STATE
- City
- — inherits STATE
ZIP-level market 46072
- Home prices YoY
- -28.7%
- Active inventory
- 52
- Price-to-rent
- 8.7×
Monthly cashflow live
- Estimated rent
- $1,295 medium interval (Pro) →
- Mortgage (P&I)
- −$708
- Tax from tax record
- −$93 /mo · $1,116/yr
- Insurance
- −$56
- HOA
- −$0
- Vacancy / Maint / Mgmt
- −$272
- Net cashflow
- $166
Break-even live
Sensitivity live
| Price | -10% $242 | -5% $204 | +0% $166 | +5% $128 | +10% $89 |
|---|---|---|---|---|---|
| Rent | -10% $64 | -5% $115 | +0% $166 | +5% $217 | +10% $268 |
| Rate | -1.0pp $234 | -0.5pp $200 | base $166 | +0.5pp $131 | +1.0pp $95 |
UW: 25.0% down · 7.5% · 30yr · 1.5% tax · 5.0% vac · 8.0% maint · 8.0% mgmt
Financing live
Cash to close
- Down payment
- $33,750
- Closing costs
- $4,050
- Reserves months
- —
- Total cash needed
- —
Loan-product check · same deal, 3 products live
Conventional
25% down · 7.5% · 30yr
- Down + closing
- —
- Monthly P&I
- —
- Monthly cashflow
- —
- DSCR
- —
- Eligible?
- —
Personal DTI + credit; lowest rate.
DSCR
20% down · 8.5% · 30yr
- Down + closing
- —
- Monthly P&I
- —
- Monthly cashflow
- —
- DSCR
- —
- Eligible?
- —
No personal income docs; deal must DSCR.
Hard money
10% down · 12.0% · 12mo
- Down + closing
- —
- Monthly P&I
- —
- Monthly cashflow
- —
- DSCR
- —
- Eligible?
- —
Short-term bridge; refi at stabilization.
Rent comps 1 comps
| Address | Beds | Baths | Sqft | Rent | $/sqft | DOM | Units | Dist |
|---|---|---|---|---|---|---|---|---|
| 115 3rd St Tipton, IN | 3.0 | 1.0 | 1540 | $1,295 | $0.84 | 15d | 1 | 0.77mi |
Listing history 14 events
-
2026-06-18days on market $135,000 Active 49 DOM
-
2026-06-17days on market $135,000 Active 48 DOM
-
2026-06-16pricedays on market $135,000 Active 47 DOM
-
2026-06-15days on market $149,900 Active 46 DOM
-
2026-06-13days on market $149,900 Active 44 DOM
-
2026-06-13days on market $149,900 Active 43 DOM
-
2026-06-09days on market $149,900 Active 40 DOM
-
2026-06-08days on market $149,900 Active 39 DOM
-
2026-06-07days on market $149,900 Active 38 DOM
-
2026-06-03days on market $149,900 Active 34 DOM
-
2026-06-02days on market $149,900 Active 33 DOM
-
2026-06-01days on market $149,900 Active 32 DOM
-
2026-05-31days on market $149,900 Active 31 DOM
-
2026-04-30$155,000 Active 1035-char remark
ⓘ Source: listings_history table (triggers on properties + properties_extension) + one-shot
backfill from property_details.listing_events for pre-trigger history.
Tax reassessment forecast IN · Partial reset (capped growth)
- Current annual tax
- $1,116 · $93/mo
- Projected year-2 tax
- $1,132 · $94/mo
- Expected delta
- +$16/yr (+$1/mo · 1.4%)
ⓘ Screening estimate from a state-policy table — verify with the county assessor before closing.
Climate risk First Street
- Flood 1/10 Low FEMA zone X (unshaded) · 0% chance over 30 yrs
- Wildfire 1/10 Low
- Heat 3/10 Moderate 7 d/yr ≥100°F today · 18 d/yr by 30 yrs out
- Wind 2/10 Low
- Air quality 3/10 Moderate 2 unhealthy d/yr today · 4 by 30 yrs out
Nearby sold comps map
Loading sold comps map…
Walkable amenities ~0.75 mi
Loading nearby amenities…
Taxation est. · year 1
- Rental income
- $15,540
- − Mortgage interest
- −$7,562
- − Property taxes
- −$1,116
- − Insurance
- −$675
- − Repairs & maintenance
- −$1,243
- − Management
- −$1,243
- − Depreciation
- −$3,927
- Taxable loss
- −$227
- Est. tax savings @ 24.0%
- +$54
- After-tax cash flow
- $2,045/yr
For passive investors: Depreciation is non-cash, so a rental often shows a tax loss while cash-flowing — sheltering income. Rental losses are passive: they offset passive income freely, and up to $25,000/yr can offset ordinary (W-2) income if you actively participate and your MAGI is under $100k (phasing out to $0 by $150k); unused losses carry forward. On sale, claimed depreciation is recaptured at up to 25%, and gains may owe capital-gains tax (a 1031 exchange can defer both). Figures are a year-1 estimate at your 24.0% rate — not tax advice; consult a CPA.
Schools (NCES district)
- District
- Tipton Community School Corporation
- NCES district ID
- 1811400
- Math proficiency
- 38% ▼ -10.00%
- Reading proficiency
- 43% ▼ -9.00%
- Median HH income
- $51,073
- Composite
- 35.0/100
- National rank
- #5048
- State rank
- #130 of 301 in IN
Livability — Tipton
- Score
- 81/100
- State rank
- #16
- US rank
- #1419
Category grades
Schools grade is shown separately in the Schools card above.
Census & demographics
- Census place
- Tipton, IN
- Population (ZIP)
- 8,751
Population outlook (Tipton County) Hauer SSP2
- Today (2025)
- 14,332 people
- By 2030
- 13,717 · -4.3%
- By 2040
- 12,357 · -13.8%
- By 2050
- 11,032 · -23.0%
- By 2075
- 8,640 · -39.7%
- By 2100
- 6,544 · -54.3%
Race, ethnicity, and origin ACS 2023
- Neighborhood character
- Predominantly White (93%)
- Race & ethnicity
- White 93% Hispanic / Latino 4% Two or more races 3% Black 1%
- Common ancestry
- Italian 2% Slovak 2% Lithuanian 2%
- Foreign-born
- 2% · Canada
- Languages at home
- 97% English-only · Spanish 2%
Political lean MEDSL · Tipton
- 2024 margin
- Solid R (+50.8) · D 23.7% · R 74.5% · Other 1.7%
- 2008→2024 swing
- -35.5pp toward R · 2008: -15.4pp · 2024: -50.8pp
- All cycles
- 2024: R+50.8 2020: R+52.7 2016: R+53.3 2012: R+31.8 2008: R+15.4
Not yet ingested
- Civics
- —
Market trends
- HPI YoY
- ▼ -105.28%
- Current HPI
- 261.1877
- Rent YoY
- —
- Metro
- —
- State GDP YoY
- ▲ 2.90%
- F500 in state
- 18
Industry mix (Fortune 500 HQ in IN)
| Industry | F500 HQs | Revenue |
|---|---|---|
| Industrial Machinery | 2 | $37B |
|
||
| Healthcare | 1 | $177B |
|
||
| Pharmaceuticals | 1 | $45B |
|
||
| Metals / Steel | 1 | $18B |
|
||
| Agriculture | 1 | $17B |
|
||
| Packaging | 1 | $12B |
|
||
Price history
-12.9% since first listed3 events — show timeline
- 2026-06-16 Price Changed $135,000 MIBOR as Distributed by MLS Grid
- 2026-05-21 Price Changed $149,900 MIBOR as Distributed by MLS Grid
- 2026-04-30 Listed $155,000 MIBOR as Distributed by MLS Grid
Property tax history
+6.8%/yrLatest (2024): $1,116 · +7.1% YoY. Source: county tax records.
Cash-flow waterfall
monthlySold comps — $/sqft
last 12 mo · ≤1 miLoading sold comps…