101 Quinn Ln · Fountain Inn, SC
Flood risk 1/10 · Minimal
- FEMA flood zone
- X (unshaded)
- Chance of flooding over 30 yrs
- 0.0%
- Est. flood insurance / yr
- $507 – $1,088
Fire risk 4/10 · Minor
- Est. fire insurance / yr
- $783 – $1,453
Heat risk 5/10 · Moderate
- Hot days now (above 104°F)
- 7 days/yr
- Hot days in 30 yrs
- 16 days/yr
Wind risk 2/10 · Minimal
- Chance of severe wind over 30 yrs
- 2.0%
Air-quality risk 3/10 · Minor
- Unhealthy air days now
- 3 days/yr
- Unhealthy air days in 30 yrs
- 3 days/yr
Risk factors via First Street. Map © Google.
Why this score? — see what drove the D+ grade
The composite is a weighted blend of 9 inputs, each scored 0–100. Each bar is that input's sub-score; the figure is the points it added to the 100-point composite (weight × sub-score).
- Cash flow +12.1/30.0
- ARV discount +10.8/15.0
- Schools +4.2/10.0
- Livability +4.1/5.0
- Condition / age +4.0/5.0
- DSCR +3.6/10.0
- Rent growth +3.6/5.0
- 1% rule +3.5/10.0
- Appreciation +0.0/10.0
$349,060
🖨 Deal sheet (PDF) 📄 Offer letter ✓ Due diligence
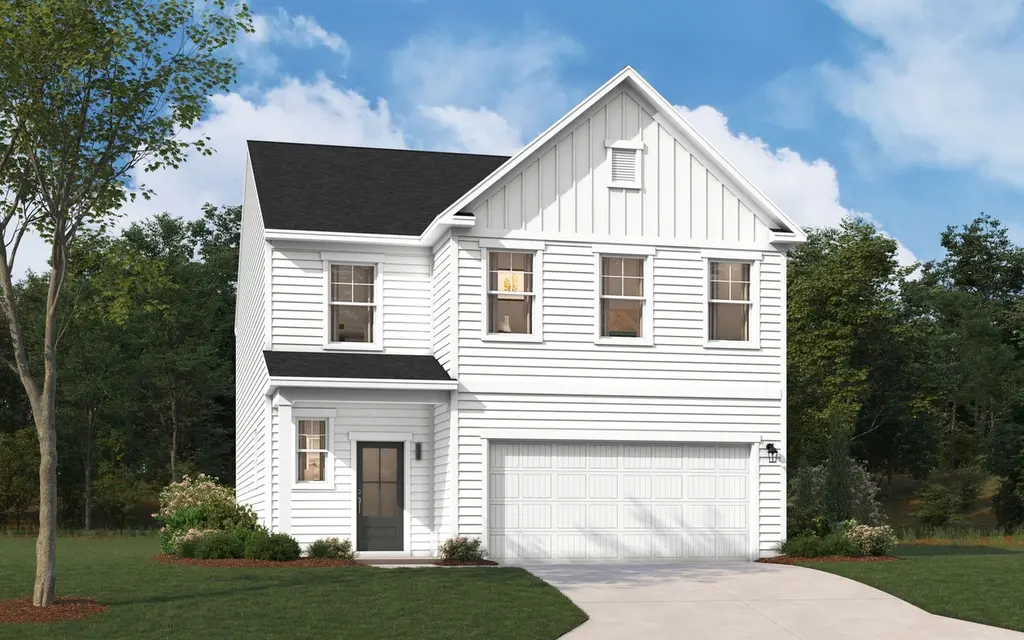
Listing remarks
Introducing the Tyndall at Hamptons, a condo neighborhood with a pickleball court, playground, and green spaces, minutes from shopping and dining. This Tyndall spans two floors at roughly 2,350 square feet, with four bedrooms, two full baths, a powder room, and a two-car garage. The main level connects the kitchen, dining area, and family room in an open layout that keeps the spaces linked without feeling cramped. A gas range and side-by-side refrigerator anchor the kitchen, and the island gives plenty of room for meal prep while the dining area stays close by. A covered patio off the back extends the living space outward, and a gas fireplace in the family room adds warmth when the temperat
Key facts
- Dual sinks
- Pocket office
- Ensuite bath
Tags
Property features AI
Finance
- Other: Address: 101 Quinn Ln, Fountain Inn, SC 29644
- Financial info: List price $349,060
Exterior
- Parking: 2-car garage (2 total parking spaces)
- Home design: Single-family home; Active listing
- Exterior features: Living area approximately 2325
Interior
- Bedrooms: 3 bedrooms
- Bathrooms: 2 bathrooms
- Interior features: Spec home (The Tyndall plan)
Neighborhood map
What this means for you Summary
Snapshot
- This is a 3-bed/2.0-bath single-family listed at $349k. Condition is rated good.
Deal economics
- At list price, monthly cash flow is $-76 ($-910/yr) — negative.
- To cash-flow at today's rent, offer at most $338k (3.1% below list).
- To meet the 1% rule (rent ≥ 1% of price), the offer needs to be $296k (15.3% below list).
- Recommended offer: $296k (15.3% below list) — sets the bar for 1% rule.
- Cap rate 6.0% vs local median 4.1% in Fountain Inn — top-decile yield for the area; either an underpriced asset or a hidden risk that comps aren't pricing in. Stress-test before assuming the spread holds.
Location & tenants
- Location reads 82/100 on livability (#4 in SC, #1,162 nationally) — a professional / high-income tenant draw. Strengths: crime A+, cost of living A+, housing A+; Watch: commute F.
- Greenville 01 (suburban): math 44% / reading 54% proficiency, ranked #10 of 80 in SC (top 12%) — families likely to look elsewhere, expect single-tenant / working-renter base with shorter leases.
- Market conditions: Rents rising fast (+4.5%/yr); 484 active listings in the ZIP; 3 comparable units currently listed for rent nearby; rentals at typical pace (median 21d on market — plan ~3-4 weeks tenant-placement turnaround); 5,595 units permitted in Greenville County in 2024 (566 in 5+ unit buildings).
- At $2,958/mo this rent would consume 50% of the median local household income ($70k/yr) (locally 475% of renters already pay >50% of income on rent) — very limited rent-growth headroom before tenants either downsize or default.
Forward outlook
- Local home prices are declining (-3.0%/yr); year-one equity from $2k of loan paydown is wiped out by about $10k of value loss. Plan a longer hold.
- Greenville County population projected at +34% by 2050 — long-run rental-demand tailwind backs the buy-and-hold thesis.
Negotiation context
- Only 13 days on market — expect competitive offers; lowballing is unlikely to land.
Risks & watch-outs
- Climate carrying-cost: extreme-heat days projected 7→16/yr by 2055 (HVAC capex compounding) — expect insurance premiums to compound above CPI over the hold.
Questions for the listing agent
- What do current leases actually rent for vs. the listed asking? Can we see a recent rent roll and the last 12 months of T-12 income?
- Is there a deadline driving the sale (1031 exchange, divorce, estate, relocation)? That informs how much negotiation room exists.
- The area grade is low — what's the realistic commute time and amenity access for the typical tenant pool here? Any planned neighborhood developments (good or bad) we should know about?
- What's the average days-on-market for RENTAL listings here right now (not sales)? A rising rental-DOM trend means longer vacancies and softer asking-rent achievability than the comps imply.
- What's the recent tenant-quality profile in this submarket — average credit score on applications, eviction rate, late-payment / NSF rate, and stable-employment percentage? A property-management company in the area should have these aggregated.
- How much new for-sale + rental construction is in the pipeline within 1–3 miles? Heavy new supply typically softens prices + rents 12–24 months out; constrained supply supports both.
Investment metrics
- 1% rule
- 0.85% ✗
- Cap rate
- 6.03%
- Cash-on-cash
- -0.93%
- DSCR
- 0.96
- GRM
- 9.8
CMA / ARV
- ARV (on-the-fly)
- $376,650
- Comps found
- 10
Show comp detail 10 sales within ~0.75 mi
| Address | Dist | Beds/Ba | Sqft | Sold | Price | $/sf | Match |
|---|---|---|---|---|---|---|---|
| 905 Elgon Walk Dr | 0.71mi | 4/2.5 (+1) | 2,345 (+1%) | 0mo | $380,000 | $162 | 58 |
| 604 Hollybank St | 0.70mi | 4/2.0 (+1) | 2,345 (+1%) | 3mo | $279,900 | $119 | 58 |
| 27 Grossmont Dr | 0.58mi | 3/2.0 | 2,401 (+3%) | 12mo | $460,000 | $192 | 58 |
| 617 Hollybank St | 0.74mi | 4/2.5 (+1) | 2,345 (+1%) | 1mo | $379,900 | $162 | 56 |
| 124 Beechcroft Pl | 0.63mi | 3/2.0 | 2,100 (-10%) | 1mo | $345,000 | $164 | 54 |
| 601 Hollybank St | 0.71mi | 4/2.5 (+1) | 2,459 (+6%) | 4mo | $364,000 | $148 | 47 |
| 121 Roocroft Ct Lot 0099 | 0.55mi | 4/2.5 (+1) | 2,164 (-7%) | 13mo | $319,900 | $148 | 45 |
| 6 Shallow Creek Ct | 0.43mi | 4/2.5 (+1) | 2,583 (+11%) | 12mo | $565,000 | $219 | 44 |
| 336 Hazelcroft Dr | 0.69mi | 4/2.5 (+1) | 2,345 (+1%) | 20mo | $372,000 | $159 | 43 |
| 348 Hazelcroft Dr | 0.72mi | 4/2.5 (+1) | 2,345 (+1%) | 22mo | $377,900 | $161 | 40 |
Match score weights: distance 35% · size 25% · config 20% · recency 20%. Top-matched comps best support the ARV.
Projected returns pro-forma
-3.0% appreciation · 4.55% rent growth · sell at horizon
- IRR
- -16.1%
- Equity multiple
- 0.42×
- Total profit
- $-56,663
- Equity at exit
- $52,046
- IRR
- -5.2%
- Equity multiple
- 0.64×
- Total profit
- $-35,541
- Equity at exit
- $30,180
Cash invested: $97,737 (down + closing). Projections, not guarantees.
Landlord ↔ Tenant lean methodology
- Overall (STATE)
- 90 Strongly Landlord-Friendly
- State South Carolina
- 90 Strongly Landlord-Friendly · R+6
- County
- — inherits STATE
- City
- — inherits STATE
ZIP-level market 29644
- Home prices YoY
- -28.6%
- Rents YoY
- 4.5%
- Active inventory
- 484
- Price-to-rent
- 9.8×
Monthly cashflow live
- Estimated rent
- $2,958 medium interval (Pro) →
- Mortgage (P&I)
- −$1,831
- Tax est. 1.5%
- −$436 /mo · $5,236/yr
- Insurance
- −$145
- HOA
- −$0
- Vacancy / Maint / Mgmt
- −$621
- Net cashflow
- $-76
Break-even live
Sensitivity live
| Price | -10% $165 | -5% $45 | +0% $-76 | +5% $-196 | +10% $-317 |
|---|---|---|---|---|---|
| Rent | -10% $-309 | -5% $-193 | +0% $-76 | +5% $41 | +10% $158 |
| Rate | -1.0pp $100 | -0.5pp $13 | base $-76 | +0.5pp $-166 | +1.0pp $-258 |
UW: 25.0% down · 7.5% · 30yr · 1.5% tax · 5.0% vac · 8.0% maint · 8.0% mgmt
Financing live
Cash to close
- Down payment
- $87,265
- Closing costs
- $10,472
- Reserves months
- —
- Total cash needed
- —
Loan-product check · same deal, 3 products live
Conventional
25% down · 7.5% · 30yr
- Down + closing
- —
- Monthly P&I
- —
- Monthly cashflow
- —
- DSCR
- —
- Eligible?
- —
Personal DTI + credit; lowest rate.
DSCR
20% down · 8.5% · 30yr
- Down + closing
- —
- Monthly P&I
- —
- Monthly cashflow
- —
- DSCR
- —
- Eligible?
- —
No personal income docs; deal must DSCR.
Hard money
10% down · 12.0% · 12mo
- Down + closing
- —
- Monthly P&I
- —
- Monthly cashflow
- —
- DSCR
- —
- Eligible?
- —
Short-term bridge; refi at stabilization.
Rent comps 3 comps
| Address | Beds | Baths | Sqft | Rent | $/sqft | DOM | Units | Dist |
|---|---|---|---|---|---|---|---|---|
| 119 Cranford Rd Fountain Inn, SC | 4.0 | 3.0 | 2174 | $2,495 | $1.15 | 21d | 1 | 0.60mi |
| 101 Fennec Dr Fountain Inn, SC | 3.0 | 3.0 | 1735 | $2,099 | $1.21 | 5d | 1 | 1.14mi |
| 404 Blue Sage Pl Simpsonville, SC | 4.0 | 2.0 | 1950 | $6,000 | $3.08 | 25d | 1 | 1.38mi |
Listing history 10 events
-
2026-06-22days on market $349,060 Active 13 DOM
-
2026-06-18days on market $349,060 Active 10 DOM
-
2026-06-17days on market $349,060 Active 9 DOM
-
2026-06-16days on market $349,060 Active 8 DOM
-
2026-06-15days on market $349,060 Active 7 DOM
-
2026-06-13days on market $349,060 Active 5 DOM
-
2026-06-13days on market $349,060 Active 4 DOM
-
2026-06-10days on market $349,060 Active 2 DOM
-
2026-06-09remarks 699-char remark
-
2026-06-09$349,060 Active 1 DOM
ⓘ Source: listings_history table (triggers on properties + properties_extension) + one-shot
backfill from property_details.listing_events for pre-trigger history.
Climate risk First Street
- Flood 1/10 Low FEMA zone X (unshaded) · 0% chance over 30 yrs
- Wildfire 4/10 Moderate
- Heat 5/10 Major 7 d/yr ≥104°F today · 16 d/yr by 30 yrs out
- Wind 2/10 Low 2% chance of damaging wind over 30 yrs
- Air quality 3/10 Moderate 3 unhealthy d/yr today · 3 by 30 yrs out
Nearby sold comps map
Loading sold comps map…
Walkable amenities ~0.75 mi
Loading nearby amenities…
Taxation est. · year 1
- Rental income
- $35,491
- − Mortgage interest
- −$19,553
- − Property taxes
- −$5,236
- − Insurance
- −$1,745
- − Repairs & maintenance
- −$2,839
- − Management
- −$2,839
- − Depreciation
- −$10,154
- Taxable loss
- −$6,876
- Est. tax savings @ 24.0%
- +$1,650
- After-tax cash flow
- $741/yr
For passive investors: Depreciation is non-cash, so a rental often shows a tax loss while cash-flowing — sheltering income. Rental losses are passive: they offset passive income freely, and up to $25,000/yr can offset ordinary (W-2) income if you actively participate and your MAGI is under $100k (phasing out to $0 by $150k); unused losses carry forward. On sale, claimed depreciation is recaptured at up to 25%, and gains may owe capital-gains tax (a 1031 exchange can defer both). Figures are a year-1 estimate at your 24.0% rate — not tax advice; consult a CPA.
Condition & rehab AI · 8 photos
This thoughtfully designed single-family home in Fountain Inn, SC, offers a comfortable layout with modern finishes and a good condition. It is move-in ready with minor maintenance required.
Value-add opportunities
- Both Paint exterior — Enhances curb appeal and value
- Both Replace ceiling fans with energy-efficient models — Saves on energy costs and improves comfort
- Both Install smart home devices — Improves convenience and energy efficiency
Renovation cost estimate screening
Value-add ROI direction
- Both Paint exterior — Enhances curb appeal and value ↑
- Both Replace ceiling fans with energy-efficient models — Saves on energy costs and improves comfort ↑
- Both Install smart home devices — Improves convenience and energy efficiency ↑
ⓘ Cost ranges are severity-bucket heuristics (US national rule-of-thumb). Get contractor quotes + a written scope before underwriting a rehab budget.
Schools (NCES district)
- District
- Greenville 01
- NCES district ID
- 4502310
- Math proficiency
- 44% ▼ -10.00%
- Reading proficiency
- 54% ▼ -2.00%
- Median HH income
- $49,596
- Composite
- 41.88/100
- National rank
- #3370
- State rank
- #10 of 80 in SC
Livability — Fountain Inn
- Score
- 82/100
- State rank
- #4
- US rank
- #1162
Category grades
Schools grade is shown separately in the Schools card above.
Census & demographics
- Census place
- Fountain Inn, SC
- County
- Greenville County · 573,815 people
- City population
- 22,907
- Metro
- Greenville-Anderson, SC
- Population (ZIP)
- 22,907
- Household income
- $70,301
- Rent vs Own
- Severe rent burden
- 475.0
Population outlook (Greenville County) Hauer SSP2
- Today (2025)
- 574,580 people
- By 2030
- 615,615 · +7.1%
- By 2040
- 695,373 · +21.0%
- By 2050
- 769,367 · +33.9%
- By 2075
- 933,296 · +62.4%
- By 2100
- 1,029,196 · +79.1%
Race, ethnicity, and origin ACS 2023
- Neighborhood character
- Predominantly White (66%)
- Race & ethnicity
- White 66% Black 18% Two or more races 10% Hispanic / Latino 10%
- Hispanic origin (detail)
- Mexican 3% Puerto Rican 2%
- Common ancestry
- Slovak 3% Romanian 2% Lithuanian 2%
- Foreign-born
- 6% · Canada, Jamaica
- Languages at home
- 89% English-only · Spanish 9% Tagalog/Filipino 1%
Political lean MEDSL · Greenville
- 2024 margin
- Strong R (+22.2) · D 38.0% · R 60.2% · Other 1.8%
- 2008→2024 swing
- +1.7pp toward D · 2008: -23.9pp · 2024: -22.2pp
- All cycles
- 2024: R+22.2 2020: R+18.2 2016: R+24.7 2012: R+27.8 2008: R+23.9
Not yet ingested
- Civics
- —
Market trends
- HPI YoY
- ▼ -100.45%
- Current HPI
- 250.5271
- Rent YoY
- ▲ 4.55%
- Metro
- Greenville-Anderson, SC
- State GDP YoY
- ▲ 4.51%
- F500 in state
- 2
Industry mix (Fortune 500 HQ in SC)
| Industry | F500 HQs | Revenue |
|---|---|---|
| Packaging | 1 | $7B |
|
||
Cash-flow waterfall
monthlySold comps — $/sqft
last 12 mo · ≤1 miLoading sold comps…