146 Marina Dr · Westwood Shores, TX
Flood risk 1/10 · Minimal
- FEMA flood zone
- —
- Chance of flooding over 30 yrs
- 0.0%
- Est. flood insurance / yr
- —
Fire risk 2/10 · Minimal
- Est. fire insurance / yr
- $1,222 – $2,270
Heat risk 8/10 · Major
- Hot days now (above 111°F)
- 7 days/yr
- Hot days in 30 yrs
- 24 days/yr
Wind risk 8/10 · Major
- Chance of severe wind over 30 yrs
- 98.0%
Air-quality risk 1/10 · Minimal
- Unhealthy air days now
- 0 days/yr
- Unhealthy air days in 30 yrs
- 0 days/yr
Risk factors via First Street. Map © Google.
Why this score? — see what drove the C- grade
The composite is a weighted blend of 9 inputs, each scored 0–100. Each bar is that input's sub-score; the figure is the points it added to the 100-point composite (weight × sub-score).
- Cash flow +19.2/30.0
- ARV discount +7.5/15.0
- DSCR +6.1/10.0
- Appreciation +4.7/10.0
- 1% rule +4.6/10.0
- Livability +3.1/5.0
- Rent growth +2.5/5.0
- Condition / age +2.5/5.0
- Schools +2.3/10.0
$139,000
🖨 Deal sheet 📄 Offer letter ✓ Due diligence
Listing remarks
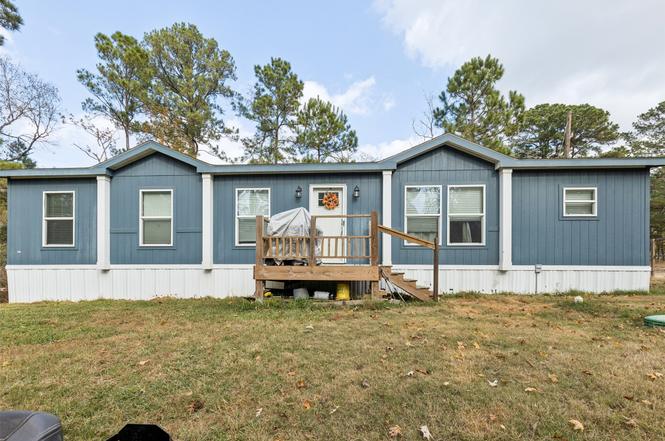
Tucked away in a quiet setting, this three-bedroom, two-bath home offers a welcoming blend of farmhouse-style interior updates and comfortable, well-proportioned living spaces. Thoughtful design details create a warm, inviting atmosphere throughout, while the open flow allows each room to feel connected yet distinct. The bedrooms are generously sized, providing flexibility and breathing room, and the layout supports both everyday living and relaxed downtime. Set apart from nearby homes, the property enjoys a sense of privacy and calm, creating a peaceful backdrop rarely found. Surrounded by open space and natural surroundings, this home offers a refreshing retreat from the everyday. Come ex
Key facts
- 4,016 sq ft lot
- Built 2021
Property features AI
Exterior
- Security: Smoke detector(s)
- Utilities: Septic tank
- Home design: Residential property; Built in 2021; Block foundation; Composition roof
- Construction: Block foundation; Composition roof; Built in 2021
- Exterior features: Deck; Porch; Patio; Private yard; Cleared lot
Interior
- Kitchen: Dishwasher; Electric cooktop; Electric oven
- Bedrooms: Primary bedroom on the first floor (approx. 12x14); Bedroom on the first floor (approx. 10x12); Bedroom on the first floor (approx. 12x10)
- Flooring: Vinyl
- Bathrooms: 2 full bathrooms
- Heating & cooling: Central heating (electric); Central air (electric)
- Interior features: Breakfast bar; Double vanity; Kitchen island; Kitchen/family room combo; Soaking tub; Separate shower; Tub/shower; Vanity; Ceiling fan(s); Kitchen/dining combo; Electric fireplace
- Laundry & utility: Washer hookup
Neighborhood map
What this means for you Summary
Snapshot
- This is a 3-bed/2.0-bath manufactured listed at $139k.
Deal economics
- At list price, monthly cash flow is $151 ($2k/yr) — positive.
- The deal already cash-flows at list — no discount required.
- To meet the 1% rule (rent ≥ 1% of price), the offer needs to be $133k (4.2% below list).
- Recommended offer: $133k (4.2% below list) — sets the bar for 1% rule.
- Cap rate 7.6% vs local median 3.6% in Westwood Shores — top-decile yield for the area; either an underpriced asset or a hidden risk that comps aren't pricing in. Stress-test before assuming the spread holds.
Location & tenants
- Location reads 62/100 on livability (#914 in TX) — a middle-class / working-renter tenant base. Strengths: crime A+, cost of living A+, housing A+; Watch: amenities F, commute F, health & safety F.
- Trinity ISD (rural): math 27% / reading 29% proficiency, ranked #682 of 826 in TX (top 83%) — low school quality limits family demand, transient renter base, plan for 1-2y turnover.
- Zoned schools: Lansberry El (math 35% / reading 33%, grade F, #2,149 of 4,322 statewide, top 50%, 570 students, 91% FRL); Trinity H S (math 22% / reading 32%, grade F, #1,204 of 1,632 statewide, top 75%, 350 students, 84% FRL) — zoned schools average 87% FRL vs 50% district-wide (37 pts higher); higher-poverty schools than district average — tighter screening recommended.
- Market conditions: 468 active listings in the ZIP; 1 units permitted in Trinity County in 2024 (0 in 5+ unit buildings).
Forward outlook
- In year one you build about $243 of equity ($961 loan paydown + $-718 appreciation (-0.5% local appreciation)).
- Trinity County population projected at -13% by 2050 — secular population decline; favor cash flow + early exit over multi-decade hold.
- At projected returns (-0.5% appreciation + 3.0% rent growth), your $39k cash investment doubles in ~10 years — after that, you're playing with house money.
Negotiation context
- Only 2 days on market — expect competitive offers; lowballing is unlikely to land.
- 4 sale attempts since 2y ago; this cycle's ask is 8588% above the opening price — seller raised mid-cycle; expect resistance to lowballs.
Risks & watch-outs
- Climate carrying-cost: severe wind risk, 98% chance of damaging wind over 30y; extreme-heat days projected 7→24/yr by 2055 (HVAC capex compounding) — expect insurance premiums to compound above CPI over the hold.
Questions for the listing agent
- Is there a deadline driving the sale (1031 exchange, divorce, estate, relocation)? That informs how much negotiation room exists.
- Schools are F-rated, which usually means shorter tenancies and higher turnover. Who's the typical renter profile here, and what's been the actual vacancy rate?
- What's the average days-on-market for RENTAL listings here right now (not sales)? A rising rental-DOM trend means longer vacancies and softer asking-rent achievability than the comps imply.
- What's the recent tenant-quality profile in this submarket — average credit score on applications, eviction rate, late-payment / NSF rate, and stable-employment percentage? A property-management company in the area should have these aggregated.
- How much new for-sale + rental construction is in the pipeline within 1–3 miles? Heavy new supply typically softens prices + rents 12–24 months out; constrained supply supports both.
Investment metrics
- 1% rule
- 0.96% ✗
- Cap rate
- 7.60%
- Cash-on-cash
- 4.65%
- DSCR
- 1.21
- GRM
- 8.7
CMA / ARV
No comps found within radius.
Projected returns pro-forma
-0.52% appreciation · 3.0% rent growth · sell at horizon
- IRR
- 1.2%
- Equity multiple
- 1.06×
- Total profit
- $2,190
- Equity at exit
- $36,806
- IRR
- 7.2%
- Equity multiple
- 1.74×
- Total profit
- $28,766
- Equity at exit
- $41,496
Cash invested: $38,920 (down + closing). Projections, not guarantees.
Landlord ↔ Tenant lean methodology
- Overall (STATE)
- 87 Strongly Landlord-Friendly
- State Texas
- 87 Strongly Landlord-Friendly · R+5
- County
- — inherits STATE
- City
- — inherits STATE
ZIP-level market 75862
- Home prices YoY
- -0.3%
- Active inventory
- 468
- Price-to-rent
- 8.7×
Monthly cashflow live
- Estimated rent
- $1,331 medium interval (Pro) →
- Mortgage (P&I)
- −$729
- Tax from tax record
- −$114 /mo · $1,364/yr
- Insurance
- −$58
- HOA
- −$0
- Vacancy / Maint / Mgmt
- −$280
- Net cashflow
- $151
Break-even live
UW: 25.0% down · 7.5% · 30yr · 1.5% tax · 5.0% vac · 8.0% maint · 8.0% mgmt
Financing live
Cash to close
- Down payment
- $34,750
- Closing costs
- $4,170
- Reserves months
- —
- Total cash needed
- —
Loan-product check · same deal, 3 products live
Conventional
25% down · 7.5% · 30yr
- Down + closing
- —
- Monthly P&I
- —
- Monthly cashflow
- —
- DSCR
- —
- Eligible?
- —
Personal DTI + credit; lowest rate.
DSCR
20% down · 8.5% · 30yr
- Down + closing
- —
- Monthly P&I
- —
- Monthly cashflow
- —
- DSCR
- —
- Eligible?
- —
No personal income docs; deal must DSCR.
Hard money
10% down · 12.0% · 12mo
- Down + closing
- —
- Monthly P&I
- —
- Monthly cashflow
- —
- DSCR
- —
- Eligible?
- —
Short-term bridge; refi at stabilization.
Listing history 25 events
-
2026-06-19days on market $139,000 Active 2 DOM
-
2026-06-17days on market $139,000 Active 1 DOM
-
2026-06-15days on market $139,000 Active 111 DOM
-
2026-06-14days on market $139,000 Active 109 DOM
-
2026-06-13days on market $139,000 Active 108 DOM
-
2026-06-09days on market $139,000 Active 106 DOM
-
2026-06-08days on market $139,000 Active 105 DOM
-
2026-06-07days on market $139,000 Active 104 DOM
-
2026-06-05days on market $139,000 Active 101 DOM
-
2026-06-02days on market $139,000 Active 99 DOM
-
2026-06-01days on market $139,000 Active 98 DOM
-
2026-05-31days on market $139,000 Active 97 DOM
-
2026-05-30days on market $139,000 Active 96 DOM
-
2026-05-20status Active
-
2026-03-25historical $1,600
-
2026-03-19status Pending
-
2026-03-19historical
-
2026-02-18$1,600
-
2025-12-23$139,000 Active
-
2025-11-20historical
-
2025-05-07price $139,900
-
2025-03-13price $145,900
-
2025-01-22price $149,900
-
2024-11-21$159,999 Active
-
2007-01-04soldstatus
ⓘ Source: listings_history table (triggers on properties + properties_extension) + one-shot
backfill from property_details.listing_events for pre-trigger history.
Tax reassessment forecast TX · Resets to sale price
- Current annual tax
- $1,364 · $114/mo
- Projected year-2 tax
- $2,544 · $212/mo
- Expected delta
- +$1,179/yr (+$98/mo · 86.5%)
ⓘ Screening estimate from a state-policy table — verify with the county assessor before closing.
Climate risk First Street
- Flood 1/10 Low 0% chance over 30 yrs
- Wildfire 2/10 Low
- Heat 8/10 Severe 7 d/yr ≥111°F today · 24 d/yr by 30 yrs out
- Wind 8/10 Severe 98% chance of damaging wind over 30 yrs
- Air quality 1/10 Low 0 unhealthy d/yr today · 0 by 30 yrs out
Nearby sold comps map
Loading sold comps map…
Walkable amenities ~0.75 mi
Loading nearby amenities…
Taxation est. · year 1
- Rental income
- $15,972
- − Mortgage interest
- −$7,786
- − Property taxes
- −$1,364
- − Insurance
- −$695
- − Repairs & maintenance
- −$1,278
- − Management
- −$1,278
- − Depreciation
- −$4,044
- Taxable loss
- −$472
- Est. tax savings @ 24.0%
- +$113
- After-tax cash flow
- $1,925/yr
For passive investors: Depreciation is non-cash, so a rental often shows a tax loss while cash-flowing — sheltering income. Rental losses are passive: they offset passive income freely, and up to $25,000/yr can offset ordinary (W-2) income if you actively participate and your MAGI is under $100k (phasing out to $0 by $150k); unused losses carry forward. On sale, claimed depreciation is recaptured at up to 25%, and gains may owe capital-gains tax (a 1031 exchange can defer both). Figures are a year-1 estimate at your 24.0% rate — not tax advice; consult a CPA.
Schools (NCES district)
- District
- Trinity ISD
- NCES district ID
- 4843200
- Math proficiency
- 27% ▼ -2.00%
- Reading proficiency
- 29% ▲ 1.00%
- Median HH income
- $37,104
- Composite
- 23.31/100
- National rank
- #7919
- State rank
- #682 of 826 in TX
Livability — Westwood Shores
- Score
- 62/100
- State rank
- #914
- US rank
- #16347
Category grades
Schools grade is shown separately in the Schools card above.
Census & demographics
- Population (ZIP)
- 10,030
Population outlook (Trinity County) Hauer SSP2
- Today (2025)
- 13,746 people
- By 2030
- 13,333 · -3.0%
- By 2040
- 12,542 · -8.8%
- By 2050
- 11,942 · -13.1%
- By 2075
- 10,871 · -20.9%
- By 2100
- 9,784 · -28.8%
Race, ethnicity, and origin ACS 2023
- Neighborhood character
- Predominantly White (74%)
- Race & ethnicity
- White 74% Hispanic / Latino 12% Black 10% Two or more races 7%
- Hispanic origin (detail)
- Mexican 11%
- Common ancestry
- Lithuanian 3% Serbian 2% Slovak 2%
- Foreign-born
- 4% · Canada
- Languages at home
- 89% English-only · Spanish 9% French/Haitian/Cajun 2%
Political lean MEDSL · Trinity
- 2024 margin
- Solid R (+67.0) · D 16.2% · R 83.2%
- 2008→2024 swing
- -31.3pp toward R · 2008: -35.7pp · 2024: -67.0pp
- All cycles
- 2024: R+67.0 2020: R+61.3 2016: R+59.9 2012: R+46.9 2008: R+35.7
Not yet ingested
- Civics
- —
Market trends
- HPI YoY
- ▼ -0.52%
- Current HPI
- 174.6638
- Rent YoY
- —
- Metro
- —
- State GDP YoY
- ▲ 3.95%
- F500 in state
- 110
Industry mix (Fortune 500 HQ in TX)
| Industry | F500 HQs | Revenue |
|---|---|---|
| Energy | 16 | $1,198B |
|
||
| Technology | 5 | $198B |
|
||
| Engineering / Construction | 4 | $72B |
|
||
| Energy Services | 3 | $60B |
|
||
| Utilities | 3 | $41B |
|
||
| Healthcare | 2 | $330B |
|
||
Price history
-99.0% since first listed12 events — show timeline
- 2026-05-20 Relisted — HARMLS
- 2026-03-25 Rental Removed $1,600 HARMLS
- 2026-03-19 Pending — HARMLS
- 2026-03-19 Listing Removed — HARMLS
- 2026-02-18 Listed for Rent $1,600 HARMLS
- 2025-12-23 Listed $139,000 HARMLS
- 2025-11-20 Listing Removed — HARMLS
- 2025-05-07 Price Changed $139,900 HARMLS
- 2025-03-13 Price Changed $145,900 HARMLS
- 2025-01-22 Price Changed $149,900 HARMLS
- 2024-11-21 Listed $159,999 HARMLS
- 2007-01-04 Sold (Public Records) — Public Records
Property tax history
+62.4%/yrLatest (2025): $1,364 · +7.2% YoY. Source: county tax records.
Cash-flow waterfall
monthlySold comps — $/sqft
last 12 mo · ≤1 miLoading sold comps…