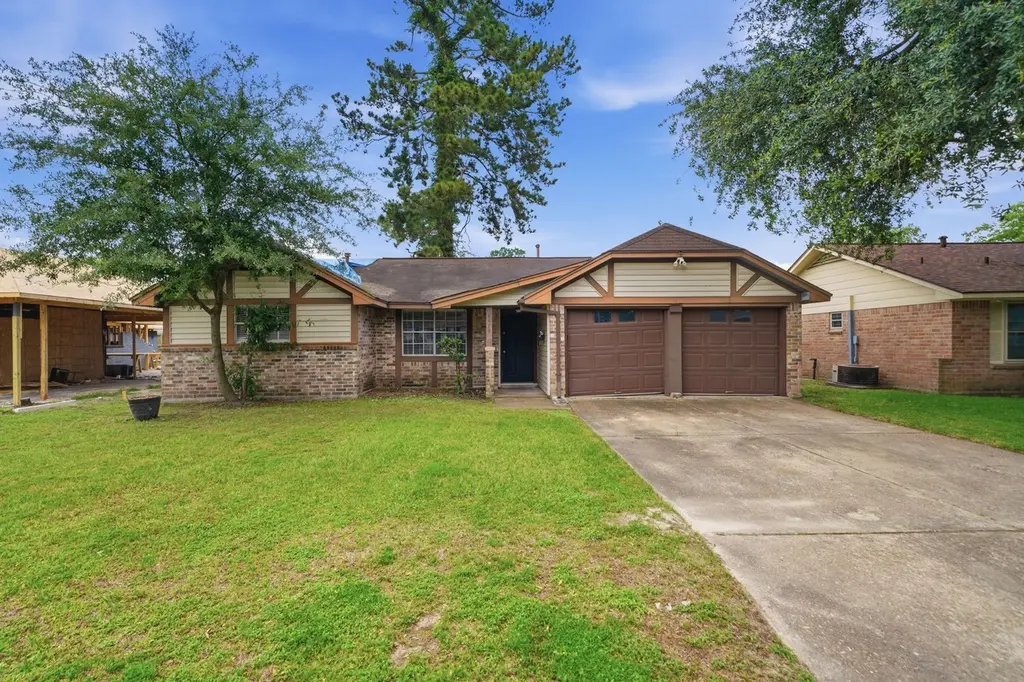
6410 Hopper Rd · Houston, TX
Flood risk 6/10 · Moderate
- FEMA flood zone
- X (shaded)
- Chance of flooding over 30 yrs
- 0.7%
- Est. flood insurance / yr
- $507 – $1,088
Fire risk 3/10 · Minor
- Est. fire insurance / yr
- $1,222 – $2,270
Heat risk 9/10 · Severe
- Hot days now (above 110°F)
- 7 days/yr
- Hot days in 30 yrs
- 24 days/yr
Wind risk 9/10 · Severe
- Chance of severe wind over 30 yrs
- 99.0%
Air-quality risk 3/10 · Minor
- Unhealthy air days now
- 3 days/yr
- Unhealthy air days in 30 yrs
- 3 days/yr
Risk factors via First Street. Map © Google.
Why this score? — see what drove the B+ grade
The composite is a weighted blend of 9 inputs, each scored 0–100. Each bar is that input's sub-score; the figure is the points it added to the 100-point composite (weight × sub-score).
- Cash flow +26.7/30.0
- ARV discount +15.0/15.0
- Appreciation +9.3/10.0
- DSCR +9.2/10.0
- 1% rule +8.1/10.0
- Livability +3.7/5.0
- Schools +2.7/10.0
- Rent growth +2.6/5.0
- Condition / age +2.5/5.0
$140,000
🖨 Deal sheet 📄 Offer letter ✓ Due diligence
Listing remarks MLS
HURRY THIS PROPERTY WILL NOT LAST LONG!!!! PERFECT FOR 1ST HOME OR INVESTORS!!! PROPERTY DID NOT FLOOD!!! 3 bedroom home located in the well established neighborhood of Northwood Manor. Brick home nestled in cozy subdivision near access to highway 59 ; 15 mins from downtown Houston. COME SEE AND FALL IN LOVE!!!! Needs a little TLC. Don't hesitate call today to schedule your showing.
Key facts
- Functional layout
- Outdoor space
- 6,298 sq ft lot
Tags
Property features AI
Finance
- Financial info: Lease considered: No
Exterior
- Parking: Attached garage; 2 garage spaces
- Utilities: Electric heating and cooling
- Home design: Residential property; Single-story (first-floor living areas)
- Construction: Wood siding exterior; Composition roof; Slab foundation; Built in 1967
- Exterior features: Lot approximately 6,300 sq ft (about 0.1446 acres); Lot features: Other
Interior
- Kitchen: Dishwasher; Gas range
- Bedrooms: Primary bedroom on the first floor (approx. 13x11); Second bedroom on the first floor (approx. 9x9); Third bedroom on the first floor (approx. 9x8)
- Bathrooms: One full bathroom; One half bathroom
- Heating & cooling: Central heating (electric); Central air conditioning (electric)
- Interior features: Dishwasher; Gas Range; Five total rooms (living room, kitchen, three bedrooms)
Neighborhood map
What this means for you Summary
Snapshot
- This is a 3-bed/1.5-bath single-family listed at $140k.
Deal economics
- At list price, monthly cash flow is $381 ($5k/yr) — positive.
- The deal already cash-flows at list — no discount required.
- Meets the 1% rule at list price ($2k rent vs $140k).
- Recommended offer: $138k (1.5% below list) — sets the bar for market timing.
- Cap rate 9.6% vs local median 3.2% in Houston — top-decile yield for the area; either an underpriced asset or a hidden risk that comps aren't pricing in. Stress-test before assuming the spread holds.
Location & tenants
- Location reads 74/100 on livability (#184 in TX, #4,771 nationally) — a middle-class / working-renter tenant base. Strengths: amenities A+, cost of living A+, housing A+; Watch: crime F.
- Houston ISD (urban): math 27% / reading 35% proficiency, ranked #593 of 826 in TX (top 72%) — families likely to look elsewhere, expect single-tenant / working-renter base with shorter leases; 71% free/reduced lunch — lower-income household profile, screen leases tightly.
- Zoned schools: Forest Brook Middle (math 12% / reading 14%, grade F, #1,609 of 1,662 statewide, top 97%, 613 students, 98% FRL); North Forest H S (math 13% / reading 18%, grade F, #1,505 of 1,632 statewide, top 92%, 974 students, 97% FRL) — zoned schools average 98% FRL vs 71% district-wide (27 pts higher); higher-poverty schools than district average — tighter screening recommended.
- Zoned-school proficiency averages 14% at this address vs 31% district-wide (-17 pts) — the specific schools serving this property underperform the Houston ISD average; the district grade overstates school quality for this exact location.
- Market conditions: Rents flat; 372 active listings in the ZIP; 17 comparable units currently listed for rent nearby; rentals at typical pace (median 22d on market — plan ~3-4 weeks tenant-placement turnaround); 29,883 units permitted in Harris County in 2024 (8,621 in 5+ unit buildings).
Forward outlook
- In year one you build about $13k of equity ($968 loan paydown + $12k appreciation (8.7% local appreciation)).
- Harris County population projected at +47% by 2050 — long-run rental-demand tailwind backs the buy-and-hold thesis.
- At projected returns (8.7% appreciation + 0.4% rent growth), your $39k cash investment doubles in ~3 years — after that, you're playing with house money.
- By year 3, paydown + projected appreciation supports a ~$33k cash-out refi (75% LTV) — recoverable capital for the next deal without selling this one.
Negotiation context
- It's been on market 22 days — a 2% lower offer ($138k) is reasonable based on typical stale-listing flexibility.
- 2 sale attempts since 8y ago with the ask held roughly flat each time — persistent listings suggest the price (not the market) is what's stuck; bring a comps-based counter.
Risks & watch-outs
- Climate carrying-cost: major flood risk; severe wind risk, 99% chance of damaging wind over 30y; extreme-heat days projected 7→24/yr by 2055 (HVAC capex compounding) — expect insurance premiums to compound above CPI over the hold.
Questions for the listing agent
- Built in 1967 — when were the roof, HVAC, electrical panel, plumbing, and water heater last replaced?
- Is there a deadline driving the sale (1031 exchange, divorce, estate, relocation)? That informs how much negotiation room exists.
- Schools are D-rated, which usually means shorter tenancies and higher turnover. Who's the typical renter profile here, and what's been the actual vacancy rate?
- Crime grade is F in this area — have there been break-ins, vandalism, or insurance claims at this property in the last 3 years? What carrier currently insures it and at what premium?
- What's the average days-on-market for RENTAL listings here right now (not sales)? A rising rental-DOM trend means longer vacancies and softer asking-rent achievability than the comps imply.
- What's the recent tenant-quality profile in this submarket — average credit score on applications, eviction rate, late-payment / NSF rate, and stable-employment percentage? A property-management company in the area should have these aggregated.
- How much new for-sale + rental construction is in the pipeline within 1–3 miles? Heavy new supply typically softens prices + rents 12–24 months out; constrained supply supports both.
Investment metrics
- 1% rule
- 1.31% ✓
- Cap rate
- 9.56%
- Cash-on-cash
- 11.66%
- DSCR
- 1.52
- GRM
- 6.3
CMA / ARV
- ARV (median comp)
- $177,031
- List price
- $140,000
- Delta
- -20.92%
- Verdict
- UNDERPRICED
- Comps
- 20 within 1.0 mi
Show comp detail 12 sales within ~0.75 mi
| Address | Dist | Beds/Ba | Sqft | Sold | Price | $/sf | Match |
|---|---|---|---|---|---|---|---|
| 6302 Hanley Ln | 0.12mi | 3/2.0 | 1,440 (+5%) | 1mo | $189,999 | $132 | 84 |
| 6110 Guadalupe St | 0.38mi | 3/1.5 | 1,336 (-3%) | 1mo | $120,000 | $90 | 76 |
| 11151 Spottswood Dr | 0.25mi | 3/1.0 | 1,283 (-7%) | 1mo | $99,900 | $78 | 75 |
| 6611 Mohawk St | 0.22mi | 3/1.5 | 1,255 (-9%) | 6mo | $142,500 | $114 | 71 |
| 6702 Leedale St | 0.36mi | 3/2.0 | 1,458 (+6%) | 2mo | $139,900 | $96 | 70 |
| 6319 Hopper Rd | 0.07mi | 3/2.5 | 1,188 (-14%) | 1mo | $110,000 | $93 | 69 |
| 6130 Hartwick Rd | 0.45mi | 3/1.0 | 1,278 (-7%) | 5mo | $115,000 | $90 | 61 |
| 6330 Cobalt St | 0.45mi | 3/2.0 | 1,242 (-10%) | 1mo | $199,995 | $161 | 60 |
| 5930 Annunciation St | 0.57mi | 3/1.0 | 1,235 (-10%) | 0mo | $186,999 | $151 | 54 |
| 11011 Ledford Ln | 0.53mi | 3/1.5 | 1,203 (-13%) | 2mo | $170,000 | $141 | 53 |
| 6319 Annunciation St | 0.37mi | 4/2.0 (+1) | 1,214 (-12%) | 6mo | $205,000 | $169 | 51 |
| 11426 Lemond Dr | 0.56mi | 4/2.0 (+1) | 1,501 (+9%) | 6mo | $189,999 | $127 | 46 |
Match score weights: distance 35% · size 25% · config 20% · recency 20%. Top-matched comps best support the ARV.
Projected returns pro-forma
8.65% appreciation · 0.44% rent growth · sell at horizon
- IRR
- 29.0%
- Equity multiple
- 3.12×
- Total profit
- $83,261
- Equity at exit
- $112,598
- IRR
- 24.8%
- Equity multiple
- 6.50×
- Total profit
- $215,597
- Equity at exit
- $229,733
Cash invested: $39,200 (down + closing). Projections, not guarantees.
Landlord ↔ Tenant lean methodology
- Overall (STATE)
- 87 Strongly Landlord-Friendly
- State Texas
- 87 Strongly Landlord-Friendly · R+5
- County
- — inherits STATE
- City
- — inherits STATE
ZIP-level market 77016
- Home prices YoY
- 2.8%
- Rents YoY
- 0.4%
- Active inventory
- 372
- Price-to-rent
- 6.3×
Monthly cashflow live
- Estimated rent
- $1,838 high interval (Pro) →
- Mortgage (P&I)
- −$734
- Tax from tax record
- −$279 /mo · $3,343/yr
- Insurance
- −$58
- HOA
- −$0
- Vacancy / Maint / Mgmt
- −$386
- Net cashflow
- $381
Break-even live
UW: 25.0% down · 7.5% · 30yr · 1.5% tax · 5.0% vac · 8.0% maint · 8.0% mgmt
Financing live
Cash to close
- Down payment
- $35,000
- Closing costs
- $4,200
- Reserves months
- —
- Total cash needed
- —
Loan-product check · same deal, 3 products live
Conventional
25% down · 7.5% · 30yr
- Down + closing
- —
- Monthly P&I
- —
- Monthly cashflow
- —
- DSCR
- —
- Eligible?
- —
Personal DTI + credit; lowest rate.
DSCR
20% down · 8.5% · 30yr
- Down + closing
- —
- Monthly P&I
- —
- Monthly cashflow
- —
- DSCR
- —
- Eligible?
- —
No personal income docs; deal must DSCR.
Hard money
10% down · 12.0% · 12mo
- Down + closing
- —
- Monthly P&I
- —
- Monthly cashflow
- —
- DSCR
- —
- Eligible?
- —
Short-term bridge; refi at stabilization.
Rent comps 17 comps
| Address | Beds | Baths | Sqft | Rent | $/sqft | DOM | Units | Dist |
|---|---|---|---|---|---|---|---|---|
| 11235 Lemond Dr Houston, TX | 3.0 | 1.0 | 1368 | $1,450 | $1.06 | 22d | 1 | 0.27mi |
| 6823 Hanley Ln Houston, TX | 3.0 | 2.0 | 1303 | $1,610 | $1.24 | 5d | 1 | 0.43mi |
| 6822 Leedale St Houston, TX | 3.0 | 1.0 | 978 | $1,500 | $1.53 | 43d | 1 | 0.45mi |
| 10750 Nyla Spring St Houston, TX | 3.0 | 2.0 | 1500 | $1,975 | $1.32 | 19d | 1 | 0.61mi |
| 11435 Raincove Dr Unit A Houston, TX | 3.0 | 1.0 | 1000 | $1,345 | $1.34 | 4d | 1 | 0.61mi |
| 11610 Danford Ln Unit B Houston, TX | 3.0 | 2.0 | 1150 | $1,750 | $1.52 | 43d | 1 | 0.75mi |
| 7223 Valmont Dr Houston, TX | 4.0 | 2.0 | 1546 | $1,595 | $1.03 | 43d | 1 | 0.75mi |
| 7726 Spinet St Houston, TX | 4.0 | 2.0 | 1456 | $2,375 | $1.63 | 7d | 1 | 0.99mi |
| 7314 Saunders Rd Houston, TX | 4.0 | 2.0 | 1339 | $1,723 | $1.29 | 14d | 1 | 1.01mi |
| 8003 Alpine Bearberry Dr Houston, TX | 3.0–4.0 | 2.0–2.5 | 1696 | $2,000 | $1.18 | 7d | 1 | 1.06mi |
| 10708 Lavender Cotton Ln Houston, TX | 3.0 | 2.0 | 1406 | $2,150 | $1.53 | 43d | 1 | 1.07mi |
| 10474 Red Orchid Dr Houston, TX | 3.0 | 2.5 | 1553 | $1,875 | $1.21 | 24d | 1 | 1.18mi |
| 7325 Boggess Rd Houston, TX | 3.0 | 2.0 | 1568 | $1,850 | $1.18 | 17d | 1 | 1.22mi |
| 7325 Boggess Rd Houston, TX | 3.0 | 2.0 | 1568 | $1,850 | $1.18 | 43d | 1 | 1.22mi |
| 10314 Woodwick St Unit 1283919P Houston, TX | 3.0 | 2.5 | 1496 | $3,782 | $2.53 | 7d | 1 | 1.22mi |
| 10221 Bretton Dr Houston, TX | 3.0 | 1.0 | 1350 | $1,700 | $1.26 | 24d | 1 | 1.43mi |
| 7252 Parker Rd Houston, TX | 3.0 | 1.0 | 916 | $1,650 | $1.80 | 43d | 1 | 1.44mi |
Listing history 13 events
-
2026-06-07days on market $140,000 Pending 22 DOM
-
2026-06-04days on market $140,000 Pending 21 DOM
-
2026-06-02status $140,000 Pending 18 DOM
-
2026-06-01days on market $140,000 Active 18 DOM
-
2026-05-31days on market $140,000 Active 17 DOM
-
2026-05-14$140,000 Active 574-char remark
-
2018-04-20soldstatus
-
2018-04-17soldstatus Sold 385-char remark
Show marketing remark (385 chars)
HURRY THIS PROPERTY WILL NOT LAST LONG!!!! PERFECT FOR 1ST HOME OR INVESTORS!!! PROPERTY DID NOT FLOOD!!! 3 bedroom home located in the well established neighborhood of Northwood Manor. Brick home nestled in cozy subdivision near access to highway 59 ; 15 mins from downtown Houston. COME SEE AND FALL IN LOVE!!!! Needs a little TLC. Don't hesitate call today to schedule your showing.
-
2018-04-08status Pending 385-char remark
Show marketing remark (385 chars)
HURRY THIS PROPERTY WILL NOT LAST LONG!!!! PERFECT FOR 1ST HOME OR INVESTORS!!! PROPERTY DID NOT FLOOD!!! 3 bedroom home located in the well established neighborhood of Northwood Manor. Brick home nestled in cozy subdivision near access to highway 59 ; 15 mins from downtown Houston. COME SEE AND FALL IN LOVE!!!! Needs a little TLC. Don't hesitate call today to schedule your showing.
-
2018-03-28status Option Pending 385-char remark
Show marketing remark (385 chars)
HURRY THIS PROPERTY WILL NOT LAST LONG!!!! PERFECT FOR 1ST HOME OR INVESTORS!!! PROPERTY DID NOT FLOOD!!! 3 bedroom home located in the well established neighborhood of Northwood Manor. Brick home nestled in cozy subdivision near access to highway 59 ; 15 mins from downtown Houston. COME SEE AND FALL IN LOVE!!!! Needs a little TLC. Don't hesitate call today to schedule your showing.
-
2018-03-19$110,000 Active 385-char remark
Show marketing remark (385 chars)
HURRY THIS PROPERTY WILL NOT LAST LONG!!!! PERFECT FOR 1ST HOME OR INVESTORS!!! PROPERTY DID NOT FLOOD!!! 3 bedroom home located in the well established neighborhood of Northwood Manor. Brick home nestled in cozy subdivision near access to highway 59 ; 15 mins from downtown Houston. COME SEE AND FALL IN LOVE!!!! Needs a little TLC. Don't hesitate call today to schedule your showing.
-
2015-10-19soldstatus
-
1988-01-02soldstatus
ⓘ Source: listings_history table (triggers on properties + properties_extension) + one-shot
backfill from property_details.listing_events for pre-trigger history.
Tax reassessment forecast TX · Resets to sale price
- Current annual tax
- $3,343 · $279/mo
- Projected year-2 tax
- $3,343 · $279/mo
- Expected delta
- $0/yr ($0/mo · 0.0%)
ⓘ Screening estimate from a state-policy table — verify with the county assessor before closing.
Climate risk First Street
- Flood 6/10 Major FEMA zone X (shaded) · 70% chance over 30 yrs
- Wildfire 3/10 Moderate
- Heat 9/10 Extreme 7 d/yr ≥110°F today · 24 d/yr by 30 yrs out
- Wind 9/10 Extreme 99% chance of damaging wind over 30 yrs
- Air quality 3/10 Moderate 3 unhealthy d/yr today · 3 by 30 yrs out
Nearby sold comps map
Loading sold comps map…
Walkable amenities ~0.75 mi
Loading nearby amenities…
Taxation est. · year 1
- Rental income
- $22,053
- − Mortgage interest
- −$7,842
- − Property taxes
- −$3,343
- − Insurance
- −$700
- − Repairs & maintenance
- −$1,764
- − Management
- −$1,764
- − Depreciation
- −$4,073
- Taxable income
- $2,567
- Est. tax owed @ 24.0%
- −$616
- After-tax cash flow
- $3,953/yr
For passive investors: Depreciation is non-cash, so a rental often shows a tax loss while cash-flowing — sheltering income. Rental losses are passive: they offset passive income freely, and up to $25,000/yr can offset ordinary (W-2) income if you actively participate and your MAGI is under $100k (phasing out to $0 by $150k); unused losses carry forward. On sale, claimed depreciation is recaptured at up to 25%, and gains may owe capital-gains tax (a 1031 exchange can defer both). Figures are a year-1 estimate at your 24.0% rate — not tax advice; consult a CPA.
Schools (NCES district)
- District
- Houston ISD
- NCES district ID
- 4823640
- Math proficiency
- 27% ▼ -18.00%
- Reading proficiency
- 35% ▼ -6.00%
- Median HH income
- $46,054
- Composite
- 26.63/100
- National rank
- #7173
- State rank
- #593 of 826 in TX
Livability — Houston
- Score
- 74/100
- State rank
- #184
- US rank
- #4771
Category grades
Schools grade is shown separately in the Schools card above.
Census & demographics
- Census place
- Houston, TX
- County
- Harris County · 4,702,590 people
- City population
- 3,226,434
- Metro
- Houston-The Woodlands-Sugar Land, TX
- Population (ZIP)
- 29,841
- Household income
- $47,677
- Rent vs Own
- Severe rent burden
- 1297.0
Population outlook (Harris County) Hauer SSP2
- Today (2025)
- 5,571,493 people
- By 2030
- 6,089,821 · +9.3%
- By 2040
- 7,142,806 · +28.2%
- By 2050
- 8,185,864 · +46.9%
- By 2075
- 10,574,329 · +89.8%
- By 2100
- 12,109,958 · +117.4%
Race, ethnicity, and origin ACS 2023
- Neighborhood character
- Majority Black (56%)
- Race & ethnicity
- Black 56% Hispanic / Latino 42% Two or more races 28%
- Hispanic origin (detail)
- Mexican 34%
- Foreign-born
- 18% · Canada
- Languages at home
- 61% English-only · Spanish 37%
Political lean MEDSL · Harris
- 2024 margin
- Lean D (+5.5) · D 52.0% · R 46.4% · Other 1.6%
- 2008→2024 swing
- +3.9pp toward D · 2008: 1.6pp · 2024: 5.5pp
- All cycles
- 2024: D+5.5 2020: D+13.3 2016: D+12.4 2012: D+0.1 2008: D+1.6
Not yet ingested
- Civics
- —
Market trends
- HPI YoY
- ▲ 8.65%
- Current HPI
- 315.6765
- Rent YoY
- ▲ 0.44%
- Metro
- Houston-The Woodlands-Sugar Land, TX
- State GDP YoY
- ▲ 3.95%
- F500 in state
- 110
Industry mix (Fortune 500 HQ in TX)
| Industry | F500 HQs | Revenue |
|---|---|---|
| Energy | 16 | $1,198B |
|
||
| Technology | 5 | $198B |
|
||
| Engineering / Construction | 4 | $72B |
|
||
| Energy Services | 3 | $60B |
|
||
| Utilities | 3 | $41B |
|
||
| Healthcare | 2 | $330B |
|
||
Price history
+27.3% since first listed10 events — show timeline
- 2026-06-06 Pending — HARMLS
- 2026-06-01 Pending — HARMLS
- 2026-05-14 Listed $140,000 HARMLS
- 2018-04-20 Sold (Public Records) — Public Records
- 2018-04-17 Sold (MLS) — HARMLS
- 2018-04-08 Pending — HARMLS
- 2018-03-28 Pending — HARMLS
- 2018-03-19 Listed $110,000 HARMLS
- 2015-10-19 Sold (Public Records) — Public Records
- 1988-01-02 Sold (Public Records) — Public Records
Property tax history
+8.4%/yrLatest (2025): $3,343 · +21.9% YoY. Source: county tax records.
Cash-flow waterfall
monthlySold comps — $/sqft
last 12 mo · ≤1 miLoading sold comps…