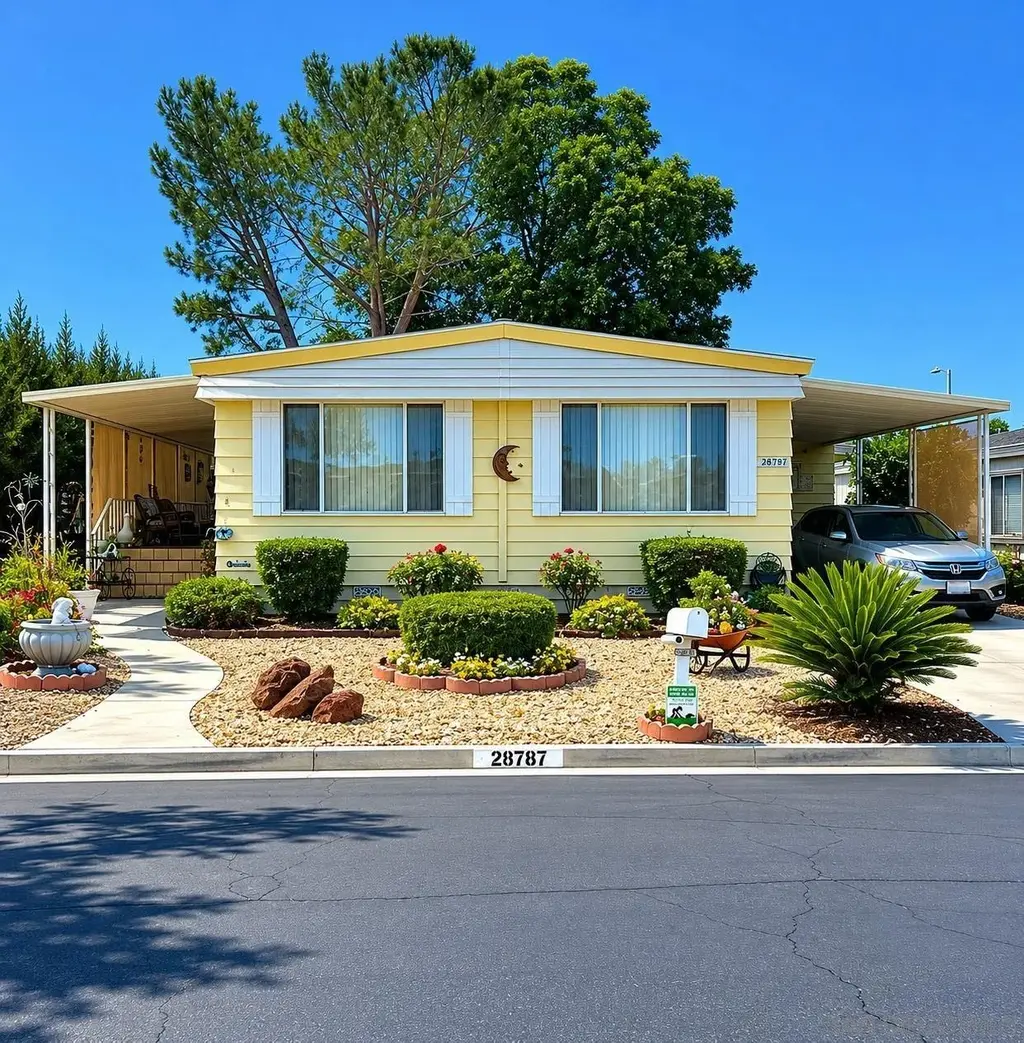
28787 Via Roja · Murrieta, CA
Flood risk 1/10 · Minimal
- FEMA flood zone
- X (unshaded)
- Chance of flooding over 30 yrs
- 0.0%
- Est. flood insurance / yr
- $507 – $1,088
Fire risk 6/10 · Moderate
- Est. fire insurance / yr
- $659 – $1,223
Heat risk 7/10 · Major
- Hot days now (above 103°F)
- 7 days/yr
- Hot days in 30 yrs
- 20 days/yr
Wind risk 1/10 · Minimal
- Chance of severe wind over 30 yrs
- —
Air-quality risk 5/10 · Moderate
- Unhealthy air days now
- 7 days/yr
- Unhealthy air days in 30 yrs
- 8 days/yr
Risk factors via First Street. Map © Google.
Why this score? — see what drove the B- grade
The composite is a weighted blend of 9 inputs, each scored 0–100. Each bar is that input's sub-score; the figure is the points it added to the 100-point composite (weight × sub-score).
- Cash flow +23.2/30.0
- ARV discount +15.0/15.0
- DSCR +7.5/10.0
- 1% rule +5.6/10.0
- Schools +5.3/10.0
- Livability +3.4/5.0
- Rent growth +2.8/5.0
- Condition / age +2.5/5.0
- Appreciation +0.0/10.0
$269,900
🖨 Deal sheet (PDF) 📄 Offer letter ✓ Due diligence
Listing remarks
Welcome to the desirable 55+ community of Spring Knolls in Murrieta! Located at 28787 Via Roja, this well-maintained manufactured home offers approximately 1,440 sq ft of comfortable living space with a spacious layout, abundant natural light, and plenty of potential to make it your own. MH on Permanent Foundation. OWN-THE-LAND Enjoy the benefits of active adult living with nearby shopping, dining, golf courses, medical facilities, wineries, and convenient freeway access all just minutes away. Spring Knolls is known for its welcoming atmosphere, community amenities, and prime Murrieta location. Whether you’re looking to downsize, invest, or enjoy a low-maintenance lifestyle, this is
Key facts
- 4,356 sq ft lot
- 2 parking spots
- Community pool
Property features AI
Finance
- HOA & community: Homeowners association (annual fee); Association fee $1,044 annually (about $87/month); Senior community; Community name: Spring Knolls
Exterior
- Parking: 2 parking spaces
- Utilities: Public water; Sewer connected
- Home design: Manufactured home; Single-story
- Construction: Composition roof
- Exterior features: Partial fencing; Community pool
Interior
- Kitchen: Built-in range; Disposal
- Bedrooms: Up to 2 bedrooms
- Bathrooms: 2 full bathrooms
- Heating & cooling: Central air conditioning; Forced air heating (natural gas)
- Interior features: Disposal; Built-in range; Central air; Forced air heating (natural gas)
Neighborhood map
What this means for you Summary
Snapshot
- This is a 2-bed/2.0-bath manufactured listed at $270k.
Deal economics
- At list price, monthly cash flow is $491 ($6k/yr) — positive.
- The deal already cash-flows at list — no discount required.
- Meets the 1% rule at list price ($3k rent vs $270k).
- Recommended offer: $266k (1.5% below list) — sets the bar for market timing.
- Cap rate 8.5% vs local median 3.0% in Murrieta — top-decile yield for the area; either an underpriced asset or a hidden risk that comps aren't pricing in. Stress-test before assuming the spread holds.
Location & tenants
- Location reads 68/100 on livability (#279 in CA) — a middle-class / working-renter tenant base. Strengths: amenities A+, employment A+, housing A+; Watch: health & safety D+, commute F, cost of living F.
- Murrieta Valley Unified (suburban): math 51% / reading 64% proficiency, ranked #255 of 1,400 in CA (top 18%) — acceptable for families but not a draw, mixed tenant base, ~2y average lease.
- Market conditions: Rents rising (+1.0%/yr); 242 active listings in the ZIP; 31 comparable units currently listed for rent nearby; rentals at typical pace (median 16d on market — plan ~3-4 weeks tenant-placement turnaround); high-income renter base; 9,195 units permitted in Riverside County in 2024 (1,512 in 5+ unit buildings).
Forward outlook
- Local home prices are declining (-3.0%/yr); year-one equity from $2k of loan paydown is wiped out by about $8k of value loss. Plan a longer hold.
- Riverside County population projected at +22% by 2050 — long-run rental-demand tailwind backs the buy-and-hold thesis.
Negotiation context
- It's been on market 21 days — a 2% lower offer ($266k) is reasonable based on typical stale-listing flexibility.
- Current owner paid $122k; list at $270k implies a 121% gain — meaningful room to come down on a strong offer.
Risks & watch-outs
- Climate carrying-cost: major wildfire risk; extreme-heat days projected 7→20/yr by 2055 (HVAC capex compounding) — expect insurance premiums to compound above CPI over the hold.
Questions for the listing agent
- Built in 1972 — when were the roof, HVAC, electrical panel, plumbing, and water heater last replaced?
- What does the HOA fee cover, when was the last increase, and are there any pending special assessments or reserve-fund shortfalls?
- Is there a deadline driving the sale (1031 exchange, divorce, estate, relocation)? That informs how much negotiation room exists.
- Schools are B-rated — typically a magnet for longer-tenancy family renters. What's the average tenant stay here, and is there a school-zone premium baked into asking?
- What's the average days-on-market for RENTAL listings here right now (not sales)? A rising rental-DOM trend means longer vacancies and softer asking-rent achievability than the comps imply.
- What's the recent tenant-quality profile in this submarket — average credit score on applications, eviction rate, late-payment / NSF rate, and stable-employment percentage? A property-management company in the area should have these aggregated.
- How much new for-sale + rental construction is in the pipeline within 1–3 miles? Heavy new supply typically softens prices + rents 12–24 months out; constrained supply supports both.
Investment metrics
- 1% rule
- 1.06% ✓
- Cap rate
- 8.48%
- Cash-on-cash
- 7.80%
- DSCR
- 1.35
- GRM
- 7.8
CMA / ARV
- ARV (on-the-fly)
- $362,880
- Comps found
- 12
Show comp detail 12 sales within ~0.75 mi
| Address | Dist | Beds/Ba | Sqft | Sold | Price | $/sf | Match |
|---|---|---|---|---|---|---|---|
| 38212 Via La Colina | 0.39mi | 2/2.0 | 1,440 (0%) | 1mo | $345,000 | $240 | 81 |
| 38619 Calle De La Siesta | 0.10mi | 3/2.0 (+1) | 1,344 (-7%) | 3mo | $390,000 | $290 | 77 |
| 38171 Via La Colina | 0.42mi | 2/2.0 | 1,392 (-3%) | 0mo | $138,000 | $99 | 74 |
| 28925 Calle Alta | 0.52mi | 2/2.0 | 1,440 (0%) | 2mo | $255,550 | $177 | 74 |
| 38195 Via Taffia | 0.33mi | 2/2.0 | 1,368 (-5%) | 2mo | $345,000 | $252 | 74 |
| 29115 Via Princesa | 0.21mi | 3/2.0 (+1) | 1,512 (+5%) | 5mo | $499,900 | $331 | 73 |
| 28698 Via Princesa | 0.16mi | 3/2.0 (+1) | 1,296 (-10%) | 2mo | $278,215 | $215 | 70 |
| 38190 Camino Cinife | 0.51mi | 2/2.0 | 1,512 (+5%) | 2mo | $500,000 | $331 | 66 |
| 38069 Calle De Amor | 0.52mi | 2/2.0 | 1,560 (+8%) | 3mo | $205,000 | $131 | 59 |
| 37967 Via La Colina | 0.61mi | 3/2.0 (+1) | 1,512 (+5%) | 0mo | $439,250 | $291 | 58 |
| 38240 Calle Arrebol | 0.35mi | 2/2.0 | 1,632 (+13%) | 4mo | $292,700 | $179 | 58 |
| 38070 Via La Colina | 0.53mi | 3/2.0 (+1) | 1,232 (-14%) | 5mo | $379,900 | $308 | 42 |
Match score weights: distance 35% · size 25% · config 20% · recency 20%. Top-matched comps best support the ARV.
Projected returns pro-forma
-3.0% appreciation · 1.01% rent growth · sell at horizon
- IRR
- -6.6%
- Equity multiple
- 0.76×
- Total profit
- $-18,109
- Equity at exit
- $40,243
- IRR
- 0.5%
- Equity multiple
- 1.03×
- Total profit
- $2,224
- Equity at exit
- $23,336
Cash invested: $75,572 (down + closing). Projections, not guarantees.
Landlord ↔ Tenant lean methodology
- Overall (STATE)
- 18 Strongly Tenant-Friendly
- State California
- 18 Strongly Tenant-Friendly · D+13
- County
- — inherits STATE
- City
- — inherits STATE
ZIP-level market 92563
- Home prices YoY
- -17.8%
- Rents YoY
- 1.0%
- Active inventory
- 242
- Price-to-rent
- 7.8×
Monthly cashflow live
- Estimated rent
- $2,873 high interval (Pro) →
- Mortgage (P&I)
- −$1,415
- Tax from tax record
- −$164 /mo · $1,969/yr
- Insurance
- −$112
- HOA
- −$87
- Vacancy / Maint / Mgmt
- −$603
- Net cashflow
- $491
Break-even live
Sensitivity live
| Price | -10% $644 | -5% $567 | +0% $491 | +5% $415 | +10% $338 |
|---|---|---|---|---|---|
| Rent | -10% $264 | -5% $378 | +0% $491 | +5% $605 | +10% $718 |
| Rate | -1.0pp $627 | -0.5pp $560 | base $491 | +0.5pp $421 | +1.0pp $350 |
UW: 25.0% down · 7.5% · 30yr · 1.5% tax · 5.0% vac · 8.0% maint · 8.0% mgmt
Financing live
Cash to close
- Down payment
- $67,475
- Closing costs
- $8,097
- Reserves months
- —
- Total cash needed
- —
Loan-product check · same deal, 3 products live
Conventional
25% down · 7.5% · 30yr
- Down + closing
- —
- Monthly P&I
- —
- Monthly cashflow
- —
- DSCR
- —
- Eligible?
- —
Personal DTI + credit; lowest rate.
DSCR
20% down · 8.5% · 30yr
- Down + closing
- —
- Monthly P&I
- —
- Monthly cashflow
- —
- DSCR
- —
- Eligible?
- —
No personal income docs; deal must DSCR.
Hard money
10% down · 12.0% · 12mo
- Down + closing
- —
- Monthly P&I
- —
- Monthly cashflow
- —
- DSCR
- —
- Eligible?
- —
Short-term bridge; refi at stabilization.
Rent comps 31 comps
| Address | Beds | Baths | Sqft | Rent | $/sqft | DOM | Units | Dist |
|---|---|---|---|---|---|---|---|---|
| 39656 Columbia Union Dr Unit C Murrieta, CA | 3.0 | 2.0 | 1408 | $2,925 | $2.08 | 25d | 1 | 0.40mi |
| 39668 Princeton Way Unit C Murrieta, CA | 3.0 | 2.0 | 1408 | $2,900 | $2.06 | 5d | 1 | 0.44mi |
| 28221 Via Princesa Unit 4 Murrieta, CA | 2.0 | 2.0 | 1000 | $1,950 | $1.95 | 44d | 1 | 0.49mi |
| 26137 Oakcreek Union Dr Unit C Murrieta, CA | 3.0 | 2.0 | 1408 | $2,950 | $2.10 | 0d | 1 | 0.55mi |
| 39484 Via Montalvo Murrieta, CA | 3.0 | 2.5 | 1808 | $6,500 | $3.60 | 44d | 1 | 0.56mi |
| 26133 Williams Way Murrieta, CA | 3.0 | 2.0 | 1408 | $3,100 | $2.20 | 44d | 1 | 0.59mi |
| 28611 Calle del Lago Murrieta, CA | 2.0 | 2.0 | 900 | $1,975 | $2.19 | 25d | 1 | 0.61mi |
| 28611 Calle Del Lago Unit c Murrieta, CA | 2.0 | 1.5 | 900 | $1,975 | $2.19 | 25d | 1 | 0.61mi |
| 39875 Alpine Union St Unit B Murrieta, CA | 3.0 | 2.5 | 1654 | $2,795 | $1.69 | 44d | 1 | 0.62mi |
| 29324 Calle Gaviota Murrieta, CA | 3.0 | 3.0 | 1854 | $3,150 | $1.70 | 44d | 1 | 0.65mi |
| 39930 Whitewood Rd Murrieta, CA | 2.0 | 2.0 | 1015 | $2,413 | $2.38 | 0d | 11 | 0.66mi |
| 39930 Alpine Union St Murrieta, CA | 3.0 | 2.5 | 1654 | $2,795 | $1.69 | 0d | 1 | 0.68mi |
| 38245 Murrieta Hot Springs Rd Murrieta, CA | 1.0–3.0 | 1.0–2.0 | 1020 | $2,828 | $2.77 | 0d | 24 | 0.96mi |
| 40213 Calle Real Unit 40213 Murrieta, CA | 3.0 | 2.5 | 1427 | $2,795 | $1.96 | 5d | 1 | 0.99mi |
| 26900 Winchester Creek Ave Murrieta, CA | 1.0–3.0 | 1.0–2.0 | 1315 | $2,510 | $1.91 | 44d | 1 | 0.99mi |
| 29677 Woodlands Ave Murrieta, CA | 3.0 | 2.0 | 1143 | $2,700 | $2.36 | 25d | 1 | 1.06mi |
| 39261 Delhaven St Murrieta, CA | 1.0–3.0 | 1.0–2.0 | 859 | $2,694 | $3.14 | 0d | 18 | 1.07mi |
| 25295 Shadescale Dr Murrieta, CA | 3.0 | 2.0 | 1368 | $2,950 | $2.16 | 25d | 1 | 1.09mi |
| 40319 Calle Real Murrieta, CA | 3.0 | 2.5 | 1427 | $2,900 | $2.03 | 25d | 1 | 1.14mi |
| 40324 Calle Real Murrieta, CA | 2.0 | 2.5 | 1336 | $2,495 | $1.87 | 5d | 1 | 1.14mi |
| 40358 Calle Real Murrieta, CA | 3.0 | 3.0 | 1427 | $2,795 | $1.96 | 44d | 1 | 1.16mi |
| 39585 Oak Cliff Dr Temecula, CA | 3.0 | 2.0 | 1052 | $3,100 | $2.95 | 0d | 1 | 1.19mi |
| 40419 Calle Real Murrieta, CA | 3.0 | 2.5 | 1427 | $2,750 | $1.93 | 5d | 1 | 1.23mi |
| 40444 Calle Real Murrieta, CA | 3.0 | 2.5 | 1574 | $3,000 | $1.91 | 44d | 1 | 1.23mi |
| 26314 Arboretum Way #3805 Murrieta, CA | 2.0 | 2.0 | 1031 | $2,295 | $2.23 | 0d | 1 | 1.39mi |
| 26426 Arboretum Way #804 Murrieta, CA | 2.0 | 2.0 | 890 | $2,295 | $2.58 | 44d | 1 | 1.40mi |
| 39824 Creative Dr Temecula, CA | 3.0 | 2.0 | 1458 | $2,980 | $2.04 | 15d | 1 | 1.43mi |
| 26313 Arboretum Way Murrieta, CA | 3.0 | 2.5 | 1372 | $2,495 | $1.82 | 5d | 1 | 1.43mi |
| 26396 Arboretum Way #2904 Murrieta, CA | 2.0 | 2.0 | 890 | $2,255 | $2.53 | 3d | 1 | 1.44mi |
| 40021 Spring Place Ct Temecula, CA | 3.0 | 2.5 | 1670 | $3,850 | $2.31 | 10d | 1 | 1.44mi |
| 26343 Arboretum Way #806 Murrieta, CA | 2.0 | 2.0 | 1031 | $2,300 | $2.23 | 0d | 1 | 1.47mi |
HOA detail
- Monthly dues
- $87 · $1,044/yr
Listing history 15 events
-
2026-06-18days on market $269,900 Active 21 DOM
-
2026-06-17days on market $269,900 Active 20 DOM
-
2026-06-16days on market $269,900 Active 19 DOM
-
2026-06-15days on market $269,900 Active 18 DOM
-
2026-06-13days on market $269,900 Active 16 DOM
-
2026-06-09days on market $269,900 Active 12 DOM
-
2026-06-08days on market $269,900 Active 11 DOM
-
2026-06-07days on market $269,900 Active 10 DOM
-
2026-06-04days on market $269,900 Active 8 DOM
-
2026-06-03days on market $269,900 Active 7 DOM
-
2026-06-02days on market $269,900 Active 6 DOM
-
2026-06-01days on market $269,900 Active 5 DOM
-
2026-05-31days on market $269,900 Active 4 DOM
-
2026-05-27$269,900 Active
-
2004-10-15soldstatus $122,000
ⓘ Source: listings_history table (triggers on properties + properties_extension) + one-shot
backfill from property_details.listing_events for pre-trigger history.
Tax reassessment forecast CA · Resets to sale price
- Current annual tax
- $1,969 · $164/mo
- Projected year-2 tax
- $2,051 · $171/mo
- Expected delta
- +$82/yr (+$7/mo · 4.2%)
ⓘ Screening estimate from a state-policy table — verify with the county assessor before closing.
Climate risk First Street
- Flood 1/10 Low FEMA zone X (unshaded) · 0% chance over 30 yrs
- Wildfire 6/10 Major
- Heat 7/10 Severe 7 d/yr ≥103°F today · 20 d/yr by 30 yrs out
- Wind 1/10 Low
- Air quality 5/10 Major 7 unhealthy d/yr today · 8 by 30 yrs out
Nearby sold comps map
Loading sold comps map…
Walkable amenities ~0.75 mi
Loading nearby amenities…
Taxation est. · year 1
- Rental income
- $34,482
- − Mortgage interest
- −$15,119
- − Property taxes
- −$1,969
- − Insurance
- −$1,350
- − Repairs & maintenance
- −$2,759
- − Management
- −$2,759
- − HOA
- −$1,044
- − Depreciation
- −$7,852
- Taxable income
- $1,632
- Est. tax owed @ 24.0%
- −$392
- After-tax cash flow
- $5,502/yr
For passive investors: Depreciation is non-cash, so a rental often shows a tax loss while cash-flowing — sheltering income. Rental losses are passive: they offset passive income freely, and up to $25,000/yr can offset ordinary (W-2) income if you actively participate and your MAGI is under $100k (phasing out to $0 by $150k); unused losses carry forward. On sale, claimed depreciation is recaptured at up to 25%, and gains may owe capital-gains tax (a 1031 exchange can defer both). Figures are a year-1 estimate at your 24.0% rate — not tax advice; consult a CPA.
Schools (NCES district)
- District
- Murrieta Valley Unified
- NCES district ID
- 0600029
- Math proficiency
- 51% ▲ 3.00%
- Reading proficiency
- 64% ▲ 4.00%
- Median HH income
- $78,615
- Composite
- 53.42/100
- National rank
- #3152
- State rank
- #255 of 1400 in CA
Livability — Murrieta
- Score
- 68/100
- State rank
- #279
- US rank
- #9348
Category grades
Schools grade is shown separately in the Schools card above.
Census & demographics
- Census place
- Murrieta, CA
- County
- Riverside County · 2,287,001 people
- City population
- 145,160
- Metro
- Riverside-San Bernardino-Ontario, CA
- Population (ZIP)
- 80,379
- Household income
- $125,397
- Rent vs Own
- Severe rent burden
- 1075.0
Population outlook (Riverside County) Hauer SSP2
- Today (2025)
- 2,664,475 people
- By 2030
- 2,802,692 · +5.2%
- By 2040
- 3,050,904 · +14.5%
- By 2050
- 3,256,783 · +22.2%
- By 2075
- 3,655,058 · +37.2%
- By 2100
- 3,766,594 · +41.4%
Race, ethnicity, and origin ACS 2023
- Neighborhood character
- Highly diverse neighborhood (Simpson 0.71)
- Race & ethnicity
- White 41% Hispanic / Latino 32% Two or more races 17% Asian 13% Black 6%
- Hispanic origin (detail)
- Mexican 25%
- Common ancestry
- Lithuanian 2% Slovak 2% Italian 2%
- Foreign-born
- 18% · Canada, Vietnam, South Korea
- Languages at home
- 71% English-only · Spanish 17% Tagalog/Filipino 5% Other Indo-European 2%
Political lean MEDSL · Riverside
- 2024 margin
- Toss-up / Even · D 48.0% · R 49.3% · Other 2.6%
- 2008→2024 swing
- -3.6pp toward R · 2008: 2.3pp · 2024: -1.3pp
- All cycles
- 2024: R+1.3 2020: D+8.0 2016: D+4.3 2012: R+0.4 2008: D+2.3
Not yet ingested
- Civics
- —
Market trends
- HPI YoY
- ▼ -73.79%
- Current HPI
- 341.728
- Rent YoY
- ▲ 1.01%
- Metro
- Riverside-San Bernardino-Ontario, CA
- State GDP YoY
- ▲ 3.21%
- F500 in state
- 116
Industry mix (Fortune 500 HQ in CA)
| Industry | F500 HQs | Revenue |
|---|---|---|
| Technology | 27 | $1,492B |
|
||
| Financial Services | 3 | $174B |
|
||
| Retail | 3 | $44B |
|
||
| Insurance | 3 | $26B |
|
||
| Media / Entertainment | 2 | $115B |
|
||
| Pharmaceuticals / Biotech | 2 | $62B |
|
||
Price history
+121.2% since first listed2 events — show timeline
- 2026-05-27 Listed $269,900 SDMLS
- 2004-10-15 Sold (Public Records) $122,000 Public Records
Property tax history
+1.5%/yrLatest (2025): $1,969 · +1.9% YoY. Source: county tax records.
Cash-flow waterfall
monthlySold comps — $/sqft
last 12 mo · ≤1 miLoading sold comps…