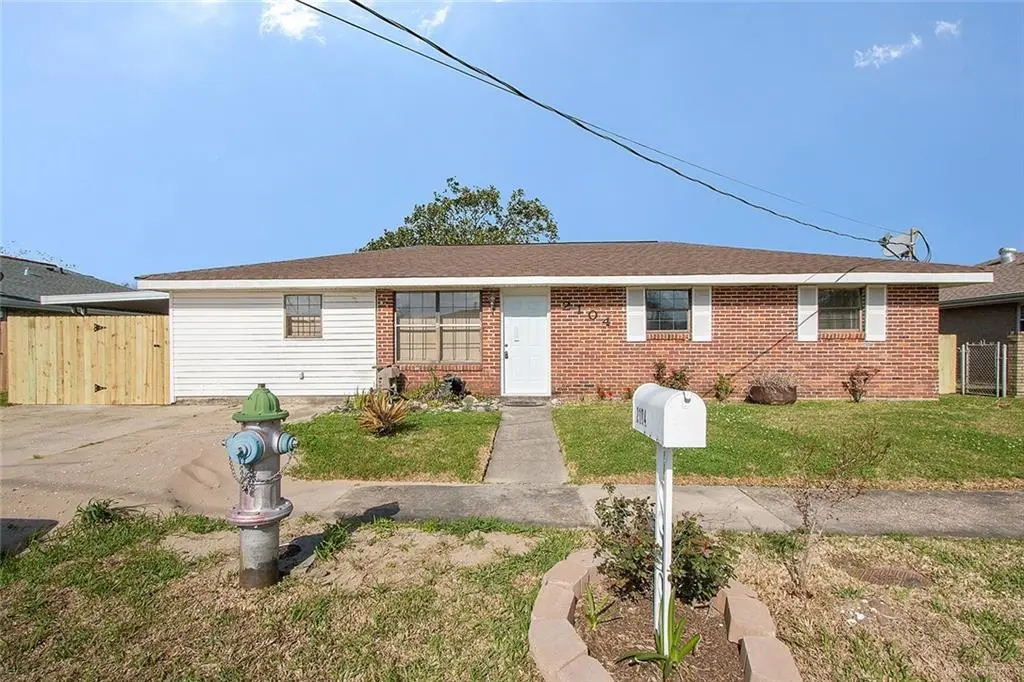
2104 Lena Dr · Chalmette, LA
Flood risk 7/10 · Major
- FEMA flood zone
- X (shaded)
- Chance of flooding over 30 yrs
- 0.6%
- Est. flood insurance / yr
- $507 – $1,088
Fire risk 1/10 · Minimal
- Est. fire insurance / yr
- $1,269 – $2,357
Heat risk 10/10 · Severe
- Hot days now (above 108°F)
- 7 days/yr
- Hot days in 30 yrs
- 21 days/yr
Wind risk 10/10 · Severe
- Chance of severe wind over 30 yrs
- 99.0%
Air-quality risk 2/10 · Minimal
- Unhealthy air days now
- 1 days/yr
- Unhealthy air days in 30 yrs
- 2 days/yr
Risk factors via First Street. Map © Google.
Why this score? — see what drove the C grade
The composite is a weighted blend of 9 inputs, each scored 0–100. Each bar is that input's sub-score; the figure is the points it added to the 100-point composite (weight × sub-score).
- Cash flow +19.3/30.0
- ARV discount +15.0/15.0
- DSCR +6.1/10.0
- Schools +5.0/10.0
- 1% rule +4.6/10.0
- Rent growth +3.3/5.0
- Livability +3.2/5.0
- Condition / age +2.5/5.0
- Appreciation +0.0/10.0
$179,900
🖨 Deal sheet (PDF) 📄 Offer letter ✓ Due diligence
Listing remarks MLS
Cute as a button, 3 bed, 1 bath home for sale located in Chalmette, LA. Features an open concept, bar area in living room, tile floors throughout, NO CARPET! Roof and gutters replaced in 2022. Features a detached shed, covered patio in the rear, on a fenced lot. Would make as a great starter home, downsize option, or investment rental property.
Key facts
- Tile floors
- Open concept
- Covered patio
Tags
Neighborhood map
What this means for you Summary
Snapshot
- This is a 3-bed/1.0-bath single-family listed at $180k.
Deal economics
- At list price, monthly cash flow is $130 ($2k/yr) — positive.
- The deal already cash-flows at list — no discount required.
- To meet the 1% rule (rent ≥ 1% of price), the offer needs to be $172k (4.4% below list).
- Recommended offer: $158k (12.0% below list) — sets the bar for market timing.
- Cap rate 7.6% vs local median 5.5% in Chalmette — top-decile yield for the area; either an underpriced asset or a hidden risk that comps aren't pricing in. Stress-test before assuming the spread holds.
Location & tenants
- Location reads 65/100 on livability (#137 in LA) — a middle-class / working-renter tenant base. Strengths: cost of living A+, housing A+, health & safety A; Watch: crime F, amenities F, commute F.
- Market conditions: Rents rising (+3.1%/yr); 209 active listings in the ZIP; 33 comparable units currently listed for rent nearby; rentals at typical pace (median 22d on market — plan ~3-4 weeks tenant-placement turnaround); 112 units permitted in St. Bernard Parish in 2024 (0 in 5+ unit buildings).
- This rent runs 37% of the median local income ($55k/yr) — at the standard rent-burdened threshold; future hikes will face affordability resistance.
Forward outlook
- Local home prices are declining (-3.0%/yr); year-one equity from $1k of loan paydown is wiped out by about $5k of value loss. Plan a longer hold.
- St. Bernard County population projected at +89% by 2050 — long-run rental-demand tailwind backs the buy-and-hold thesis.
Negotiation context
- It's been on market 136 days — a 12% lower offer ($158k) is reasonable based on typical stale-listing flexibility.
- 14 sale attempts since 8y ago with the ask held roughly flat each time — persistent listings suggest the price (not the market) is what's stuck; bring a comps-based counter.
- Current owner paid $120k; 50% above their basis — modest negotiation headroom, anchor on the comps not their cost.
Risks & watch-outs
- Watch-outs: flood insurance adds $66/mo.
- Climate carrying-cost: major flood risk; severe wind risk, 99% chance of damaging wind over 30y; extreme-heat days projected 7→21/yr by 2055 (HVAC capex compounding) — expect insurance premiums to compound above CPI over the hold.
Questions for the listing agent
- It's been on market 136 days. Have you received any prior offers? Is the seller open to a 12% concession, seller financing, or rate buy-down credit?
- What's the actual annual flood-insurance premium (NFIP or private), and is the property in a SFHA with mandatory coverage?
- Why hasn't it sold? Are there any deal-killer items the seller is aware of (foundation, flood, title, zoning, code violations)?
- Is there a deadline driving the sale (1031 exchange, divorce, estate, relocation)? That informs how much negotiation room exists.
- Crime grade is F in this area — have there been break-ins, vandalism, or insurance claims at this property in the last 3 years? What carrier currently insures it and at what premium?
- What's the average days-on-market for RENTAL listings here right now (not sales)? A rising rental-DOM trend means longer vacancies and softer asking-rent achievability than the comps imply.
- What's the recent tenant-quality profile in this submarket — average credit score on applications, eviction rate, late-payment / NSF rate, and stable-employment percentage? A property-management company in the area should have these aggregated.
- How much new for-sale + rental construction is in the pipeline within 1–3 miles? Heavy new supply typically softens prices + rents 12–24 months out; constrained supply supports both.
Investment metrics
- 1% rule
- 0.96% ✗
- Cap rate
- 7.60%
- Cash-on-cash
- 4.68%
- DSCR
- 1.21
- GRM
- 8.7
CMA / ARV
- ARV (median comp)
- $227,703
- List price
- $179,900
- Delta
- -20.99%
- Verdict
- UNDERPRICED
- Comps
- 20 within 1.0 mi
Show comp detail 12 sales within ~0.75 mi
| Address | Dist | Beds/Ba | Sqft | Sold | Price | $/sf | Match |
|---|---|---|---|---|---|---|---|
| 2028 Charles Dr | 0.22mi | 3/2.0 | 1,390 (+6%) | 11mo | $275,000 | $198 | 66 |
| 2320 Gallo Dr | 0.26mi | 3/1.5 | 1,205 (-8%) | 13mo | $185,000 | $154 | 62 |
| 2305 Pecan Dr | 0.38mi | 3/2.0 | 1,363 (+4%) | 12mo | $214,000 | $157 | 61 |
| 2901 Blanchard Dr | 0.62mi | 3/2.0 | 1,339 (+3%) | 3mo | $195,000 | $146 | 60 |
| 2101 Corinne Dr | 0.11mi | 3/1.0 | 1,490 (+14%) | 15mo | $121,800 | $82 | 59 |
| 2421 Pecan Dr | 0.42mi | 3/1.5 | 1,423 (+9%) | 8mo | $160,000 | $112 | 57 |
| 2120 Veronica Dr | 0.57mi | 3/2.0 | 1,274 (-2%) | 10mo | $165,000 | $130 | 57 |
| 2208 Munster Blvd | 0.74mi | 3/2.0 | 1,299 (-0%) | 6mo | $212,000 | $163 | 55 |
| 2312 Pecan Dr | 0.41mi | 4/2.0 (+1) | 1,353 (+4%) | 13mo | $235,000 | $174 | 55 |
| 2305 Veronica Dr | 0.54mi | 3/2.0 | 1,414 (+8%) | 10mo | $230,000 | $163 | 48 |
| 2309 Plaza Dr | 0.68mi | 2/1.0 (-1) | 1,162 (-11%) | 6mo | $152,900 | $132 | 40 |
| 2112 Munster Blvd | 0.71mi | 3/2.0 | 1,500 (+15%) | 10mo | $170,000 | $113 | 29 |
Match score weights: distance 35% · size 25% · config 20% · recency 20%. Top-matched comps best support the ARV.
Projected returns pro-forma
-3.0% appreciation · 3.11% rent growth · sell at horizon
- IRR
- -11.3%
- Equity multiple
- 0.59×
- Total profit
- $-20,665
- Equity at exit
- $26,824
- IRR
- -1.9%
- Equity multiple
- 0.87×
- Total profit
- $-6,480
- Equity at exit
- $15,554
Cash invested: $50,372 (down + closing). Projections, not guarantees.
Landlord ↔ Tenant lean methodology
- Overall (STATE)
- 90 Strongly Landlord-Friendly
- State Louisiana
- 90 Strongly Landlord-Friendly · R+12
- County
- — inherits STATE
- City
- — inherits STATE
ZIP-level market 70043
- Rents YoY
- 3.1%
- Active inventory
- 209
- Price-to-rent
- 8.7×
Monthly cashflow live
- Estimated rent
- $1,721 high interval (Pro) →
- Mortgage (P&I)
- −$943
- Tax from tax record
- −$144 /mo · $1,734/yr
- Insurance
- −$75
- Flood insurance flood zone
- −$66 /mo · $798/yr
- HOA
- −$0
- Vacancy / Maint / Mgmt
- −$361
- Net cashflow
- $130
Break-even live
Sensitivity live
| Price | -10% $232 | -5% $181 | +0% $130 | +5% $79 | +10% $28 |
|---|---|---|---|---|---|
| Rent | -10% $-6 | -5% $62 | +0% $130 | +5% $198 | +10% $266 |
| Rate | -1.0pp $221 | -0.5pp $176 | base $130 | +0.5pp $83 | +1.0pp $36 |
UW: 25.0% down · 7.5% · 30yr · 1.5% tax · 5.0% vac · 8.0% maint · 8.0% mgmt
Financing live
Cash to close
- Down payment
- $44,975
- Closing costs
- $5,397
- Reserves months
- —
- Total cash needed
- —
Loan-product check · same deal, 3 products live
Conventional
25% down · 7.5% · 30yr
- Down + closing
- —
- Monthly P&I
- —
- Monthly cashflow
- —
- DSCR
- —
- Eligible?
- —
Personal DTI + credit; lowest rate.
DSCR
20% down · 8.5% · 30yr
- Down + closing
- —
- Monthly P&I
- —
- Monthly cashflow
- —
- DSCR
- —
- Eligible?
- —
No personal income docs; deal must DSCR.
Hard money
10% down · 12.0% · 12mo
- Down + closing
- —
- Monthly P&I
- —
- Monthly cashflow
- —
- DSCR
- —
- Eligible?
- —
Short-term bridge; refi at stabilization.
Rent comps 33 comps
| Address | Beds | Baths | Sqft | Rent | $/sqft | DOM | Units | Dist |
|---|---|---|---|---|---|---|---|---|
| 2228 Riverland Dr Chalmette, LA | 3.0 | 1.0 | 1300 | $1,800 | $1.38 | 3d | 1 | 0.37mi |
| 2602 Chalona Dr Unit C Chalmette, LA | 2.0 | 1.5 | 900 | $1,200 | $1.33 | 3d | 1 | 0.45mi |
| 2708 Volpe Dr Chalmette, LA | 3.0 | 2.0 | 1556 | $2,300 | $1.48 | 22d | 1 | 0.53mi |
| 2431 Octavia Dr Chalmette, LA | 3.0 | 2.0 | 1100 | $1,499 | $1.36 | 44d | 1 | 0.61mi |
| 2429 Octavia Dr Chalmette, LA | 3.0 | 2.0 | 1700 | $1,575 | $0.93 | 24d | 1 | 0.61mi |
| 2319 Plaza Dr Chalmette, LA | 2.0 | 1.0 | 1000 | $1,200 | $1.20 | 4d | 1 | 0.68mi |
| 2337 Plaza Dr Chalmette, LA | 3.0 | 2.0 | 925 | $1,500 | $1.62 | 44d | 1 | 0.69mi |
| 3012 Volpe Dr Chalmette, LA | 3.0 | 2.0 | 1812 | $2,500 | $1.38 | 44d | 1 | 0.71mi |
| 2329 Lyndell Dr Chalmette, LA | 2.0 | 1.0 | 1265 | $1,400 | $1.11 | 44d | 1 | 0.74mi |
| 2518 Delambert St Chalmette, LA | 3.0 | 2.0 | 1617 | $1,825 | $1.13 | 44d | 1 | 0.94mi |
| 2029 W Beauregard St Chalmette, LA | 3.0 | 2.0 | 1176 | $2,200 | $1.87 | 17d | 1 | 0.97mi |
| 321 Rosemary Pl Chalmette, LA | 2.0 | 2.0 | 1000 | $1,550 | $1.55 | 2d | 1 | 0.97mi |
| 3321 Plaza Dr Chalmette, LA | 3.0 | 2.0 | 1400 | $1,650 | $1.18 | 11d | 1 | 1.02mi |
| 226 E Casa Calvo St Chalmette, LA | 3.0 | 2.0 | 1330 | $1,900 | $1.43 | 44d | 1 | 1.03mi |
| 203 E Moreau St Chalmette, LA | 3.0 | 1.5 | 965 | $1,700 | $1.76 | 4d | 1 | 1.06mi |
| 3209 Golden Dr Unit C Chalmette, LA | 2.0 | 1.5 | 950 | $1,200 | $1.26 | 16d | 1 | 1.07mi |
| 2709 Munster Blvd Meraux, LA | 3.0 | 2.0 | 1411 | $1,900 | $1.35 | 24d | 1 | 1.09mi |
| 3305 Golden Dr Unit D Chalmette, LA | 2.0 | 1.5 | 1100 | $1,200 | $1.09 | 16d | 1 | 1.13mi |
| 3629 Charles Dr Chalmette, LA | 3.0 | 2.0 | 1405 | $1,600 | $1.14 | 15d | 1 | 1.15mi |
| 3329 Golden Dr Unit A Chalmette, LA | 2.0 | 1.5 | 1200 | $1,200 | $1.00 | 44d | 1 | 1.17mi |
| 3106 Laplace St Chalmette, LA | 3.0 | 2.5 | 1390 | $1,650 | $1.19 | 44d | 1 | 1.17mi |
| 3108 Laplace St Chalmette, LA | 3.0 | 2.5 | 1390 | $1,650 | $1.19 | 44d | 1 | 1.19mi |
| 2107 Montesquieu St Chalmette, LA | 2.0 | 1.0 | 1150 | $1,199 | $1.04 | 22d | 1 | 1.21mi |
| 3708 Veronica Dr Chalmette, LA | 3.0 | 2.0 | 1818 | $2,550 | $1.40 | 2d | 1 | 1.24mi |
| 3108 Tournefort St Chalmette, LA | 3.0 | 2.0 | 1399 | $1,750 | $1.25 | 3d | 1 | 1.24mi |
| 3513 Golden Dr Chalmette, LA | 2.0 | 2.0 | 1000 | $1,200 | $1.20 | 44d | 1 | 1.27mi |
| 511 E Genie St Chalmette, LA | 3.0 | 2.0 | 1100 | $1,500 | $1.36 | 2d | 1 | 1.34mi |
| 2004 Webster St Meraux, LA | 3.0 | 2.0 | 1400 | $1,750 | $1.25 | 17d | 1 | 1.37mi |
| 3408 Bryson St New Orleans, LA | 3.0 | 2.0 | 1163 | $2,200 | $1.89 | 24d | 1 | 1.41mi |
| 3612 Laplace St Chalmette, LA | 2.0 | 1.5 | 1090 | $1,300 | $1.19 | 17d | 1 | 1.43mi |
| 3429 Bryson St New Orleans, LA | 3.0 | 2.0 | 1250 | $2,200 | $1.76 | 24d | 1 | 1.44mi |
| 406 Dubarry Pl Chalmette, LA | 3.0 | 2.0 | 950 | $1,550 | $1.63 | 44d | 1 | 1.47mi |
| 3400 Montesquieu St Unit 1-B Chalmette, LA | 3.0 | 2.5 | 1372 | $2,550 | $1.86 | 2d | 1 | 1.50mi |
Listing history 36 events
-
2026-06-18days on market $179,900 Active 136 DOM
-
2026-06-17days on market $179,900 Active 135 DOM
-
2026-06-16days on market $179,900 Active 134 DOM
-
2026-06-15days on market $179,900 Active 133 DOM
-
2026-06-13days on market $179,900 Active 131 DOM
-
2026-06-10days on market $179,900 Active 128 DOM
-
2026-06-09days on market $179,900 Active 127 DOM
-
2026-06-08days on market $179,900 Active 126 DOM
-
2026-06-07days on market $179,900 Active 125 DOM
-
2026-06-03days on market $179,900 Active 121 DOM
-
2026-06-02days on market $179,900 Active 120 DOM
-
2026-06-01days on market $179,900 Active 119 DOM
-
2026-05-31days on market $179,900 Active 118 DOM
-
2026-02-02$179,900 Active 346-char remark
Show marketing remark (346 chars)
Cute as a button, 3 bed, 1 bath home for sale located in Chalmette, LA. Features an open concept, bar area in living room, tile floors throughout, NO CARPET! Roof and gutters replaced in 2022. Features a detached shed, covered patio in the rear, on a fenced lot. Would make as a great starter home, downsize option, or investment rental property.
-
2025-07-21$179,900 Active
-
2025-01-19$179,900 Active
-
2024-07-19$179,900 Active
-
2024-05-16price $179,900
-
2024-01-31$179,900
-
2023-07-18$190,000
-
2022-12-02$190,000
-
2018-11-30soldstatus $120,000
-
2018-11-29soldstatus $120,000 Sold
-
2018-11-26historical Pending Continue to Show
-
2018-11-04status Active
-
2018-11-03historical Pending Continue to Show
-
2018-10-13status Active
-
2018-10-04historical Open Predication
-
2018-09-27$129,900 Active
-
2018-09-27$129,900
-
2018-07-31historical
-
2018-04-30price $124,900
-
2018-03-06$129,900 Active
-
2018-03-06$124,900
-
2002-12-11soldstatus $88,000
ⓘ Source: listings_history table (triggers on properties + properties_extension) + one-shot
backfill from property_details.listing_events for pre-trigger history.
Tax reassessment forecast LA · Resets to sale price
- Current annual tax
- $1,734 · $144/mo
- Projected year-2 tax
- $1,734 · $144/mo
- Expected delta
- $0/yr ($0/mo · 0.0%)
ⓘ Screening estimate from a state-policy table — verify with the county assessor before closing.
Climate risk First Street
- Flood 7/10 Severe FEMA zone X (shaded) · 60% chance over 30 yrs
- Wildfire 1/10 Low
- Heat 10/10 Extreme 7 d/yr ≥108°F today · 21 d/yr by 30 yrs out
- Wind 10/10 Extreme 99% chance of damaging wind over 30 yrs
- Air quality 2/10 Low 1 unhealthy d/yr today · 2 by 30 yrs out
Nearby sold comps map
Loading sold comps map…
Walkable amenities ~0.75 mi
Loading nearby amenities…
Taxation est. · year 1
- Rental income
- $20,648
- − Mortgage interest
- −$10,077
- − Property taxes
- −$1,734
- − Insurance
- −$1,697
- − Repairs & maintenance
- −$1,652
- − Management
- −$1,652
- − Depreciation
- −$5,233
- Taxable loss
- −$1,398
- Est. tax savings @ 24.0%
- +$335
- After-tax cash flow
- $1,895/yr
For passive investors: Depreciation is non-cash, so a rental often shows a tax loss while cash-flowing — sheltering income. Rental losses are passive: they offset passive income freely, and up to $25,000/yr can offset ordinary (W-2) income if you actively participate and your MAGI is under $100k (phasing out to $0 by $150k); unused losses carry forward. On sale, claimed depreciation is recaptured at up to 25%, and gains may owe capital-gains tax (a 1031 exchange can defer both). Figures are a year-1 estimate at your 24.0% rate — not tax advice; consult a CPA.
Schools (NCES district)
No district data.
Livability — Chalmette
- Score
- 65/100
- State rank
- #137
- US rank
- #12500
Category grades
Schools grade is shown separately in the Schools card above.
Census & demographics
- Census place
- Chalmette, LA
- County
- Saint Bernard Parish · 22,638 people
- City population
- 22,638
- Metro
- New Orleans-Metairie, LA
- Population (ZIP)
- 22,638
- Household income
- $55,068
- Rent vs Own
- Severe rent burden
- 881.0
Population outlook (St. Bernard County) Hauer SSP2
- Today (2025)
- 66,513 people
- By 2030
- 77,768 · +16.9%
- By 2040
- 101,296 · +52.3%
- By 2050
- 125,770 · +89.1%
- By 2075
- 188,160 · +182.9%
- By 2100
- 239,339 · +259.8%
Race, ethnicity, and origin ACS 2023
- Neighborhood character
- Diverse neighborhood (Simpson 0.61)
- Race & ethnicity
- White 55% Black 26% Hispanic / Latino 12% Two or more races 10% Asian 2%
- Hispanic origin (detail)
- Mexican 2%
- Common ancestry
- Lithuanian 13% Slovak 2%
- Foreign-born
- 6% · Canada, Vietnam
- Languages at home
- 88% English-only · Spanish 8% Arabic 1% Vietnamese 1%
Political lean MEDSL · St. Bernard
- 2024 margin
- Strong R (+29.3) · D 34.5% · R 63.8% · Other 1.7%
- 2008→2024 swing
- +16.1pp toward D · 2008: -45.4pp · 2024: -29.3pp
- All cycles
- 2024: R+29.3 2020: R+28.5 2016: R+33.4 2012: R+24.7 2008: R+45.4
Not yet ingested
- Civics
- —
Market trends
- HPI YoY
- ▼ -211.77%
- Current HPI
- 194.8123
- Rent YoY
- ▲ 3.11%
- Metro
- New Orleans-Metairie, LA
- State GDP YoY
- ▲ 3.29%
- F500 in state
- 10
Industry mix (Fortune 500 HQ in LA)
| Industry | F500 HQs | Revenue |
|---|---|---|
| Telecommunications | 2 | $23B |
|
||
| Utilities | 1 | $12B |
|
||
| Wholesale / Distribution | 1 | $5B |
|
||
| Advertising | 1 | $2B |
|
||
Price history
+104.4% since first listed23 events — show timeline
- 2026-02-02 Listed $179,900 AcadianaMLS
- 2026-02-02 Listed $179,900 GSREIN
- 2025-07-21 Listed $179,900 AcadianaMLS
- 2025-01-19 Listed $179,900 AcadianaMLS
- 2024-07-19 Listed $179,900 AcadianaMLS
- 2024-05-16 Price Changed $179,900 GSREIN
- 2024-01-31 Listed $179,900 AcadianaMLS
- 2023-07-18 Listed $190,000 AcadianaMLS
- 2022-12-02 Listed $190,000 AcadianaMLS
- 2018-11-30 Sold (Public Records) $120,000 Public Records
- 2018-11-29 Sold (MLS) $120,000 GSREIN
- 2018-11-26 Contingent — GSREIN
- 2018-11-04 Relisted — GSREIN
- 2018-11-03 Contingent — GSREIN
- 2018-10-13 Relisted — GSREIN
- 2018-10-04 Contingent — GSREIN
- 2018-09-27 Listed $129,900 AcadianaMLS
- 2018-09-27 Listed $129,900 GSREIN
- 2018-07-31 Listing Removed — GSREIN
- 2018-04-30 Price Changed $124,900 GSREIN
- 2018-03-06 Listed $124,900 AcadianaMLS
- 2018-03-06 Listed $129,900 GSREIN
- 2002-12-11 Sold (Public Records) $88,000 Public Records
Property tax history
+4.9%/yrLatest (2025): $1,734 · -0.7% YoY. Source: county tax records.
Cash-flow waterfall
monthlySold comps — $/sqft
last 12 mo · ≤1 miLoading sold comps…