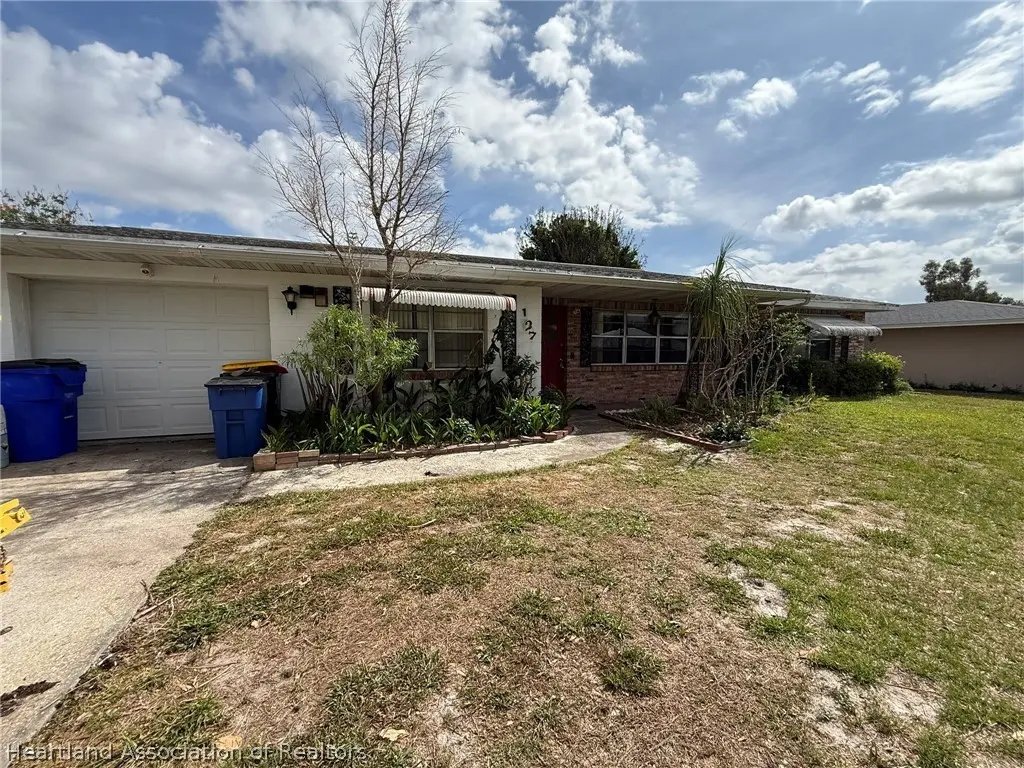
127 Lime Rd NW · Lake Placid, FL
Flood risk 1/10 · Minimal
- FEMA flood zone
- X (unshaded)
- Chance of flooding over 30 yrs
- 0.0%
- Est. flood insurance / yr
- $507 – $1,088
Fire risk 2/10 · Minimal
- Est. fire insurance / yr
- $947 – $1,759
Heat risk 9/10 · Severe
- Hot days now (above 108°F)
- 7 days/yr
- Hot days in 30 yrs
- 26 days/yr
Wind risk 9/10 · Severe
- Chance of severe wind over 30 yrs
- 99.0%
Air-quality risk 2/10 · Minimal
- Unhealthy air days now
- 1 days/yr
- Unhealthy air days in 30 yrs
- 2 days/yr
Risk factors via First Street. Map © Google.
Why this score? — see what drove the C- grade
The composite is a weighted blend of 9 inputs, each scored 0–100. Each bar is that input's sub-score; the figure is the points it added to the 100-point composite (weight × sub-score).
- Cash flow +21.1/30.0
- ARV discount +7.5/15.0
- DSCR +6.7/10.0
- 1% rule +4.5/10.0
- Schools +3.6/10.0
- Livability +3.4/5.0
- Rent growth +2.7/5.0
- Condition / age +2.5/5.0
- Appreciation +0.0/10.0
$180,000
🖨 Deal sheet 📄 Offer letter ✓ Due diligence
Listing remarks
Looking for your next investment opportunity or a place to call home in one of Florida’s hidden gems? This 3-bedroom, 2-bath home with a 1-car garage is located in the highly sought-after Placid Lakes Community and it’s priced to move with a motivated seller! Why Placid Lakes? This neighborhood offers more than just a home—it delivers a lifestyle: Access to Lake June, one of the area’s most popular lakes for boating & fishing Quiet, well-established community with a laid-back Florida feel Convenient access to Lake Placid and nearby Sebring for shopping, dining, and entertainment Property Highlights: 3 Bedrooms | 2 Bathrooms 1-Car Garage Solid layou
Key facts
- 0.23 acre lot
- Garage
- Built 1972
Property features AI
Finance
- HOA & community: Homeowners association with an annual fee of $25
Exterior
- Parking: 1-car garage
- Utilities: Public water; Septic tank sewer
- Home design: Single-family residence; One level
- Construction: Block, concrete and stucco construction; Shingle roof
- Exterior features: Front porch; Rear porch; Screened porch; Paved road frontage; Frontage approximately 80 feet; Zoned R1A
Interior
- Flooring: Carpet; Vinyl
- Bathrooms: Two full bathrooms
- Heating & cooling: Central heating (electric); Central air conditioning (electric)
- Interior features: Carpet and vinyl flooring; Two total rooms
Neighborhood map
What this means for you Summary
Snapshot
- This is a 3-bed/2.0-bath single-family listed at $180k.
Deal economics
- At list price, monthly cash flow is $256 ($3k/yr) — positive.
- The deal already cash-flows at list — no discount required.
- To meet the 1% rule (rent ≥ 1% of price), the offer needs to be $171k (5.2% below list).
- Recommended offer: $171k (5.2% below list) — sets the bar for 1% rule.
- Cap rate 8.0% vs local median 3.7% in Lake Placid — top-decile yield for the area; either an underpriced asset or a hidden risk that comps aren't pricing in. Stress-test before assuming the spread holds.
Location & tenants
- Location reads 68/100 on livability (#525 in FL) — a middle-class / working-renter tenant base. Strengths: crime A+, cost of living A+, health & safety A+; Watch: amenities F, commute F, employment F.
- Highlands (other): math 45% / reading 43% proficiency, ranked #54 of 73 in FL (top 74%) — families likely to look elsewhere, expect single-tenant / working-renter base with shorter leases; 68% free/reduced lunch — lower-income household profile, screen leases tightly.
- Zoned schools: Lake Placid Elementary School (math 32% / reading 29%, grade F, #1,862 of 2,144 statewide, top 88%, 594 students, 80% FRL); Lake Placid Middle School (math 42% / reading 33%, grade F, #395 of 571 statewide, top 70%, 621 students, 75% FRL); Lake Placid High School (math 36% / reading 35%, grade F, #367 of 667 statewide, top 57%, 868 students, 66% FRL).
- Market conditions: Rents flat; 1488 active listings in the ZIP; 980 units permitted in Highlands County in 2024 (80 in 5+ unit buildings).
- This rent runs 38% of the median local income ($54k/yr) — at the standard rent-burdened threshold; future hikes will face affordability resistance.
Forward outlook
- Local home prices are declining (-3.0%/yr); year-one equity from $1k of loan paydown is wiped out by about $5k of value loss. Plan a longer hold.
Negotiation context
- It's been on market 38 days — a 3% lower offer ($175k) is reasonable based on typical stale-listing flexibility.
- Current owner paid $75k; list at $180k implies a 140% gain — meaningful room to come down on a strong offer.
Risks & watch-outs
- Climate carrying-cost: severe wind risk, 99% chance of damaging wind over 30y; extreme-heat days projected 7→26/yr by 2055 (HVAC capex compounding) — expect insurance premiums to compound above CPI over the hold.
Questions for the listing agent
- It's been on market 38 days. Have you received any prior offers? Is the seller open to a 5% concession, seller financing, or rate buy-down credit?
- Built in 1972 — when were the roof, HVAC, electrical panel, plumbing, and water heater last replaced?
- What does the HOA fee cover, when was the last increase, and are there any pending special assessments or reserve-fund shortfalls?
- Is there a deadline driving the sale (1031 exchange, divorce, estate, relocation)? That informs how much negotiation room exists.
- Schools are D-rated, which usually means shorter tenancies and higher turnover. Who's the typical renter profile here, and what's been the actual vacancy rate?
- What's the average days-on-market for RENTAL listings here right now (not sales)? A rising rental-DOM trend means longer vacancies and softer asking-rent achievability than the comps imply.
- What's the recent tenant-quality profile in this submarket — average credit score on applications, eviction rate, late-payment / NSF rate, and stable-employment percentage? A property-management company in the area should have these aggregated.
- How much new for-sale + rental construction is in the pipeline within 1–3 miles? Heavy new supply typically softens prices + rents 12–24 months out; constrained supply supports both.
Investment metrics
- 1% rule
- 0.95% ✗
- Cap rate
- 8.00%
- Cash-on-cash
- 6.08%
- DSCR
- 1.27
- GRM
- 8.8
CMA / ARV
- ARV (on-the-fly)
- $370,176
- Comps found
- 12
Show comp detail 12 sales within ~0.75 mi
| Address | Dist | Beds/Ba | Sqft | Sold | Price | $/sf | Match |
|---|---|---|---|---|---|---|---|
| 704 Catfish Rd | 0.16mi | 2/2.0 (-1) | 1,568 (+2%) | 2mo | $274,000 | $175 | 82 |
| 122 Grape Rd NW | 0.26mi | 2/2.0 (-1) | 1,464 (-5%) | 1mo | $155,500 | $106 | 74 |
| 255 Tangerine Rd | 0.25mi | 2/2.0 (-1) | 1,412 (-8%) | 2mo | $340,000 | $241 | 68 |
| 100 Lemon Rd NW | 0.23mi | 2/2.0 (-1) | 1,381 (-10%) | 4mo | $190,000 | $138 | 64 |
| 101 Lime Rd NE | 0.24mi | 4/2.0 (+1) | 1,675 (+9%) | 7mo | $435,000 | $260 | 63 |
| 131 Lemon Rd NE | 0.48mi | 2/2.0 (-1) | 1,456 (-5%) | 4mo | $270,000 | $185 | 61 |
| 112 Loquat Rd NE | 0.32mi | 3/2.0 | 1,747 (+14%) | 4mo | $280,000 | $160 | 59 |
| 236 Cumquat Rd NE | 0.46mi | 3/2.0 | 1,352 (-12%) | 1mo | $330,000 | $244 | 58 |
| 125 Orange Rd NE | 0.42mi | 2/2.0 (-1) | 1,712 (+12%) | 2mo | $425,000 | $248 | 54 |
| 426 Foxdale Rd | 0.50mi | 3/2.0 | 1,742 (+13%) | 8mo | $299,000 | $172 | 48 |
| 317 Anderson St NE | 0.54mi | 2/2.0 (-1) | 1,318 (-14%) | 1mo | $480,000 | $364 | 45 |
| 327 Anderson St NE | 0.60mi | 2/2.0 (-1) | 1,347 (-12%) | 4mo | $394,000 | $293 | 43 |
Match score weights: distance 35% · size 25% · config 20% · recency 20%. Top-matched comps best support the ARV.
Projected returns pro-forma
-3.0% appreciation · 0.82% rent growth · sell at horizon
- IRR
- -9.2%
- Equity multiple
- 0.67×
- Total profit
- $-16,625
- Equity at exit
- $26,839
- IRR
- -2.6%
- Equity multiple
- 0.84×
- Total profit
- $-8,187
- Equity at exit
- $15,563
Cash invested: $50,400 (down + closing). Projections, not guarantees.
Landlord ↔ Tenant lean methodology
- Overall (STATE)
- 87 Strongly Landlord-Friendly
- State Florida
- 87 Strongly Landlord-Friendly · R+3
- County
- — inherits STATE
- City
- — inherits STATE
ZIP-level market 33852
- Rents YoY
- 0.8%
- Active inventory
- 1488
- Price-to-rent
- 8.8×
Monthly cashflow live
- Estimated rent
- $1,707 medium interval (Pro) →
- Mortgage (P&I)
- −$944
- Tax from tax record
- −$72 /mo · $866/yr
- Insurance
- −$75
- HOA
- −$2
- Vacancy / Maint / Mgmt
- −$358
- Net cashflow
- $256
Break-even live
UW: 25.0% down · 7.5% · 30yr · 1.5% tax · 5.0% vac · 8.0% maint · 8.0% mgmt
Financing live
Cash to close
- Down payment
- $45,000
- Closing costs
- $5,400
- Reserves months
- —
- Total cash needed
- —
Loan-product check · same deal, 3 products live
Conventional
25% down · 7.5% · 30yr
- Down + closing
- —
- Monthly P&I
- —
- Monthly cashflow
- —
- DSCR
- —
- Eligible?
- —
Personal DTI + credit; lowest rate.
DSCR
20% down · 8.5% · 30yr
- Down + closing
- —
- Monthly P&I
- —
- Monthly cashflow
- —
- DSCR
- —
- Eligible?
- —
No personal income docs; deal must DSCR.
Hard money
10% down · 12.0% · 12mo
- Down + closing
- —
- Monthly P&I
- —
- Monthly cashflow
- —
- DSCR
- —
- Eligible?
- —
Short-term bridge; refi at stabilization.
HOA detail
- Monthly dues
- $2 · $24/yr
Listing history 16 events
-
2026-06-19days on market $180,000 Active 38 DOM
-
2026-06-18days on market $180,000 Active 37 DOM
-
2026-06-17days on market $180,000 Active 36 DOM
-
2026-06-16days on market $180,000 Active 35 DOM
-
2026-06-15days on market $180,000 Active 34 DOM
-
2026-06-14days on market $180,000 Active 32 DOM
-
2026-06-10days on market $180,000 Active 29 DOM
-
2026-06-09days on market $180,000 Active 28 DOM
-
2026-06-08days on market $180,000 Active 27 DOM
-
2026-06-07statusdays on market $180,000 Active 26 DOM
-
2026-05-30statusdays on market $180,000 Pending 25 DOM
-
2026-05-23price $180,000
-
2026-03-27$220,000 Active
-
2014-10-09soldstatus $75,000
-
2005-09-26soldstatus $152,000
-
1974-08-01soldstatus $37,500
ⓘ Source: listings_history table (triggers on properties + properties_extension) + one-shot
backfill from property_details.listing_events for pre-trigger history.
Tax reassessment forecast FL · Resets to sale price
- Current annual tax
- $866 · $72/mo
- Projected year-2 tax
- $1,494 · $124/mo
- Expected delta
- +$628/yr (+$52/mo · 72.6%)
ⓘ Screening estimate from a state-policy table — verify with the county assessor before closing.
Climate risk First Street
- Flood 1/10 Low FEMA zone X (unshaded) · 0% chance over 30 yrs
- Wildfire 2/10 Low
- Heat 9/10 Extreme 7 d/yr ≥108°F today · 26 d/yr by 30 yrs out
- Wind 9/10 Extreme 99% chance of damaging wind over 30 yrs
- Air quality 2/10 Low 1 unhealthy d/yr today · 2 by 30 yrs out
Nearby sold comps map
Loading sold comps map…
Walkable amenities ~0.75 mi
Loading nearby amenities…
Taxation est. · year 1
- Rental income
- $20,485
- − Mortgage interest
- −$10,083
- − Property taxes
- −$866
- − Insurance
- −$900
- − Repairs & maintenance
- −$1,639
- − Management
- −$1,639
- − HOA
- −$24
- − Depreciation
- −$5,236
- Taxable income
- $99
- Est. tax owed @ 24.0%
- −$24
- After-tax cash flow
- $3,043/yr
For passive investors: Depreciation is non-cash, so a rental often shows a tax loss while cash-flowing — sheltering income. Rental losses are passive: they offset passive income freely, and up to $25,000/yr can offset ordinary (W-2) income if you actively participate and your MAGI is under $100k (phasing out to $0 by $150k); unused losses carry forward. On sale, claimed depreciation is recaptured at up to 25%, and gains may owe capital-gains tax (a 1031 exchange can defer both). Figures are a year-1 estimate at your 24.0% rate — not tax advice; consult a CPA.
Schools (NCES district)
- District
- Highlands
- NCES district ID
- 1200840
- Math proficiency
- 45% ▼ -7.00%
- Reading proficiency
- 43% ▼ -3.00%
- Median HH income
- $35,276
- Composite
- 36.42/100
- National rank
- #4672
- State rank
- #54 of 73 in FL
Livability — Lake Placid
- Score
- 68/100
- State rank
- #525
- US rank
- #9813
Category grades
Schools grade is shown separately in the Schools card above.
Census & demographics
- County
- Highlands County · 98,898 people
- City population
- 22,600
- Metro
- Sebring-Avon Park, FL
- Population (ZIP)
- 22,600
- Household income
- $54,284
- Rent vs Own
- Severe rent burden
- 439.0
Population outlook (Highlands County) Hauer SSP2
- Today (2025)
- 99,674 people
- By 2030
- 99,615 · -0.1%
- By 2040
- 99,342 · -0.3%
- By 2050
- 98,242 · -1.4%
- By 2075
- 93,291 · -6.4%
- By 2100
- 79,894 · -19.8%
Race, ethnicity, and origin ACS 2023
- Neighborhood character
- Predominantly White (68%)
- Race & ethnicity
- White 68% Hispanic / Latino 22% Two or more races 11% Black 6% Asian 1%
- Hispanic origin (detail)
- Mexican 11% Puerto Rican 3% Cuban 3%
- Common ancestry
- Lithuanian 2% Slovak 2% Iranian 1%
- Foreign-born
- 14% · Canada, Dominican Republic
- Languages at home
- 79% English-only · Spanish 19% Tagalog/Filipino 1%
Political lean MEDSL · Highlands
- 2024 margin
- Solid R (+40.8) · D 29.3% · R 70.1%
- 2008→2024 swing
- -22.7pp toward R · 2008: -18.1pp · 2024: -40.8pp
- All cycles
- 2024: R+40.8 2020: R+34.4 2016: R+32.0 2012: R+23.0 2008: R+18.1
Not yet ingested
- Civics
- —
Market trends
- HPI YoY
- ▼ -203.31%
- Current HPI
- 224.8693
- Rent YoY
- ▲ 0.82%
- Metro
- Sebring-Avon Park, FL
- State GDP YoY
- ▲ 3.28%
- F500 in state
- 36
Industry mix (Fortune 500 HQ in FL)
| Industry | F500 HQs | Revenue |
|---|---|---|
| Industrial Technology | 2 | $29B |
|
||
| Insurance | 2 | $17B |
|
||
| Retail | 1 | $60B |
|
||
| Technology Distribution | 1 | $58B |
|
||
| Homebuilding | 1 | $35B |
|
||
| Technology Manufacturing | 1 | $35B |
|
||
Price history
+380.0% since first listed5 events — show timeline
- 2026-05-23 Price Changed $180,000 HAOR as distributed by MLS GRID
- 2026-03-27 Listed $220,000 HAOR as distributed by MLS GRID
- 2014-10-09 Sold (Public Records) $75,000 Public Records
- 2005-09-26 Sold (Public Records) $152,000 Public Records
- 1974-08-01 Sold (Public Records) $37,500 Public Records
Property tax history
-1.9%/yrLatest (2025): $866 · +3.3% YoY. Source: county tax records.
Cash-flow waterfall
monthlySold comps — $/sqft
last 12 mo · ≤1 miLoading sold comps…