 🔨 Auction
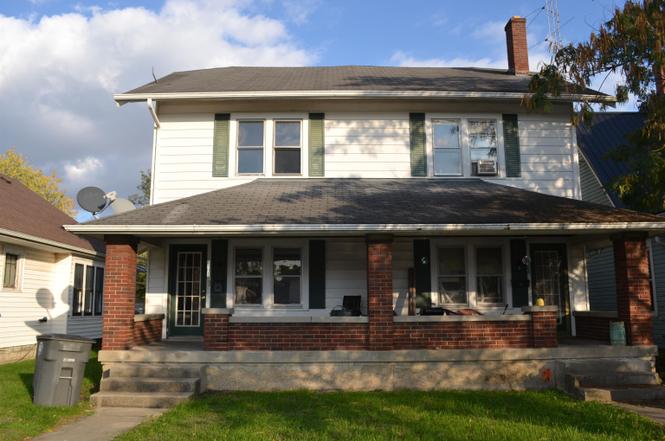
2106 Vermont Ave · Connersville, IN
Flood risk 1/10 · Minimal
- FEMA flood zone
- X (unshaded)
- Chance of flooding over 30 yrs
- 0.0%
- Est. flood insurance / yr
- $473 – $860
Fire risk 1/10 · Minimal
- Est. fire insurance / yr
- $717 – $1,331
Heat risk 3/10 · Minor
- Hot days now (above 100°F)
- 7 days/yr
- Hot days in 30 yrs
- 20 days/yr
Wind risk 2/10 · Minimal
- Chance of severe wind over 30 yrs
- 1.0%
Air-quality risk 2/10 · Minimal
- Unhealthy air days now
- 0 days/yr
- Unhealthy air days in 30 yrs
- 1 days/yr
Risk factors via First Street. Map © Google.
Why this score? — see what drove the F grade
The composite is a weighted blend of 9 inputs, each scored 0–100. Each bar is that input's sub-score; the figure is the points it added to the 100-point composite (weight × sub-score).
- Cash flow +7.9/30.0
- ARV discount +7.5/15.0
- Livability +3.2/5.0
- Schools +2.9/10.0
- Rent growth +2.5/5.0
- Condition / age +2.5/5.0
- 1% rule +2.4/10.0
- Appreciation +2.3/10.0
- DSCR +2.0/10.0
$75,000
🖨 Deal sheet 📄 Offer letter ✓ Due diligence
Multi-family units
County records classify this as Multi-Family (2-4 Unit). Listing-text estimate: 2 units. confirmed
Listing remarks
Take a look at this historic, built, and designed duplex. Both sides have the same floor plan: living, dining, and kitchen on the lower level; three bedrooms and a full bath on the upper level; with the laundry and mechanical located in the basement for easy access and maintenance when needed. The property offers low-maintenance aluminum siding, a newer roof, an updated kitchen, and beautiful woodwork. Take advantage of the immediate income from the long-term tenant with the remaining side vacant and ready for you or your next tenant to move into. Listing price is starting bid not a buy it now price. This property is being sold via an online-only auction Outstanding opportunity to buy at yo
Key facts
- Newer roof
- Updated kitchen
- Historic duplex
Tags
Neighborhood map
What this means for you Summary
Snapshot
- This is a 2 × 3-bed/1.0-bath units multifamily listed at $75k.
Deal economics
- At list price, monthly cash flow is $-370 ($-4k/yr) — negative. Per door: $-185/mo.
- The deal already cash-flows at list — no discount required.
- Meets the 1% rule at list price ($3k rent vs $75k).
- Recommended offer: $73k (3.0% below list) — sets the bar for market timing.
Location & tenants
- Location reads 65/100 on livability (#313 in IN) — a middle-class / working-renter tenant base. Strengths: cost of living A+, housing A+; Watch: health & safety C-, crime D+, amenities F.
- Fayette County School Corporation (town): math 29% / reading 40% proficiency, ranked #206 of 301 in IN (top 68%) — families likely to look elsewhere, expect single-tenant / working-renter base with shorter leases.
- Zoned schools: Fayette Central Elementary (math 47% / reading 42%, grade F, #379 of 994 statewide, top 41%, 337 students, 60% FRL) — zoned schools at 60% FRL track the district average.
- Market conditions: 171 active listings in the ZIP; 20 units permitted in Fayette County in 2024 (0 in 5+ unit buildings).
Forward outlook
- Local home prices are declining (-3.0%/yr); year-one equity from $2k of loan paydown is wiped out by about $11k of value loss. Plan a longer hold.
- Fayette County population projected at -26% by 2050 — secular population decline; favor cash flow + early exit over multi-decade hold.
Negotiation context
- It's been on market 46 days — a 3% lower offer ($73k) is reasonable based on typical stale-listing flexibility.
Risks & watch-outs
- Watch-outs: property tax is 7.0% of price; built in 1920 — expect roof / HVAC / electrical / plumbing capex.
Questions for the listing agent
- What do current leases actually rent for vs. the listed asking? Can we see a recent rent roll and the last 12 months of T-12 income?
- It's been on market 46 days. Have you received any prior offers? Is the seller open to a 3% concession, seller financing, or rate buy-down credit?
- Can we see the unit-by-unit rent roll, current vacancy, and any below-market leases? What's the average tenancy length?
- What capital expenditures (roof, boiler, parking lot, exteriors) have been made in the last 5 years, and what's planned in the next 2?
- Built in 1920 — when were the roof, HVAC, electrical panel, plumbing, and water heater last replaced?
- Property tax is high relative to price — has the assessment been appealed recently, and will the sale trigger a re-assessment?
- Is there a deadline driving the sale (1031 exchange, divorce, estate, relocation)? That informs how much negotiation room exists.
- Schools are D-rated, which usually means shorter tenancies and higher turnover. Who's the typical renter profile here, and what's been the actual vacancy rate?
- Crime grade is D in this area — have there been break-ins, vandalism, or insurance claims at this property in the last 3 years? What carrier currently insures it and at what premium?
- The area grade is low — what's the realistic commute time and amenity access for the typical tenant pool here? Any planned neighborhood developments (good or bad) we should know about?
- What's the average days-on-market for RENTAL listings here right now (not sales)? A rising rental-DOM trend means longer vacancies and softer asking-rent achievability than the comps imply.
- What's the recent tenant-quality profile in this submarket — average credit score on applications, eviction rate, late-payment / NSF rate, and stable-employment percentage? A property-management company in the area should have these aggregated.
- How much new apartment / multifamily construction is in the pipeline within 1–3 miles? Heavy new supply (>2% of stock underway) typically softens rents 12–24 months out; light construction supports rent growth.
Investment metrics
- 1% rule
- 0.74% ✗
- Cap rate
- 5.02%
- Cash-on-cash
- -4.53%
- DSCR
- 0.80
- GRM
- 11.2
CMA / ARV
- ARV (on-the-fly)
- $350,208
- Comps found
- 1
Show comp detail 1 sale within ~0.75 mi
| Address | Dist | Beds/Ba | Sqft | Sold | Price | $/sf | Match |
|---|---|---|---|---|---|---|---|
| 1500 N Grand Ave | 0.52mi | 6/6.0 | 3,062 (-0%) | 15mo | $350,000 | $114 | 47 |
Match score weights: distance 35% · size 25% · config 20% · recency 20%. Top-matched comps best support the ARV.
Projected returns pro-forma
-3.0% appreciation · 3.0% rent growth · sell at horizon
- IRR
- -24.0%
- Equity multiple
- 0.18×
- Total profit
- $-80,285
- Equity at exit
- $52,217
- IRR
- -19.0%
- Equity multiple
- -0.02×
- Total profit
- $-100,109
- Equity at exit
- $30,280
Cash invested: $98,058 (down + closing). Projections, not guarantees.
Landlord ↔ Tenant lean methodology
- Overall (STATE)
- 90 Strongly Landlord-Friendly
- State Indiana
- 90 Strongly Landlord-Friendly · R+11
- County
- — inherits STATE
- City
- — inherits STATE
ZIP-level market 47331
- Home prices YoY
- -2.1%
- Active inventory
- 171
- Price-to-rent
- 4.8×
Monthly cashflow live
- Estimated rent
- $2,595 medium interval (Pro) →
- Mortgage (P&I)
- −$1,837
- Tax est. 1.5%
- −$438 /mo · $5,253/yr
- Insurance
- −$146
- HOA
- −$0
- Vacancy / Maint / Mgmt
- −$545
- Net cashflow
- $-370
Break-even live
2-unit breakdown (identical units grouped — click to expand)
| Units | Beds | Baths | Est. rent |
|---|---|---|---|
| 2× units | 3 | 1 | $2,594 |
| #1 | 3 | 1 | $1,297 |
| #2 | 3 | 1 | $1,297 |
| Total (2 units) | $2,595 | ||
UW: 25.0% down · 7.5% · 30yr · 1.5% tax · 5.0% vac · 8.0% maint · 8.0% mgmt
Financing live
Cash to close
- Down payment
- $87,552
- Closing costs
- $10,506
- Reserves months
- —
- Total cash needed
- —
Loan-product check · same deal, 3 products live
Conventional
25% down · 7.5% · 30yr
- Down + closing
- —
- Monthly P&I
- —
- Monthly cashflow
- —
- DSCR
- —
- Eligible?
- —
Personal DTI + credit; lowest rate.
DSCR
20% down · 8.5% · 30yr
- Down + closing
- —
- Monthly P&I
- —
- Monthly cashflow
- —
- DSCR
- —
- Eligible?
- —
No personal income docs; deal must DSCR.
Hard money
10% down · 12.0% · 12mo
- Down + closing
- —
- Monthly P&I
- —
- Monthly cashflow
- —
- DSCR
- —
- Eligible?
- —
Short-term bridge; refi at stabilization.
Listing history 2 events
-
2026-01-16status Pending
-
2025-12-01$75,000 Active
ⓘ Source: listings_history table (triggers on properties + properties_extension) + one-shot
backfill from property_details.listing_events for pre-trigger history.
Climate risk First Street
- Flood 1/10 Low FEMA zone X (unshaded) · 0% chance over 30 yrs
- Wildfire 1/10 Low
- Heat 3/10 Moderate 7 d/yr ≥100°F today · 20 d/yr by 30 yrs out
- Wind 2/10 Low 100% chance of damaging wind over 30 yrs
- Air quality 2/10 Low 0 unhealthy d/yr today · 1 by 30 yrs out
Nearby sold comps map
Loading sold comps map…
Walkable amenities ~0.75 mi
Loading nearby amenities…
Taxation est. · year 1
- Rental income
- $31,140
- − Mortgage interest
- −$19,617
- − Property taxes
- −$5,253
- − Insurance
- −$1,751
- − Repairs & maintenance
- −$2,491
- − Management
- −$2,491
- − Depreciation
- −$10,188
- Taxable loss
- −$10,652
- Est. tax savings @ 24.0%
- +$2,556
- After-tax cash flow
- $-1,886/yr
For passive investors: Depreciation is non-cash, so a rental often shows a tax loss while cash-flowing — sheltering income. Rental losses are passive: they offset passive income freely, and up to $25,000/yr can offset ordinary (W-2) income if you actively participate and your MAGI is under $100k (phasing out to $0 by $150k); unused losses carry forward. On sale, claimed depreciation is recaptured at up to 25%, and gains may owe capital-gains tax (a 1031 exchange can defer both). Figures are a year-1 estimate at your 24.0% rate — not tax advice; consult a CPA.
Schools (NCES district)
- District
- Fayette County School Corporation
- NCES district ID
- 1803510
- Math proficiency
- 29% ▼ -11.00%
- Reading proficiency
- 40% ▼ -8.00%
- Median HH income
- $38,669
- Composite
- 28.81/100
- National rank
- #6659
- State rank
- #206 of 301 in IN
Livability — Connersville
- Score
- 65/100
- State rank
- #313
- US rank
- #12417
Category grades
Schools grade is shown separately in the Schools card above.
Census & demographics
- Census place
- Connersville, IN
- Population (ZIP)
- 22,769
Population outlook (Fayette County) Hauer SSP2
- Today (2025)
- 21,758 people
- By 2030
- 20,673 · -5.0%
- By 2040
- 18,335 · -15.7%
- By 2050
- 16,056 · -26.2%
- By 2075
- 11,030 · -49.3%
- By 2100
- 6,800 · -68.7%
Race, ethnicity, and origin ACS 2023
- Neighborhood character
- Predominantly White (94%)
- Race & ethnicity
- White 94% Two or more races 4% Hispanic / Latino 1% Black 1%
- Common ancestry
- Italian 2% Slovak 1% Lithuanian 1%
- Foreign-born
- 1% · Canada
- Languages at home
- 98% English-only · Spanish 1%
Political lean MEDSL · Fayette
- 2024 margin
- Solid R (+56.3) · D 21.2% · R 77.5% · Other 1.3%
- 2008→2024 swing
- -50.8pp toward R · 2008: -5.6pp · 2024: -56.3pp
- All cycles
- 2024: R+56.3 2020: R+54.4 2016: R+48.1 2012: R+16.9 2008: R+5.6
Not yet ingested
- Civics
- —
Market trends
- HPI YoY
- ▼ -5.33%
- Current HPI
- 252.3898
- Rent YoY
- —
- Metro
- —
- State GDP YoY
- ▲ 2.90%
- F500 in state
- 18
Industry mix (Fortune 500 HQ in IN)
| Industry | F500 HQs | Revenue |
|---|---|---|
| Industrial Machinery | 2 | $37B |
|
||
| Healthcare | 1 | $177B |
|
||
| Pharmaceuticals | 1 | $45B |
|
||
| Metals / Steel | 1 | $18B |
|
||
| Agriculture | 1 | $17B |
|
||
| Packaging | 1 | $12B |
|
||
Price history
2 events — show timeline
- 2026-01-16 Pending — ECIAOR
- 2025-12-01 Listed $75,000 ECIAOR
Cash-flow waterfall
monthlySold comps — $/sqft
last 12 mo · ≤1 miLoading sold comps…