1101 Colony Point Cir #218 · Pembroke Pines, FL
Flood risk 1/10 · Minimal
- FEMA flood zone
- X (shaded)
- Chance of flooding over 30 yrs
- 0.0%
- Est. flood insurance / yr
- $507 – $1,088
Fire risk 1/10 · Minimal
- Est. fire insurance / yr
- $947 – $1,759
Heat risk 9/10 · Severe
- Hot days now (above 105°F)
- 6 days/yr
- Hot days in 30 yrs
- 22 days/yr
Wind risk 10/10 · Severe
- Chance of severe wind over 30 yrs
- 99.0%
Air-quality risk 2/10 · Minimal
- Unhealthy air days now
- 2 days/yr
- Unhealthy air days in 30 yrs
- 2 days/yr
Risk factors via First Street. Map © Google.
Why this score? — see what drove the C- grade
The composite is a weighted blend of 9 inputs, each scored 0–100. Each bar is that input's sub-score; the figure is the points it added to the 100-point composite (weight × sub-score).
- Cash flow +16.8/30.0
- 1% rule +10.0/10.0
- ARV discount +7.5/15.0
- DSCR +5.2/10.0
- Livability +4.2/5.0
- Schools +4.1/10.0
- Rent growth +2.9/5.0
- Condition / age +2.5/5.0
- Appreciation +0.0/10.0
$130,000
🖨 Deal sheet 📄 Offer letter ✓ Due diligence
Listing remarks
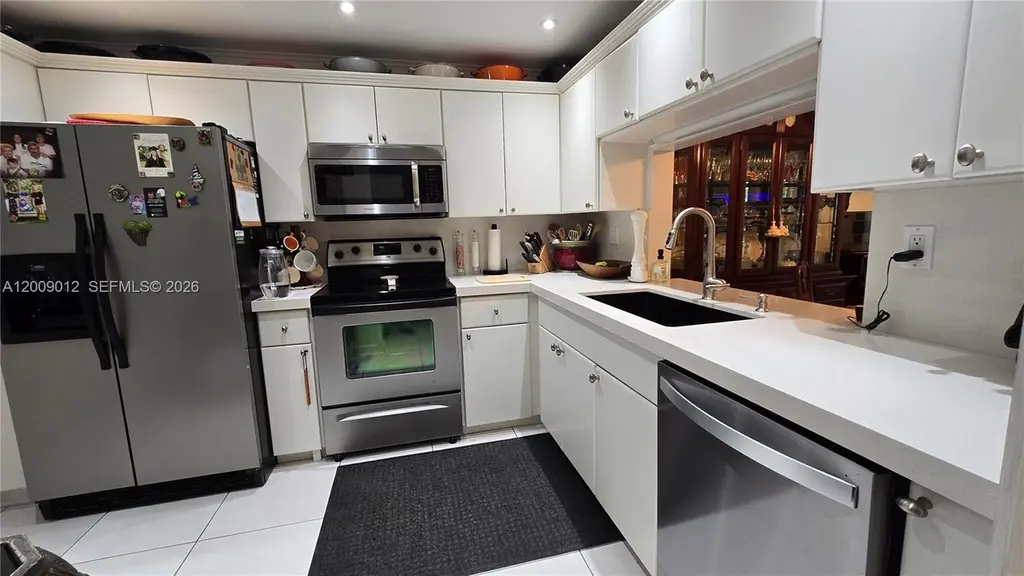
Welcome to your dream retreat in the heart of Pembroke Pines! This captivating, fully renovated 1 bed, 1.5 bath condo blends modern style with everyday comfort. Enjoy a bright, open layout and a chef’s kitchen featuring quartz countertops, stainless steel appl, & sleek cabinetry. Elegant large ceramic floors, updated baths, new screened balcony, impact windows, newer A/C, LG front-load washer/dryer add to the appeal. Furniture is negotiable! Live the good life at Colony Point, a vibrant 55+ resort-style community with clubhouse, gym, billiard room, theatre, heated pool, & walking trails. Maintenance includes cable, internet, water, security, & all amenities. Ideally loc
Key facts
- $759 HOA
- 2 parking spots
- Community pool
Property features AI
Finance
- HOA & community: Monthly association fee (includes common areas, cable TV, internet, grounds and structure maintenance, parking, pools, recreation facilities, reserve fund, roof, security, trash, water); Community amenities include: clubhouse, fitness center, business center, library, billiard room, barbecue/picnic areas, pickleball, tennis courts, trails, storage, transportation service, and elevators; Senior community
Exterior
- Parking: Assigned parking; Guest parking; Two or more spaces available
- Security: Security guard
- Utilities: Cable available
- Home design: Condo/Apartment in a 5-story building; Faces east; Entry on level 2; Updated/remodeled; Attached property
- Construction: Block construction; Effective year built
- Exterior features: Balcony; Screened balcony; Barbecue
Interior
- Kitchen: Electric range; Microwave; Dishwasher; Refrigerator
- Bedrooms: Bedroom on main level; Great Room
- Flooring: Ceramic tile
- Bathrooms: 1 full bathroom; 1 half bathroom
- Heating & cooling: Central heating; Central air; Ceiling fan(s)
- Interior features: Blinds and impact glass windows; Built-in features; Entrance foyer; Main living area at entry level; Walk-in closet(s); Furnishing negotiable
- Laundry & utility: Washer and dryer; Electric water heater
Neighborhood map
What this means for you Summary
Snapshot
- This is a 1-bed/2.0-bath condo listed at $130k.
Deal economics
- At list price, monthly cash flow is $84 ($1k/yr) — positive.
- The deal already cash-flows at list — no discount required.
- Meets the 1% rule at list price ($2k rent vs $130k).
- Recommended offer: $126k (3.0% below list) — sets the bar for market timing.
- Cap rate 7.1% vs local median 4.0% in Pembroke Pines — top-decile yield for the area; either an underpriced asset or a hidden risk that comps aren't pricing in. Stress-test before assuming the spread holds.
Location & tenants
- Location reads 83/100 on livability (#54 in FL, #933 nationally) — a professional / high-income tenant draw. Strengths: housing A+, health & safety A+, schools A-; Watch: amenities D+, cost of living D+.
- Broward (suburban): math 42% / reading 53% proficiency, ranked #46 of 73 in FL (top 63%) — families likely to look elsewhere, expect single-tenant / working-renter base with shorter leases.
- Market conditions: Rents rising (+1.6%/yr); 222 active listings in the ZIP; 20 comparable units currently listed for rent nearby; rentals at typical pace (median 23d on market — plan ~3-4 weeks tenant-placement turnaround); solid renter incomes; 2,111 units permitted in Broward County in 2024 (1,265 in 5+ unit buildings).
Forward outlook
- Local home prices are declining (-3.0%/yr); year-one equity from $899 of loan paydown is wiped out by about $4k of value loss. Plan a longer hold.
- Broward County population projected at +34% by 2050 — long-run rental-demand tailwind backs the buy-and-hold thesis.
Negotiation context
- It's been on market 50 days — a 3% lower offer ($126k) is reasonable based on typical stale-listing flexibility.
- 4 sale attempts since 6y ago with the ask held roughly flat each time — persistent listings suggest the price (not the market) is what's stuck; bring a comps-based counter.
- Current owner paid $95k; 36% above their basis — modest negotiation headroom, anchor on the comps not their cost.
Risks & watch-outs
- Watch-outs: HOA is 37% of rent.
- Climate carrying-cost: severe wind risk, 99% chance of damaging wind over 30y; extreme-heat days projected 6→22/yr by 2055 (HVAC capex compounding) — expect insurance premiums to compound above CPI over the hold.
Questions for the listing agent
- It's been on market 50 days. Have you received any prior offers? Is the seller open to a 3% concession, seller financing, or rate buy-down credit?
- Built in 1979 — when were the roof, HVAC, electrical panel, plumbing, and water heater last replaced?
- What does the HOA fee cover, when was the last increase, and are there any pending special assessments or reserve-fund shortfalls?
- Any open or pending special assessments — roof, HVAC, plumbing, elevator, façade? What's the per-unit balance and payoff schedule, and is the seller paying it off at close or rolling it to the buyer?
- Is there a deadline driving the sale (1031 exchange, divorce, estate, relocation)? That informs how much negotiation room exists.
- Schools are A-rated — typically a magnet for longer-tenancy family renters. What's the average tenant stay here, and is there a school-zone premium baked into asking?
- What's the average days-on-market for RENTAL listings here right now (not sales)? A rising rental-DOM trend means longer vacancies and softer asking-rent achievability than the comps imply.
- What's the recent tenant-quality profile in this submarket — average credit score on applications, eviction rate, late-payment / NSF rate, and stable-employment percentage? A property-management company in the area should have these aggregated.
- How much new apartment / multifamily construction is in the pipeline within 1–3 miles? Heavy new supply (>2% of stock underway) typically softens rents 12–24 months out; light construction supports rent growth.
Investment metrics
- 1% rule
- 1.58% ✓
- Cap rate
- 7.07%
- Cash-on-cash
- 2.76%
- DSCR
- 1.12
- GRM
- 5.3
CMA / ARV
No comps found within radius.
Projected returns pro-forma
-3.0% appreciation · 1.58% rent growth · sell at horizon
- IRR
- -14.2%
- Equity multiple
- 0.50×
- Total profit
- $-18,208
- Equity at exit
- $19,383
- IRR
- -9.2%
- Equity multiple
- 0.48×
- Total profit
- $-18,815
- Equity at exit
- $11,240
Cash invested: $36,400 (down + closing). Projections, not guarantees.
Landlord ↔ Tenant lean methodology
- Overall (STATE)
- 87 Strongly Landlord-Friendly
- State Florida
- 87 Strongly Landlord-Friendly · R+3
- County
- — inherits STATE
- City
- — inherits STATE
ZIP-level market 33026
- Rents YoY
- 1.6%
- Active inventory
- 222
- Price-to-rent
- 5.3×
Monthly cashflow live
- Estimated rent
- $2,056 high interval (Pro) →
- Mortgage (P&I)
- −$682
- Tax from tax record
- −$45 /mo · $543/yr
- Insurance
- −$54
- HOA
- −$759
- Vacancy / Maint / Mgmt
- −$432
- Net cashflow
- $84
Break-even live
UW: 25.0% down · 7.5% · 30yr · 1.5% tax · 5.0% vac · 8.0% maint · 8.0% mgmt
Financing live
Cash to close
- Down payment
- $32,500
- Closing costs
- $3,900
- Reserves months
- —
- Total cash needed
- —
Loan-product check · same deal, 3 products live
Conventional
25% down · 7.5% · 30yr
- Down + closing
- —
- Monthly P&I
- —
- Monthly cashflow
- —
- DSCR
- —
- Eligible?
- —
Personal DTI + credit; lowest rate.
DSCR
20% down · 8.5% · 30yr
- Down + closing
- —
- Monthly P&I
- —
- Monthly cashflow
- —
- DSCR
- —
- Eligible?
- —
No personal income docs; deal must DSCR.
Hard money
10% down · 12.0% · 12mo
- Down + closing
- —
- Monthly P&I
- —
- Monthly cashflow
- —
- DSCR
- —
- Eligible?
- —
Short-term bridge; refi at stabilization.
Rent comps 20 comps
| Address | Beds | Baths | Sqft | Rent | $/sqft | DOM | Units | Dist |
|---|---|---|---|---|---|---|---|---|
| 10851 NW 3rd Ct Unit 18A2L Pembroke Pines, FL | 1.0 | 1.0 | 610 | $1,850 | $3.03 | 21d | 1 | 0.46mi |
| 10813 NW 3rd Ct Unit 2L Pembroke Pines, FL | 1.0 | 1.0 | 610 | $1,850 | $3.03 | 24d | 1 | 0.49mi |
| 10813 NW 3rd Ct Unit 2L Pembroke Pines, FL | 1.0 | 1.0 | 610 | $1,875 | $3.07 | 8d | 1 | 0.49mi |
| 151 SW 117th Ave #9306 Pembroke Pines, FL | 1.0 | 1.0 | 690 | $1,900 | $2.75 | 24d | 1 | 0.72mi |
| 220 SW 116th Ave #15203 Pembroke Pines, FL | 1.0 | 1.0 | 690 | $2,000 | $2.90 | 24d | 1 | 0.78mi |
| 220 SW 116th Ave #15203 Pembroke Pines, FL | 1.0 | 1.0 | 690 | $2,000 | $2.90 | 5d | 1 | 0.78mi |
| 11730 SW 2nd St #12103 Pembroke Pines, FL | 1.0 | 1.0 | 690 | $2,200 | $3.19 | 21d | 1 | 0.84mi |
| 11730 SW 2nd St #12103 Pembroke Pines, FL | 1.0 | 1.0 | 690 | $2,100 | $3.04 | 8d | 1 | 0.84mi |
| 11730 SW 2nd St #12204 Pembroke Pines, FL | 1.0 | 1.0 | 690 | $2,100 | $3.04 | 24d | 1 | 0.84mi |
| 2321 NW 114th Ter Unit 1442058P Pembroke Pines, FL | 1.0 | 1.0 | 699 | $3,028 | $4.33 | 2d | 1 | 0.91mi |
| 11165 SW 6th St Pembroke Pines, FL | 1.0 | 1.0–1.5 | 742 | $1,950 | $2.63 | 22d | 2 | 0.94mi |
| 11165 SW 6th St Pembroke Pines, FL | 1.0 | 1.0–1.5 | 742 | $1,950 | $2.63 | 24d | 2 | 0.94mi |
| 631 SW 111th Ln #205 Pembroke Pines, FL | 1.0 | 1.0 | 742 | $1,900 | $2.56 | 24d | 1 | 0.96mi |
| 631 SW 111th Ln #205 Pembroke Pines, FL | 1.0 | 1.0 | 742 | $1,800 | $2.43 | 8d | 1 | 0.96mi |
| 655 SW 111th Way Pembroke Pines, FL | 1.0–3.0 | 1.0–2.0 | 991 | $1,825 | $1.84 | 24d | 2 | 1.00mi |
| 711 SW 111th Way #105 Pembroke Pines, FL | 1.0 | 1.0 | 742 | $1,900 | $2.56 | 3d | 1 | 1.02mi |
| 10700 City Center Blvd Pembroke Pines, FL | 3.0 | 1.0–2.0 | 977 | $2,370 | $2.43 | 2d | 21 | 1.02mi |
| 1100 Saint Charles Pl #620 Pembroke Pines, FL | 1.0 | 1.5 | 740 | $1,750 | $2.36 | 24d | 1 | 1.06mi |
| 1400 Saint Charles Pl #314 Pembroke Pines, FL | 1.0 | 1.5 | 740 | $1,800 | $2.43 | 24d | 1 | 1.16mi |
| 10400 City Center Blvd Pembroke Pines, FL | 1.0–3.0 | 1.0–2.5 | 1071 | $2,101 | $1.96 | 3d | 21 | 1.19mi |
HOA detail condo
- Monthly dues
- $759 · $9,108/yr
- Likely covers
- waterinternetcablepoolgymsecurity
- Assessments
- None detected in remarks — confirm with the listing agent.
Listing history 24 events
-
2026-06-18days on market $130,000 Active 50 DOM
-
2026-06-17days on market $130,000 Active 49 DOM
-
2026-06-16days on market $130,000 Active 48 DOM
-
2026-06-15days on market $130,000 Active 47 DOM
-
2026-06-13days on market $130,000 Active 45 DOM
-
2026-06-09days on market $130,000 Active 41 DOM
-
2026-06-08days on market $130,000 Active 40 DOM
-
2026-06-07days on market $130,000 Active 39 DOM
-
2026-06-04days on market $130,000 Active 36 DOM
-
2026-06-03days on market $130,000 Active 35 DOM
-
2026-06-02days on market $130,000 Active 34 DOM
-
2026-06-01days on market $130,000 Active 33 DOM
-
2026-05-31days on market $130,000 Active 32 DOM
-
2026-04-29$130,000 Active
-
2025-10-29historical
-
2025-10-10$150,000 Active
-
2020-10-21$125,000 Active
-
2020-06-24historical
-
2020-05-29price $125,000
-
2020-04-27price $129,900
-
2020-03-16$139,000 Active
-
2005-03-11soldstatus $95,300
-
1997-08-11soldstatus $41,000
-
1990-03-16soldstatus $37,000
ⓘ Source: listings_history table (triggers on properties + properties_extension) + one-shot
backfill from property_details.listing_events for pre-trigger history.
Tax reassessment forecast FL · Resets to sale price
- Current annual tax
- $543 · $45/mo
- Projected year-2 tax
- $1,079 · $90/mo
- Expected delta
- +$536/yr (+$45/mo · 98.5%)
ⓘ Screening estimate from a state-policy table — verify with the county assessor before closing.
Climate risk First Street
- Flood 1/10 Low FEMA zone X (shaded) · 0% chance over 30 yrs
- Wildfire 1/10 Low
- Heat 9/10 Extreme 6 d/yr ≥105°F today · 22 d/yr by 30 yrs out
- Wind 10/10 Extreme 99% chance of damaging wind over 30 yrs
- Air quality 2/10 Low 2 unhealthy d/yr today · 2 by 30 yrs out
Nearby sold comps map
Loading sold comps map…
Walkable amenities ~0.75 mi
Loading nearby amenities…
Taxation est. · year 1
- Rental income
- $24,666
- − Mortgage interest
- −$7,282
- − Property taxes
- −$543
- − Insurance
- −$650
- − Repairs & maintenance
- −$1,973
- − Management
- −$1,973
- − HOA
- −$9,108
- − Depreciation
- −$3,782
- Taxable loss
- −$646
- Est. tax savings @ 24.0%
- +$155
- After-tax cash flow
- $1,159/yr
For passive investors: Depreciation is non-cash, so a rental often shows a tax loss while cash-flowing — sheltering income. Rental losses are passive: they offset passive income freely, and up to $25,000/yr can offset ordinary (W-2) income if you actively participate and your MAGI is under $100k (phasing out to $0 by $150k); unused losses carry forward. On sale, claimed depreciation is recaptured at up to 25%, and gains may owe capital-gains tax (a 1031 exchange can defer both). Figures are a year-1 estimate at your 24.0% rate — not tax advice; consult a CPA.
Schools (NCES district)
- District
- Broward
- NCES district ID
- 1200180
- Math proficiency
- 42% ▼ -18.00%
- Reading proficiency
- 53% ▼ -5.00%
- Median HH income
- $52,139
- Composite
- 40.88/100
- National rank
- #3621
- State rank
- #46 of 73 in FL
Livability — Pembroke Pines
- Score
- 83/100
- State rank
- #54
- US rank
- #933
Category grades
Schools grade is shown separately in the Schools card above.
Census & demographics
- Census place
- Pembroke Pines, FL
- County
- Broward County · 1,963,430 people
- City population
- 180,224
- Metro
- Miami-Fort Lauderdale-Pompano Beach, FL
- Population (ZIP)
- 31,172
- Household income
- $89,306
- Rent vs Own
- Severe rent burden
- 517.0
Population outlook (Broward County) Hauer SSP2
- Today (2025)
- 2,207,033 people
- By 2030
- 2,360,704 · +7.0%
- By 2040
- 2,661,208 · +20.6%
- By 2050
- 2,946,698 · +33.5%
- By 2075
- 3,602,273 · +63.2%
- By 2100
- 3,970,984 · +79.9%
Race, ethnicity, and origin ACS 2023
- Neighborhood character
- Diverse neighborhood (Simpson 0.69)
- Race & ethnicity
- Hispanic / Latino 41% White 35% Two or more races 23% Black 15% Asian 4%
- Hispanic origin (detail)
- Puerto Rican 5% Cuban 13% Dominican 2%
- Common ancestry
- Hispanic 5% Romanian 3% Scotch-Irish 2%
- Foreign-born
- 35% · Canada, Jamaica, China
- Languages at home
- 52% English-only · Spanish 35% French/Haitian/Cajun 5% Other Indo-European 4%
Political lean MEDSL · Broward
- 2024 margin
- D (+17.0) · D 58.0% · R 41.0%
- 2008→2024 swing
- -17.8pp toward R · 2008: 34.7pp · 2024: 17.0pp
- All cycles
- 2024: D+17.0 2020: D+29.8 2016: D+35.0 2012: D+34.9 2008: D+34.7
Not yet ingested
- Civics
- —
Market trends
- HPI YoY
- ▼ -248.72%
- Current HPI
- 380.7596
- Rent YoY
- ▲ 1.58%
- Metro
- Miami-Fort Lauderdale-Pompano Beach, FL
- State GDP YoY
- ▲ 3.28%
- F500 in state
- 36
Industry mix (Fortune 500 HQ in FL)
| Industry | F500 HQs | Revenue |
|---|---|---|
| Industrial Technology | 2 | $29B |
|
||
| Insurance | 2 | $17B |
|
||
| Retail | 1 | $60B |
|
||
| Technology Distribution | 1 | $58B |
|
||
| Homebuilding | 1 | $35B |
|
||
| Technology Manufacturing | 1 | $35B |
|
||
Price history
+251.4% since first listed11 events — show timeline
- 2026-04-29 Listed $130,000 MARMLS
- 2025-10-29 Listing Removed — MARMLS
- 2025-10-10 Listed $150,000 MARMLS
- 2020-10-21 Listed $125,000 MARMLS
- 2020-06-24 Listing Removed — MARMLS
- 2020-05-29 Price Changed $125,000 MARMLS
- 2020-04-27 Price Changed $129,900 MARMLS
- 2020-03-16 Listed $139,000 MARMLS
- 2005-03-11 Sold (Public Records) $95,300 Public Records
- 1997-08-11 Sold (Public Records) $41,000 Public Records
- 1990-03-16 Sold (Public Records) $37,000 Public Records
Property tax history
+1.9%/yrLatest (2025): $543 · +2.0% YoY. Source: county tax records.
Cash-flow waterfall
monthlySold comps — $/sqft
last 12 mo · ≤1 miLoading sold comps…