 Duplex
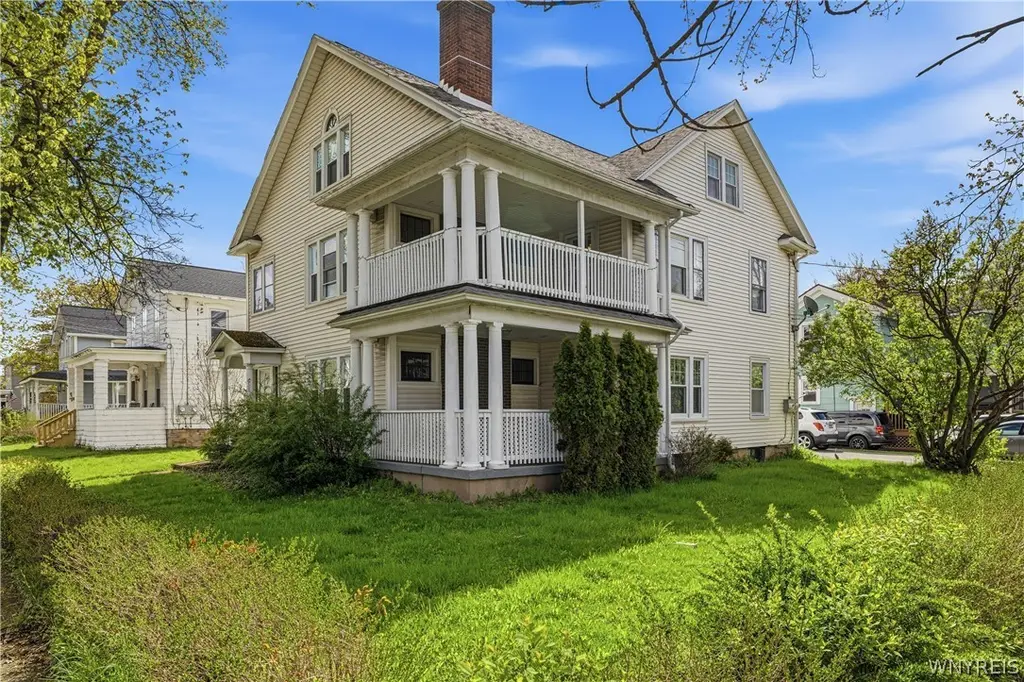
342 East Ave · Lockport, NY
Flood risk 1/10 · Minimal
- FEMA flood zone
- X (unshaded)
- Chance of flooding over 30 yrs
- 0.0%
- Est. flood insurance / yr
- $473 – $860
Fire risk 2/10 · Minimal
- Est. fire insurance / yr
- $691 – $1,283
Heat risk 2/10 · Minimal
- Hot days now (above 94°F)
- 7 days/yr
- Hot days in 30 yrs
- 15 days/yr
Wind risk 1/10 · Minimal
- Chance of severe wind over 30 yrs
- —
Air-quality risk 2/10 · Minimal
- Unhealthy air days now
- 1 days/yr
- Unhealthy air days in 30 yrs
- 2 days/yr
Risk factors via First Street. Map © Google.
Why this score? — see what drove the D+ grade
The composite is a weighted blend of 9 inputs, each scored 0–100. Each bar is that input's sub-score; the figure is the points it added to the 100-point composite (weight × sub-score).
- Cash flow +19.2/30.0
- 1% rule +6.2/10.0
- DSCR +6.0/10.0
- Schools +3.9/10.0
- Livability +3.8/5.0
- Rent growth +3.4/5.0
- ARV discount +3.1/15.0
- Condition / age +2.5/5.0
- Appreciation +0.0/10.0
$225,000
🖨 Deal sheet 📄 Offer letter ✓ Due diligence
Multi-family units
County records classify this as Multi-Family (2-4 Unit). Listing-text estimate: 2 units. confirmed
Listing remarks MLS
Family owned and occupied updated and upgraded double SOLD BEFORE PRINT!
Key facts
- Covered front porch
- Covered balcony
- 6,098 sq ft lot
Tags
Property features AI
Finance
- Other: Multi-unit property with 2 total units; Separate gas and electric meters for each unit (2 each)
- Financial info: Owner pays grounds care, trash collection, and water; Rent includes gardener, trash collection, and water; Operating expense details: see remarks
Exterior
- Parking: Paved parking with two or more spaces
- Utilities: Electricity connected (circuit breakers); Public water connected; Sewer connected
- Home design: Two-story property; Resale property; Vinyl siding
- Construction: Poured foundation; Asphalt roof; Vinyl siding construction
- Exterior features: Balcony; Covered porch
Interior
- Flooring: Carpet; Ceramic tile; Hardwood; Luxury vinyl; Varied flooring
- Bathrooms: Two full bathrooms
- Heating & cooling: Gas forced-air heating
- Interior features: Natural woodwork; See remarks / other interior features
- Laundry & utility: Washer hookup; Gas water heater
Neighborhood map
What this means for you Summary
Snapshot
- This is a 2 × 2-bed/1.0-bath units multifamily listed at $225k.
Deal economics
- At list price, monthly cash flow is $242 ($3k/yr) — positive. Per door: $121/mo.
- The deal already cash-flows at list — no discount required.
- Meets the 1% rule at list price ($3k rent vs $225k).
- Recommended offer: $222k (1.5% below list) — sets the bar for market timing.
- Cap rate 7.6% vs local median 4.5% in Lockport — top-decile yield for the area; either an underpriced asset or a hidden risk that comps aren't pricing in. Stress-test before assuming the spread holds.
Location & tenants
- Location reads 76/100 on livability (#232 in NY, #3,669 nationally) — a middle-class / working-renter tenant base. Strengths: amenities A+, cost of living A+, housing A+; Watch: commute D+, crime F, employment D-.
- Lockport City School District (town): math 44% / reading 49% proficiency, ranked #452 of 590 in NY (top 77%) — families likely to look elsewhere, expect single-tenant / working-renter base with shorter leases.
- Market conditions: Rents rising (+3.7%/yr); 357 active listings in the ZIP; solid renter incomes; 167 units permitted in Niagara County in 2024 (0 in 5+ unit buildings).
- This rent runs 40% of the median local income ($75k/yr) — at the standard rent-burdened threshold; future hikes will face affordability resistance.
Forward outlook
- Local home prices are declining (-3.0%/yr); year-one equity from $2k of loan paydown is wiped out by about $7k of value loss. Plan a longer hold.
- Niagara County population projected at -19% by 2050 — secular population decline; favor cash flow + early exit over multi-decade hold.
Negotiation context
- It's been on market 16 days — a 2% lower offer ($222k) is reasonable based on typical stale-listing flexibility.
- 4 sale attempts since 12y ago with the ask held roughly flat each time — persistent listings suggest the price (not the market) is what's stuck; bring a comps-based counter.
- Current owner paid $120k; list at $225k implies a 88% gain — meaningful room to come down on a strong offer.
Risks & watch-outs
- Watch-outs: property tax is 2.5% of price; built in 1890 — expect roof / HVAC / electrical / plumbing capex.
Questions for the listing agent
- Can we see the unit-by-unit rent roll, current vacancy, and any below-market leases? What's the average tenancy length?
- What capital expenditures (roof, boiler, parking lot, exteriors) have been made in the last 5 years, and what's planned in the next 2?
- Built in 1890 — when were the roof, HVAC, electrical panel, plumbing, and water heater last replaced?
- Property tax is high relative to price — has the assessment been appealed recently, and will the sale trigger a re-assessment?
- Is there a deadline driving the sale (1031 exchange, divorce, estate, relocation)? That informs how much negotiation room exists.
- Schools are B-rated — typically a magnet for longer-tenancy family renters. What's the average tenant stay here, and is there a school-zone premium baked into asking?
- Crime grade is F in this area — have there been break-ins, vandalism, or insurance claims at this property in the last 3 years? What carrier currently insures it and at what premium?
- The area grade is low — what's the realistic commute time and amenity access for the typical tenant pool here? Any planned neighborhood developments (good or bad) we should know about?
- What's the average days-on-market for RENTAL listings here right now (not sales)? A rising rental-DOM trend means longer vacancies and softer asking-rent achievability than the comps imply.
- What's the recent tenant-quality profile in this submarket — average credit score on applications, eviction rate, late-payment / NSF rate, and stable-employment percentage? A property-management company in the area should have these aggregated.
- How much new apartment / multifamily construction is in the pipeline within 1–3 miles? Heavy new supply (>2% of stock underway) typically softens rents 12–24 months out; light construction supports rent growth.
Investment metrics
- 1% rule
- 1.12% ✓
- Cap rate
- 7.58%
- Cash-on-cash
- 4.60%
- DSCR
- 1.20
- GRM
- 7.5
CMA / ARV
- ARV (on-the-fly)
- $205,128
- Comps found
- 5
Show comp detail 5 sales within ~0.75 mi
| Address | Dist | Beds/Ba | Sqft | Sold | Price | $/sf | Match |
|---|---|---|---|---|---|---|---|
| 1 Howard Ave | 0.07mi | 5/3.0 (+1) | 3,256 (+5%) | 16mo | $195,000 | $60 | 66 |
| 152 Elmwood Ave | 0.42mi | 5/2.0 (+1) | 2,952 (-5%) | 6mo | $195,000 | $66 | 62 |
| 389 East Ave | 0.10mi | 4/2.0 | 2,720 (-12%) | 20mo | $215,000 | $79 | 58 |
| 296 Walnut St | 0.49mi | 4/1.5 | 3,250 (+5%) | 19mo | $112,500 | $35 | 52 |
| 453 Market St | 0.41mi | 5/3.0 (+1) | 3,562 (+15%) | 22mo | $267,500 | $75 | 29 |
Match score weights: distance 35% · size 25% · config 20% · recency 20%. Top-matched comps best support the ARV.
Projected returns pro-forma
-3.0% appreciation · 3.67% rent growth · sell at horizon
- IRR
- -8.2%
- Equity multiple
- 0.70×
- Total profit
- $-19,211
- Equity at exit
- $33,548
- IRR
- 2.3%
- Equity multiple
- 1.17×
- Total profit
- $10,804
- Equity at exit
- $19,454
Cash invested: $63,000 (down + closing). Projections, not guarantees.
Landlord ↔ Tenant lean methodology
- Overall (STATE)
- 15 Strongly Tenant-Friendly
- State New York
- 15 Strongly Tenant-Friendly · D+10
- County
- — inherits STATE
- City
- — inherits STATE
ZIP-level market 14094
- Rents YoY
- 3.7%
- Active inventory
- 357
- Price-to-rent
- 14.9×
Monthly cashflow live
- Estimated rent
- $2,512 medium interval (Pro) →
- Mortgage (P&I)
- −$1,180
- Tax from tax record
- −$469 /mo · $5,630/yr
- Insurance
- −$94
- HOA
- −$0
- Vacancy / Maint / Mgmt
- −$528
- Net cashflow
- $242
Break-even live
2-unit breakdown (identical units grouped — click to expand)
| Units | Beds | Baths | Est. rent |
|---|---|---|---|
| 2× units | 2 | 1 | $2,512 |
| #1 | 2 | 1 | $1,256 |
| #2 | 2 | 1 | $1,256 |
| Total (2 units) | $2,512 | ||
UW: 25.0% down · 7.5% · 30yr · 1.5% tax · 5.0% vac · 8.0% maint · 8.0% mgmt
Financing live
Cash to close
- Down payment
- $56,250
- Closing costs
- $6,750
- Reserves months
- —
- Total cash needed
- —
Loan-product check · same deal, 3 products live
Conventional
25% down · 7.5% · 30yr
- Down + closing
- —
- Monthly P&I
- —
- Monthly cashflow
- —
- DSCR
- —
- Eligible?
- —
Personal DTI + credit; lowest rate.
DSCR
20% down · 8.5% · 30yr
- Down + closing
- —
- Monthly P&I
- —
- Monthly cashflow
- —
- DSCR
- —
- Eligible?
- —
No personal income docs; deal must DSCR.
Hard money
10% down · 12.0% · 12mo
- Down + closing
- —
- Monthly P&I
- —
- Monthly cashflow
- —
- DSCR
- —
- Eligible?
- —
Short-term bridge; refi at stabilization.
Listing history 12 events
-
2026-05-20status Pending
-
2026-05-04$225,000 Active
-
2025-05-05historical $1,100
-
2025-05-01$1,100
-
2017-07-20soldstatus $120,000 Closed Sale or Rented 72-char remark
Show marketing remark (72 chars)
Family owned and occupied updated and upgraded double SOLD BEFORE PRINT!
-
2017-07-20soldstatus $120,000
Show marketing remark (72 chars)
Family owned and occupied updated and upgraded double SOLD BEFORE PRINT!
-
2017-05-19status Pending Sale 72-char remark
Show marketing remark (72 chars)
Family owned and occupied updated and upgraded double SOLD BEFORE PRINT!
-
2017-05-19$129,900 Active 72-char remark
Show marketing remark (72 chars)
Family owned and occupied updated and upgraded double SOLD BEFORE PRINT!
-
2014-12-23soldstatus $78,000 602-char remark
Show marketing remark (602 chars)
Old world charm 2 family home w/ 2WBFP's, (NRTC), HRDW thru-out, LR, DR, and covered exterior porch, 3rd fl w/ heatREPLACE RUSTED HOT WATER TANK AND REPAIR DAMAGED PRESSURE RELIEF VALVE ON OTHER HOT WATER TANK 700.00 REPLACE MISSING PORTION OF GUARDRAIL AT BALCONY 200.00 REPAIR ELECTRICAL SYSTEM PER PCR RECOMMENDATION 1,500.00 REPAIR PLUMBING PER PCR RECOMMENDATION 500.00 REPLACE DAMAGED GUTTERS 800.00 REPLACE MISSING HANDRAILS IN ATTIC STAIRS AND LEVEL 2 STAIRCASE 400.00 REPLACE MISSING SHOWERHEADS 100.00 REPLACE MISSING PANE OF GLASS IN 1 WINDOW 100.00 REPLACE MISSING MEDICINE CABINET 300.00
-
2014-12-22soldstatus $78,000
-
2014-10-23$73,000 602-char remark
Show marketing remark (602 chars)
Old world charm 2 family home w/ 2WBFP's, (NRTC), HRDW thru-out, LR, DR, and covered exterior porch, 3rd fl w/ heatREPLACE RUSTED HOT WATER TANK AND REPAIR DAMAGED PRESSURE RELIEF VALVE ON OTHER HOT WATER TANK 700.00 REPLACE MISSING PORTION OF GUARDRAIL AT BALCONY 200.00 REPAIR ELECTRICAL SYSTEM PER PCR RECOMMENDATION 1,500.00 REPAIR PLUMBING PER PCR RECOMMENDATION 500.00 REPLACE DAMAGED GUTTERS 800.00 REPLACE MISSING HANDRAILS IN ATTIC STAIRS AND LEVEL 2 STAIRCASE 400.00 REPLACE MISSING SHOWERHEADS 100.00 REPLACE MISSING PANE OF GLASS IN 1 WINDOW 100.00 REPLACE MISSING MEDICINE CABINET 300.00
-
2002-12-04soldstatus $75,000
ⓘ Source: listings_history table (triggers on properties + properties_extension) + one-shot
backfill from property_details.listing_events for pre-trigger history.
Tax reassessment forecast NY · Partial reset (capped growth)
- Current annual tax
- $5,630 · $469/mo
- Projected year-2 tax
- $5,630 · $469/mo
- Expected delta
- $0/yr ($0/mo · 0.0%)
ⓘ Screening estimate from a state-policy table — verify with the county assessor before closing.
Climate risk First Street
- Flood 1/10 Low FEMA zone X (unshaded) · 0% chance over 30 yrs
- Wildfire 2/10 Low
- Heat 2/10 Low 7 d/yr ≥94°F today · 15 d/yr by 30 yrs out
- Wind 1/10 Low
- Air quality 2/10 Low 1 unhealthy d/yr today · 2 by 30 yrs out
Nearby sold comps map
Loading sold comps map…
Walkable amenities ~0.75 mi
Loading nearby amenities…
Taxation est. · year 1
- Rental income
- $30,144
- − Mortgage interest
- −$12,603
- − Property taxes
- −$5,630
- − Insurance
- −$1,125
- − Repairs & maintenance
- −$2,412
- − Management
- −$2,412
- − Depreciation
- −$6,545
- Taxable loss
- −$583
- Est. tax savings @ 24.0%
- +$140
- After-tax cash flow
- $3,040/yr
For passive investors: Depreciation is non-cash, so a rental often shows a tax loss while cash-flowing — sheltering income. Rental losses are passive: they offset passive income freely, and up to $25,000/yr can offset ordinary (W-2) income if you actively participate and your MAGI is under $100k (phasing out to $0 by $150k); unused losses carry forward. On sale, claimed depreciation is recaptured at up to 25%, and gains may owe capital-gains tax (a 1031 exchange can defer both). Figures are a year-1 estimate at your 24.0% rate — not tax advice; consult a CPA.
Schools (NCES district)
- District
- Lockport City School District
- NCES district ID
- 3617670
- Math proficiency
- 44% ▼ -7.00%
- Reading proficiency
- 49% ▲ 3.00%
- Median HH income
- $43,793
- Composite
- 39.28/100
- National rank
- #3997
- State rank
- #452 of 590 in NY
Livability — Lockport
- Score
- 76/100
- State rank
- #232
- US rank
- #3669
Category grades
Schools grade is shown separately in the Schools card above.
Census & demographics
- Census place
- Lockport, NY
- County
- Niagara County · 157,377 people
- City population
- 50,153
- Metro
- Buffalo-Cheektowaga, NY
- Population (ZIP)
- 50,153
- Household income
- $75,427
- Rent vs Own
- Severe rent burden
- 1112.0
Population outlook (Niagara County) Hauer SSP2
- Today (2025)
- 204,149 people
- By 2030
- 197,900 · -3.1%
- By 2040
- 182,239 · -10.7%
- By 2050
- 165,198 · -19.1%
- By 2075
- 129,416 · -36.6%
- By 2100
- 96,222 · -52.9%
Race, ethnicity, and origin ACS 2023
- Neighborhood character
- Predominantly White (84%)
- Race & ethnicity
- White 84% Two or more races 6% Black 6% Hispanic / Latino 3%
- Common ancestry
- Romanian 9% Slovak 2% Lithuanian 2%
- Foreign-born
- 3% · Canada
- Languages at home
- 96% English-only · Spanish 1% Russian/Polish/Slavic 1% Other Indo-European 1%
Political lean MEDSL · Niagara
- 2024 margin
- R (+14.9) · D 42.5% · R 57.5%
- 2008→2024 swing
- -15.9pp toward R · 2008: 1.0pp · 2024: -14.9pp
- All cycles
- 2024: R+14.9 2020: R+9.7 2016: R+19.0 2012: D+0.6 2008: D+1.0
Not yet ingested
- Civics
- —
Market trends
- HPI YoY
- ▼ -262.57%
- Current HPI
- 303.6109
- Rent YoY
- ▲ 3.67%
- Metro
- Buffalo-Cheektowaga, NY
- State GDP YoY
- ▲ 2.60%
- F500 in state
- 92
Industry mix (Fortune 500 HQ in NY)
| Industry | F500 HQs | Revenue |
|---|---|---|
| Financial Services | 10 | $950B |
|
||
| Consumer Goods | 9 | $162B |
|
||
| Insurance | 4 | $225B |
|
||
| Telecommunications | 2 | $144B |
|
||
| Pharmaceuticals | 2 | $112B |
|
||
| Media / Entertainment | 2 | $69B |
|
||
Price history
+200.0% since first listed12 events — show timeline
- 2026-05-20 Pending — WNYREIS
- 2026-05-04 Listed $225,000 WNYREIS
- 2025-05-05 Rental Removed $1,100 SHOWMOJO2
- 2025-05-01 Listed for Rent $1,100 SHOWMOJO2
- 2017-07-20 Sold (Public Records) $120,000 Public Records
- 2017-07-20 Sold (MLS) $120,000 WNYREIS
- 2017-05-19 Pending — WNYREIS
- 2017-05-19 Listed $129,900 WNYREIS
- 2014-12-23 Sold (MLS) $78,000 WNYREIS
- 2014-12-22 Sold (Public Records) $78,000 Public Records
- 2014-10-23 Listed $73,000 WNYREIS
- 2002-12-04 Sold (Public Records) $75,000 Public Records
Property tax history
+7.3%/yrLatest (2025): $5,630 · +2.5% YoY. Source: county tax records.
Cash-flow waterfall
monthlySold comps — $/sqft
last 12 mo · ≤1 miLoading sold comps…