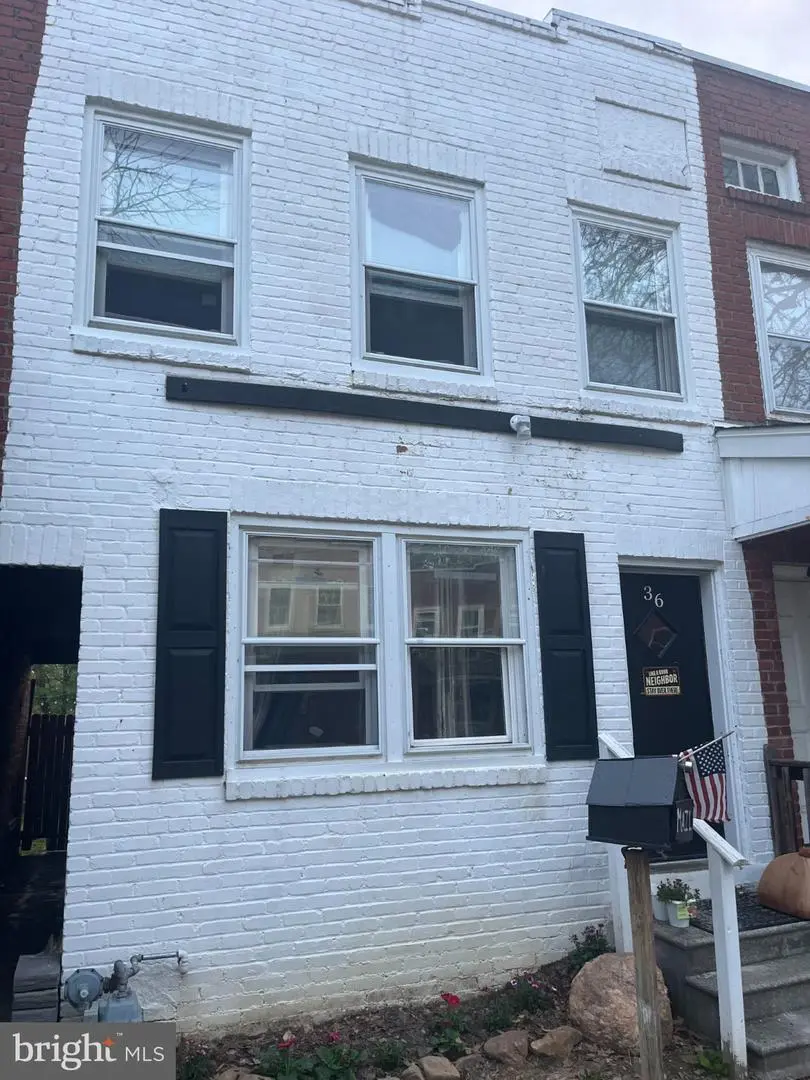
36 Denham Ave · Claymont, DE
Flood risk 1/10 · Minimal
- FEMA flood zone
- X (unshaded)
- Chance of flooding over 30 yrs
- 0.0%
- Est. flood insurance / yr
- $473 – $860
Fire risk 1/10 · Minimal
- Est. fire insurance / yr
- $476 – $884
Heat risk 7/10 · Major
- Hot days now (above 104°F)
- 7 days/yr
- Hot days in 30 yrs
- 15 days/yr
Wind risk 6/10 · Moderate
- Chance of severe wind over 30 yrs
- 27.0%
Air-quality risk 3/10 · Minor
- Unhealthy air days now
- 2 days/yr
- Unhealthy air days in 30 yrs
- 3 days/yr
Risk factors via First Street. Map © Google.
Why this score? — see what drove the B+ grade
The composite is a weighted blend of 9 inputs, each scored 0–100. Each bar is that input's sub-score; the figure is the points it added to the 100-point composite (weight × sub-score).
- Cash flow +30.0/30.0
- ARV discount +15.0/15.0
- DSCR +10.0/10.0
- 1% rule +8.4/10.0
- Livability +3.5/5.0
- Rent growth +3.3/5.0
- Schools +3.1/10.0
- Condition / age +2.5/5.0
- Appreciation +0.0/10.0
$159,000
🖨 Deal sheet (PDF) 📄 Offer letter ✓ Due diligence
Listing remarks MLS
Drop your bags and move right in! 36 Denham is the home you have been waiting for! This brick 3 bedroom/1 bath townhome has been fully renovated for a new owner! Conveniently Located to 95 and 495, minutes to both PA and to Wilmington! This property has a full basement and large back deck as well! All for under 200k!
Key facts
- On-street parking
- Front and rear yards
- Driveway access
Tags
Property features AI
Exterior
- Parking: On-street parking; Driveway access; Alley access
- Utilities: Public water; Public sewer; Natural gas available; Electric available; Cable TV available; Internet options: DSL, Cable, Fiber Optic, Satellite, Fixed Wireless; Hot water: electric
- Home design: Interior townhouse/rowhouse; Fee simple ownership
- Construction: Brick construction; Block foundation; Above-grade structures
- Exterior features: Front yard, rear yard and landscaping
Interior
- Bedrooms: Three bedrooms on the main level
- Bathrooms: One full bathroom on the main level
- Heating & cooling: 90% forced air heating (natural gas); Window AC units (electric)
- Interior features: Partially finished full basement; Estimated living area
Neighborhood map
What this means for you Summary
Snapshot
- This is a 3-bed/1.0-bath townhouse listed at $159k.
Deal economics
- At list price, monthly cash flow is $692 ($8k/yr) — positive.
- The deal already cash-flows at list — no discount required.
- Meets the 1% rule at list price ($2k rent vs $159k).
- Recommended offer: $154k (3.0% below list) — sets the bar for market timing.
- Cap rate 11.5% vs local median 4.8% in Claymont — top-decile yield for the area; either an underpriced asset or a hidden risk that comps aren't pricing in. Stress-test before assuming the spread holds.
Location & tenants
- Location reads 69/100 on livability (#25 in DE) — a middle-class / working-renter tenant base. Strengths: cost of living A+, housing A+; Watch: amenities F, commute F.
- Brandywine School District (suburban): math 28% / reading 40% proficiency, ranked #11 of 26 in DE (top 42%) — families likely to look elsewhere, expect single-tenant / working-renter base with shorter leases.
- Zoned schools: Claymont Elementary School (math 38% / reading 43%, grade F, #25 of 105 statewide, top 26%, 850 students, 0% FRL); Talley Middle School (math 17% / reading 27%, grade F, #26 of 36 statewide, top 71%, 841 students, 0% FRL); Brandywine High School (math 32% / reading 47%, grade F, #12 of 40 statewide, top 31%, 950 students, 0% FRL) — zoned schools average 0% FRL vs 38% district-wide (38 pts lower); this property's tenant base skews higher-income than the district average.
- Market conditions: Rents rising (+3.1%/yr); 35 active listings in the ZIP; 11 comparable units currently listed for rent nearby; rentals leasing fast (median 0d on market — plan ~1-2 weeks tenant-placement turnaround); solid renter incomes; 1,367 units permitted in New Castle County in 2024 (201 in 5+ unit buildings).
Forward outlook
- Local home prices are declining (-3.0%/yr); year-one equity from $1k of loan paydown is wiped out by about $5k of value loss. Plan a longer hold.
- New Castle County population projected at +9% by 2050 — modest demand growth; plan on rents tracking national, not racing it.
- At projected returns (-3.0% appreciation + 3.1% rent growth), your $45k cash investment doubles in ~7 years — after that, you're playing with house money.
Negotiation context
- It's been on market 40 days — a 3% lower offer ($154k) is reasonable based on typical stale-listing flexibility.
- 6 sale attempts since 31y ago; this cycle's ask has dropped $40k (20%) from the opening price — seller is motivated, your offer sets the floor, not the list.
- Current owner paid $136k; 17% above their basis — modest negotiation headroom, anchor on the comps not their cost.
Risks & watch-outs
- Watch-outs: built in 1920 — expect roof / HVAC / electrical / plumbing capex.
- Climate carrying-cost: major wind risk, 27% chance of damaging wind over 30y; extreme-heat days projected 7→15/yr by 2055 (HVAC capex compounding) — expect insurance premiums to compound above CPI over the hold.
Questions for the listing agent
- It's been on market 40 days. Have you received any prior offers? Is the seller open to a 3% concession, seller financing, or rate buy-down credit?
- Built in 1920 — when were the roof, HVAC, electrical panel, plumbing, and water heater last replaced?
- Is there a deadline driving the sale (1031 exchange, divorce, estate, relocation)? That informs how much negotiation room exists.
- What's the average days-on-market for RENTAL listings here right now (not sales)? A rising rental-DOM trend means longer vacancies and softer asking-rent achievability than the comps imply.
- What's the recent tenant-quality profile in this submarket — average credit score on applications, eviction rate, late-payment / NSF rate, and stable-employment percentage? A property-management company in the area should have these aggregated.
- How much new for-sale + rental construction is in the pipeline within 1–3 miles? Heavy new supply typically softens prices + rents 12–24 months out; constrained supply supports both.
Investment metrics
- 1% rule
- 1.34% ✓
- Cap rate
- 11.52%
- Cash-on-cash
- 18.65%
- DSCR
- 1.83
- GRM
- 6.2
CMA / ARV
- ARV (median comp)
- $234,436
- List price
- $159,000
- Delta
- -32.18%
- Verdict
- UNDERPRICED
- Comps
- 20 within 1.0 mi
Show comp detail 11 sales within ~0.75 mi
| Address | Dist | Beds/Ba | Sqft | Sold | Price | $/sf | Match |
|---|---|---|---|---|---|---|---|
| 26 Denham Ave | 0.02mi | 3/1.0 | 1,125 (0%) | 5mo | $200,000 | $178 | 95 |
| 11 Denham Ave | 0.06mi | 3/1.5 | 1,233 (+10%) | 3mo | $214,000 | $174 | 77 |
| 22 Denham Ave | 0.03mi | 3/2.0 | 1,175 (+4%) | 14mo | $230,000 | $196 | 75 |
| 18 Denham Ave | 0.03mi | 3/1.0 | 1,275 (+13%) | 8mo | $220,000 | $173 | 70 |
| 12 Denham Ave | 0.04mi | 3/1.5 | 1,175 (+4%) | 23mo | $230,000 | $196 | 70 |
| 1126 Sterling Ave | 0.69mi | 3/1.0 | 1,130 (+0%) | 2mo | $160,000 | $142 | 66 |
| 10 Woodfield Dr | 0.56mi | 2/1.5 (-1) | 1,150 (+2%) | 7mo | $250,000 | $217 | 57 |
| 1118 Sterling | 0.70mi | 3/1.0 | 1,005 (-11%) | 9mo | $130,000 | $129 | 42 |
| 715 Peachtree Rd | 0.73mi | 3/1.5 | 1,273 (+13%) | 9mo | $280,000 | $220 | 34 |
| 1116 Sterling Ave | 0.71mi | 3/1.0 | 1,005 (-11%) | 18mo | $145,000 | $144 | 34 |
| 46 Woodfield Dr | 0.58mi | 3/1.5 | 1,275 (+13%) | 19mo | $276,000 | $216 | 33 |
Match score weights: distance 35% · size 25% · config 20% · recency 20%. Top-matched comps best support the ARV.
Projected returns pro-forma
-3.0% appreciation · 3.13% rent growth · sell at horizon
- IRR
- 10.5%
- Equity multiple
- 1.42×
- Total profit
- $18,554
- Equity at exit
- $23,707
- IRR
- 19.7%
- Equity multiple
- 2.66×
- Total profit
- $73,906
- Equity at exit
- $13,747
Cash invested: $44,520 (down + closing). Projections, not guarantees.
Landlord ↔ Tenant lean methodology
- Overall (STATE)
- 70 Landlord-Friendly
- State Delaware
- 70 Landlord-Friendly · D+7
- County
- — inherits STATE
- City
- — inherits STATE
ZIP-level market 19703
- Rents YoY
- 3.1%
- Active inventory
- 35
- Price-to-rent
- 6.2×
Monthly cashflow live
- Estimated rent
- $2,123 high interval (Pro) →
- Mortgage (P&I)
- −$834
- Tax from tax record
- −$85 /mo · $1,025/yr
- Insurance
- −$66
- HOA
- −$0
- Lot rent
- −$0
- Vacancy / Maint / Mgmt
- −$446
- Net cashflow
- $692
Break-even live
Sensitivity live
| Price | -10% $782 | -5% $737 | +0% $692 | +5% $647 | +10% $602 |
|---|---|---|---|---|---|
| Rent | -10% $524 | -5% $608 | +0% $692 | +5% $776 | +10% $860 |
| Rate | -1.0pp $772 | -0.5pp $733 | base $692 | +0.5pp $651 | +1.0pp $609 |
UW: 25.0% down · 7.5% · 30yr · 1.5% tax · 5.0% vac · 8.0% maint · 8.0% mgmt
Financing live
Cash to close
- Down payment
- $39,750
- Closing costs
- $4,770
- Reserves months
- —
- Total cash needed
- —
Loan-product check · same deal, 3 products live
Conventional
25% down · 7.5% · 30yr
- Down + closing
- —
- Monthly P&I
- —
- Monthly cashflow
- —
- DSCR
- —
- Eligible?
- —
Personal DTI + credit; lowest rate.
DSCR
20% down · 8.5% · 30yr
- Down + closing
- —
- Monthly P&I
- —
- Monthly cashflow
- —
- DSCR
- —
- Eligible?
- —
No personal income docs; deal must DSCR.
Hard money
10% down · 12.0% · 12mo
- Down + closing
- —
- Monthly P&I
- —
- Monthly cashflow
- —
- DSCR
- —
- Eligible?
- —
Short-term bridge; refi at stabilization.
Rent comps 11 comps
| Address | Beds | Baths | Sqft | Rent | $/sqft | DOM | Units | Dist |
|---|---|---|---|---|---|---|---|---|
| 2003 Flathers Way Unit M79 Claymont, DE | 2.0 | 2.0 | 1350 | $2,350 | $1.74 | 7d | 1 | 0.48mi |
| 700 Darley Green Dr Claymont, DE | 1.0–3.0 | 1.0–2.0 | 1195 | $2,800 | $2.34 | 0d | 1 | 0.56mi |
| 237 Ridge Rd Claymont, DE | 2.0 | 1.0 | 950 | $1,700 | $1.79 | 24d | 1 | 0.58mi |
| 1000 Cedartree Ln Claymont, DE | 3.0 | 1.0–2.0 | 905 | $1,900 | $2.10 | 0d | 12 | 0.63mi |
| 749 Montclair Dr Claymont, DE | 1.0–2.0 | 1.0–1.5 | 900 | $1,747 | $1.94 | 0d | 6 | 0.65mi |
| 915 Cedartree Ln Claymont, DE | 1.0–2.0 | 1.0–1.5 | 850 | $1,900 | $2.24 | 0d | 19 | 0.66mi |
| 163 Wiltshire Rd Claymont, DE | 3.0 | 2.0 | 1125 | $2,050 | $1.82 | 0d | 1 | 0.82mi |
| 3131 Meetinghouse Rd Upper Chichester, PA | 1.0–3.0 | 1.0–2.5 | 945 | $2,644 | $2.80 | 0d | 21 | 0.90mi |
| 2726 Jacqueline Dr Wilmington, DE | 1.0–2.0 | 1.0–2.0 | 675 | $1,675 | $2.48 | 1d | 24 | 1.03mi |
| 2601 Carpenter Station Rd Wilmington, DE | 1.0–3.0 | 1.0–2.5 | 1405 | $2,600 | $1.85 | 0d | 17 | 1.04mi |
| 2616 Philadelphia Pike Claymont, DE | 2.0 | 1.0 | 888 | $1,655 | $1.86 | 0d | 5 | 1.48mi |
Listing history 27 events
-
2026-06-09days on market $159,000 Active 40 DOM
-
2026-06-08days on market $159,000 Active 39 DOM
-
2026-06-07days on market $159,000 Active 38 DOM
-
2026-06-04days on market $159,000 Active 35 DOM
-
2026-06-03days on market $159,000 Active 34 DOM
-
2026-06-02days on market $159,000 Active 33 DOM
-
2026-06-01days on market $159,000 Active 32 DOM
-
2026-05-31days on market $159,000 Active 31 DOM
-
2026-05-04status Active 1446-char remark
-
2026-04-27price $175,000 1446-char remark
-
2026-04-27status Active 1446-char remark
-
2026-04-27historical 1446-char remark
-
2026-04-23historical 1446-char remark
-
2026-04-20$199,000 Active 1446-char remark
-
2022-11-07soldstatus $136,000
-
2022-10-15soldstatus $170,000 Closed 318-char remark
Show marketing remark (318 chars)
Drop your bags and move right in! 36 Denham is the home you have been waiting for! This brick 3 bedroom/1 bath townhome has been fully renovated for a new owner! Conveniently Located to 95 and 495, minutes to both PA and to Wilmington! This property has a full basement and large back deck as well! All for under 200k!
-
2022-08-08status Pending 318-char remark
Show marketing remark (318 chars)
Drop your bags and move right in! 36 Denham is the home you have been waiting for! This brick 3 bedroom/1 bath townhome has been fully renovated for a new owner! Conveniently Located to 95 and 495, minutes to both PA and to Wilmington! This property has a full basement and large back deck as well! All for under 200k!
-
2022-08-01$168,888 Active 318-char remark
Show marketing remark (318 chars)
Drop your bags and move right in! 36 Denham is the home you have been waiting for! This brick 3 bedroom/1 bath townhome has been fully renovated for a new owner! Conveniently Located to 95 and 495, minutes to both PA and to Wilmington! This property has a full basement and large back deck as well! All for under 200k!
-
2022-07-20price $179,900
-
2022-07-20historical
-
2022-07-16price $164,900
-
2022-07-09price $174,900
-
2022-06-28price $179,900
-
2022-06-25price $188,888
-
2022-06-10$199,000 Active
-
1996-03-27historical
-
1995-03-27$39,900
ⓘ Source: listings_history table (triggers on properties + properties_extension) + one-shot
backfill from property_details.listing_events for pre-trigger history.
Tax reassessment forecast DE · Partial reset (capped growth)
- Current annual tax
- $1,025 · $85/mo
- Projected year-2 tax
- $1,025 · $85/mo
- Expected delta
- $0/yr ($0/mo · 0.0%)
ⓘ Screening estimate from a state-policy table — verify with the county assessor before closing.
Climate risk First Street
- Flood 1/10 Low FEMA zone X (unshaded) · 0% chance over 30 yrs
- Wildfire 1/10 Low
- Heat 7/10 Severe 7 d/yr ≥104°F today · 15 d/yr by 30 yrs out
- Wind 6/10 Major 27% chance of damaging wind over 30 yrs
- Air quality 3/10 Moderate 2 unhealthy d/yr today · 3 by 30 yrs out
Nearby sold comps map
Loading sold comps map…
Walkable amenities ~0.75 mi
Loading nearby amenities…
Taxation est. · year 1
- Rental income
- $25,481
- − Mortgage interest
- −$8,906
- − Property taxes
- −$1,025
- − Insurance
- −$795
- − Repairs & maintenance
- −$2,039
- − Management
- −$2,039
- − Depreciation
- −$4,625
- Taxable income
- $6,053
- Est. tax owed @ 24.0%
- −$1,453
- After-tax cash flow
- $6,852/yr
For passive investors: Depreciation is non-cash, so a rental often shows a tax loss while cash-flowing — sheltering income. Rental losses are passive: they offset passive income freely, and up to $25,000/yr can offset ordinary (W-2) income if you actively participate and your MAGI is under $100k (phasing out to $0 by $150k); unused losses carry forward. On sale, claimed depreciation is recaptured at up to 25%, and gains may owe capital-gains tax (a 1031 exchange can defer both). Figures are a year-1 estimate at your 24.0% rate — not tax advice; consult a CPA.
Schools (NCES district)
- District
- Brandywine School District
- NCES district ID
- 1001240
- Math proficiency
- 28% ▼ -13.00%
- Reading proficiency
- 40% ▼ -13.00%
- Median HH income
- $68,743
- Composite
- 31.27/100
- National rank
- #6019
- State rank
- #11 of 26 in DE
Livability — Claymont
- Score
- 69/100
- State rank
- #25
- US rank
- #8408
Category grades
Schools grade is shown separately in the Schools card above.
Census & demographics
- Census place
- Claymont, DE
- County
- New Castle County · 483,412 people
- City population
- 15,460
- Metro
- Philadelphia-Camden-Wilmington, PA-NJ-DE-MD
- Population (ZIP)
- 15,460
- Household income
- $76,939
- Rent vs Own
- Severe rent burden
- 577.0
Population outlook (New Castle County) Hauer SSP2
- Today (2025)
- 594,686 people
- By 2030
- 609,164 · +2.4%
- By 2040
- 632,154 · +6.3%
- By 2050
- 649,068 · +9.1%
- By 2075
- 687,771 · +15.7%
- By 2100
- 694,961 · +16.9%
Race, ethnicity, and origin ACS 2023
- Neighborhood character
- Diverse neighborhood (Simpson 0.64)
- Race & ethnicity
- White 53% Black 26% Hispanic / Latino 9% Asian 8% Two or more races 6%
- Hispanic origin (detail)
- Mexican 1% Puerto Rican 4%
- Common ancestry
- Romanian 5% Lithuanian 2% Italian 2%
- Foreign-born
- 12% · Canada, China
- Languages at home
- 84% English-only · Spanish 6% Other Indo-European 5% Chinese 1%
Political lean MEDSL · New Castle
- 2024 margin
- Solid D (+32.6) · D 65.5% · R 32.9% · Other 1.6%
- 2008→2024 swing
- -8.1pp toward R · 2008: 40.6pp · 2024: 32.6pp
- All cycles
- 2024: D+32.6 2020: D+37.1 2016: D+29.6 2012: D+34.1 2008: D+40.6
Not yet ingested
- Civics
- —
Market trends
- HPI YoY
- ▼ -148.17%
- Current HPI
- 265.6693
- Rent YoY
- ▲ 3.13%
- Metro
- Philadelphia-Camden-Wilmington, PA-NJ-DE-MD
- State GDP YoY
- —
- F500 in state
- 0
Price history
+298.5% since first listed21 events — show timeline
- 2026-06-11 Listing Removed — BRIGHT MLS
- 2026-05-23 Price Changed $159,000 BRIGHT MLS
- 2026-05-04 Relisted — BRIGHT MLS
- 2026-04-27 Price Changed $175,000 BRIGHT MLS
- 2026-04-27 Relisted — BRIGHT MLS
- 2026-04-27 Listing Removed — BRIGHT MLS
- 2026-04-23 Listing Removed — BRIGHT MLS
- 2026-04-20 Listed $199,000 BRIGHT MLS
- 2022-11-07 Sold (Public Records) $136,000 Public Records
- 2022-10-15 Sold (MLS) $170,000 BRIGHT MLS
- 2022-08-08 Pending — BRIGHT MLS
- 2022-08-01 Listed $168,888 BRIGHT MLS
- 2022-07-20 Price Changed $179,900 BRIGHT MLS
- 2022-07-20 Listing Removed — BRIGHT MLS
- 2022-07-16 Price Changed $164,900 BRIGHT MLS
- 2022-07-09 Price Changed $174,900 BRIGHT MLS
- 2022-06-28 Price Changed $179,900 BRIGHT MLS
- 2022-06-25 Price Changed $188,888 BRIGHT MLS
- 2022-06-10 Listed $199,000 BRIGHT MLS
- 1996-03-27 Listing Removed — BRIGHT MLS
- 1995-03-27 Listed $39,900 BRIGHT MLS
Property tax history
+4.8%/yrLatest (2024): $1,025 · +49.2% YoY. Source: county tax records.
Cash-flow waterfall
monthlySold comps — $/sqft
last 12 mo · ≤1 miLoading sold comps…