 Multi-family
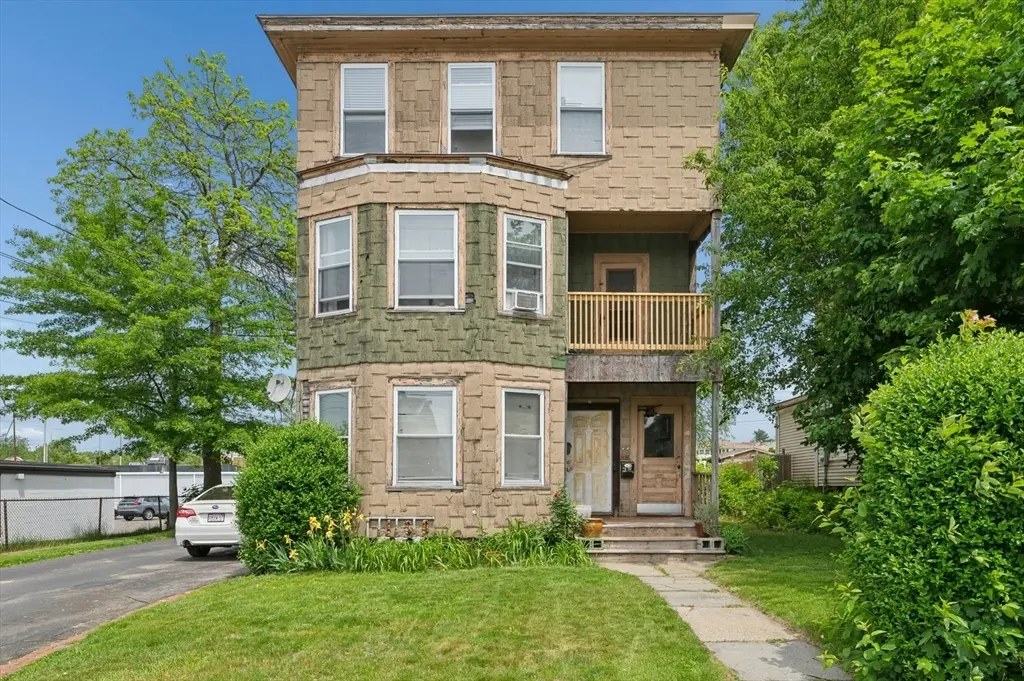
1 Summerhill Ave · Worcester, MA
Flood risk 1/10 · Minimal
- FEMA flood zone
- X (unshaded)
- Chance of flooding over 30 yrs
- 0.0%
- Est. flood insurance / yr
- $473 – $860
Fire risk 1/10 · Minimal
- Est. fire insurance / yr
- $915 – $1,699
Heat risk 4/10 · Minor
- Hot days now (above 94°F)
- 7 days/yr
- Hot days in 30 yrs
- 17 days/yr
Wind risk 6/10 · Moderate
- Chance of severe wind over 30 yrs
- 27.0%
Air-quality risk 2/10 · Minimal
- Unhealthy air days now
- 1 days/yr
- Unhealthy air days in 30 yrs
- 2 days/yr
Risk factors via First Street. Map © Google.
Why this score? — see what drove the B grade
The composite is a weighted blend of 9 inputs, each scored 0–100. Each bar is that input's sub-score; the figure is the points it added to the 100-point composite (weight × sub-score).
- Cash flow +27.4/30.0
- ARV discount +15.0/15.0
- DSCR +9.5/10.0
- 1% rule +7.0/10.0
- Livability +4.4/5.0
- Rent growth +3.6/5.0
- Condition / age +2.5/5.0
- Schools +2.0/10.0
- Appreciation +0.0/10.0
$599,900
🖨 Deal sheet (PDF) 📄 Offer letter ✓ Due diligence
Multi-family units
County records classify this as Multi-Family (2-4 Unit). Listing-text estimate: 1 unit. estimate disagrees with records
Listing remarks
BUSINESS ZONED multi-unit property has 3 separate 3 bedroom and one bathroom units with 6 deeded off-street parking spaces with additional public street parking as well. Low maintenance small back yard makes for a wonderful urban garden, grilling area and simply a nice place to gather for entertaining. The units have hardwood floors, in-unit laundry hook-ups and gas heat. Gas parlor heater as well as gas on gas in kitchen is what heat each unit. Tenants pay own gas and electricity. Landlord pays water & sewer and landlord meter. A block from Rt. 12 with access to shopping and public transportation. Property is a great commuter location just one block to Rt. 12 and close to Rt. 190, Rt
Key facts
- Commuter location
- Urban garden
- Grilling area
Tags
Property features AI
Finance
- Other: Property address: 1 Summerhill Ave, Worcester MA 01606; Building area reported as 3,798 (above grade finished area)
- HOA & community: Community features include public transportation, shopping, parks, golf, medical facility, laundromat, highway access, places of worship, private and public schools, T-Station, and university access; Not a senior community
Exterior
- Parking: 6 total parking spaces; Open parking; Paved drive; Off-street parking; Deeded parking
- Utilities: Public water; Public sewer; Electric with circuit breakers
- Home design: 3-family building (3 units up/down); 3 stories total; Approximate year built (public records); Green/tan exterior color
- Construction: Frame construction; Concrete perimeter and stone foundation
- Exterior features: Cleared, level lot; 60 ft frontage; Public road frontage on a paved, publicly maintained road; Shingle roof; Paved driveway
Interior
- Kitchen: Kitchen included in unit layouts
- Bedrooms: Multiple units with bedrooms across three levels (unit-level details available)
- Bathrooms: 3 full bathrooms
- Heating & cooling: Natural gas heating; 6 heating units; No central cooling units reported
- Interior features: Living room; Dining room; Kitchen; Laundry room; Insulated doors; Insulated windows; 18 total rooms
- Laundry & utility: Laundry room
Neighborhood map
What this means for you Summary
Snapshot
- This is a 9-bed/3.0-bath multifamily listed at $600k.
Deal economics
- At list price, monthly cash flow is $2k ($21k/yr) — positive.
- The deal already cash-flows at list — no discount required.
- Meets the 1% rule at list price ($7k rent vs $600k).
- Recommended offer: $591k (1.5% below list) — sets the bar for market timing.
- Cap rate 9.8% vs local median 4.1% in Worcester — top-decile yield for the area; either an underpriced asset or a hidden risk that comps aren't pricing in. Stress-test before assuming the spread holds.
Location & tenants
- Location reads 87/100 on livability (#9 in MA, #312 nationally) — a professional / high-income tenant draw. Strengths: crime A+, amenities A+, commute A+; Watch: cost of living D.
- Worcester (urban): math 17% / reading 30% proficiency, ranked #280 of 302 in MA (top 93%) — low school quality limits family demand, transient renter base, plan for 1-2y turnover; 66% free/reduced lunch — lower-income household profile, screen leases tightly.
- Zoned schools: Chandler Magnet (math 12% / reading 17%, grade F, #873 of 938 statewide, top 94%, 402 students, 0% FRL); Burncoat Middle School (math 20% / reading 26%, grade F, #243 of 305 statewide, top 80%, 712 students, 0% FRL); Burncoat Senior High (math 22% / reading 37%, grade F, #270 of 343 statewide, top 80%, 1,179 students, 0% FRL) — zoned schools average 0% FRL vs 66% district-wide (66 pts lower); this property's tenant base skews higher-income than the district average.
- Market conditions: Rents rising fast (+4.5%/yr); 26 active listings in the ZIP; solid renter incomes; 2,293 units permitted in Worcester County in 2024 (1,205 in 5+ unit buildings).
- At $7,194/mo this rent would consume 94% of the median local household income ($92k/yr) (locally 634% of renters already pay >50% of income on rent) — very limited rent-growth headroom before tenants either downsize or default.
Forward outlook
- Local home prices are declining (-3.0%/yr); year-one equity from $4k of loan paydown is wiped out by about $18k of value loss. Plan a longer hold.
- At projected returns (-3.0% appreciation + 4.5% rent growth), your $168k cash investment doubles in ~9 years — after that, you're playing with house money.
Negotiation context
- It's been on market 23 days — a 2% lower offer ($591k) is reasonable based on typical stale-listing flexibility.
Risks & watch-outs
- Watch-outs: built in 1890 — expect roof / HVAC / electrical / plumbing capex.
- Climate carrying-cost: major wind risk, 27% chance of damaging wind over 30y — expect insurance premiums to compound above CPI over the hold.
Questions for the listing agent
- Built in 1890 — when were the roof, HVAC, electrical panel, plumbing, and water heater last replaced?
- Is there a deadline driving the sale (1031 exchange, divorce, estate, relocation)? That informs how much negotiation room exists.
- What's the average days-on-market for RENTAL listings here right now (not sales)? A rising rental-DOM trend means longer vacancies and softer asking-rent achievability than the comps imply.
- What's the recent tenant-quality profile in this submarket — average credit score on applications, eviction rate, late-payment / NSF rate, and stable-employment percentage? A property-management company in the area should have these aggregated.
- How much new apartment / multifamily construction is in the pipeline within 1–3 miles? Heavy new supply (>2% of stock underway) typically softens rents 12–24 months out; light construction supports rent growth.
Investment metrics
- 1% rule
- 1.20% ✓
- Cap rate
- 9.79%
- Cash-on-cash
- 12.47%
- DSCR
- 1.55
- GRM
- 6.9
CMA / ARV
- ARV (on-the-fly)
- $892,530
- Comps found
- 2
Show comp detail 2 sales within ~0.75 mi
| Address | Dist | Beds/Ba | Sqft | Sold | Price | $/sf | Match |
|---|---|---|---|---|---|---|---|
| 8 Summerhill Ave | 0.05mi | 9/3.0 | 3,660 (-4%) | 15mo | $860,000 | $235 | 79 |
| 11 Mattson Ave | 0.61mi | 9/4.0 | 3,323 (-12%) | 8mo | $656,000 | $197 | 40 |
Match score weights: distance 35% · size 25% · config 20% · recency 20%. Top-matched comps best support the ARV.
Projected returns pro-forma
-3.0% appreciation · 4.46% rent growth · sell at horizon
- IRR
- 3.7%
- Equity multiple
- 1.15×
- Total profit
- $24,692
- Equity at exit
- $89,447
- IRR
- 14.6%
- Equity multiple
- 2.25×
- Total profit
- $209,935
- Equity at exit
- $51,868
Cash invested: $167,972 (down + closing). Projections, not guarantees.
Landlord ↔ Tenant lean methodology
- Overall (STATE)
- 20 Strongly Tenant-Friendly
- State Massachusetts
- 20 Strongly Tenant-Friendly · D+15
- County
- — inherits STATE
- City
- — inherits STATE
ZIP-level market 01606
- Rents YoY
- 4.5%
- Active inventory
- 26
- Price-to-rent
- 20.8×
Monthly cashflow live
- Estimated rent
- $7,194 high interval (Pro) →
- Mortgage (P&I)
- −$3,146
- Tax from tax record
- −$541 /mo · $6,497/yr
- Insurance
- −$250
- HOA
- −$0
- Vacancy / Maint / Mgmt
- −$1,511
- Net cashflow
- $1,746
Break-even live
Sensitivity live
| Price | -10% $2,086 | -5% $1,916 | +0% $1,746 | +5% $1,576 | +10% $1,406 |
|---|---|---|---|---|---|
| Rent | -10% $1,178 | -5% $1,462 | +0% $1,746 | +5% $2,030 | +10% $2,314 |
| Rate | -1.0pp $2,048 | -0.5pp $1,899 | base $1,746 | +0.5pp $1,590 | +1.0pp $1,432 |
3-unit breakdown (identical units grouped — click to expand)
| Units | Beds | Baths | Est. rent |
|---|---|---|---|
| 3× units | 3 | 1 | $7,194 |
| #1 | 3 | 1 | $2,398 |
| #2 | 3 | 1 | $2,398 |
| #3 | 3 | 1 | $2,398 |
| Total (3 units) | $7,194 | ||
UW: 25.0% down · 7.5% · 30yr · 1.5% tax · 5.0% vac · 8.0% maint · 8.0% mgmt
Financing live
Cash to close
- Down payment
- $149,975
- Closing costs
- $17,997
- Reserves months
- —
- Total cash needed
- —
Loan-product check · same deal, 3 products live
Conventional
25% down · 7.5% · 30yr
- Down + closing
- —
- Monthly P&I
- —
- Monthly cashflow
- —
- DSCR
- —
- Eligible?
- —
Personal DTI + credit; lowest rate.
DSCR
20% down · 8.5% · 30yr
- Down + closing
- —
- Monthly P&I
- —
- Monthly cashflow
- —
- DSCR
- —
- Eligible?
- —
No personal income docs; deal must DSCR.
Hard money
10% down · 12.0% · 12mo
- Down + closing
- —
- Monthly P&I
- —
- Monthly cashflow
- —
- DSCR
- —
- Eligible?
- —
Short-term bridge; refi at stabilization.
Listing history 16 events
-
2026-06-22days on market $599,900 Active 23 DOM
-
2026-06-18days on market $599,900 Active 20 DOM
-
2026-06-17days on market $599,900 Active 19 DOM
-
2026-06-16days on market $599,900 Active 18 DOM
-
2026-06-15days on market $599,900 Active 17 DOM
-
2026-06-14days on market $599,900 Active 15 DOM
-
2026-06-10days on market $599,900 Active 12 DOM
-
2026-06-09days on market $599,900 Active 11 DOM
-
2026-06-08days on market $599,900 Active 10 DOM
-
2026-06-07days on market $599,900 Active 9 DOM
-
2026-06-05days on market $599,900 Active 6 DOM
-
2026-06-03days on market $599,900 Active 5 DOM
-
2026-06-02statusdays on market $599,900 Active 4 DOM
-
2026-06-01days on market $599,900 New 3 DOM
-
2026-05-31days on market $599,900 New 2 DOM
-
2026-05-29$599,900 New
ⓘ Source: listings_history table (triggers on properties + properties_extension) + one-shot
backfill from property_details.listing_events for pre-trigger history.
Tax reassessment forecast MA · Partial reset (capped growth)
- Current annual tax
- $6,497 · $541/mo
- Projected year-2 tax
- $6,938 · $578/mo
- Expected delta
- +$441/yr (+$37/mo · 6.8%)
ⓘ Screening estimate from a state-policy table — verify with the county assessor before closing.
Climate risk First Street
- Flood 1/10 Low FEMA zone X (unshaded) · 0% chance over 30 yrs
- Wildfire 1/10 Low
- Heat 4/10 Moderate 7 d/yr ≥94°F today · 17 d/yr by 30 yrs out
- Wind 6/10 Major 27% chance of damaging wind over 30 yrs
- Air quality 2/10 Low 1 unhealthy d/yr today · 2 by 30 yrs out
Nearby sold comps map
Loading sold comps map…
Walkable amenities ~0.75 mi
Loading nearby amenities…
Taxation est. · year 1
- Rental income
- $86,328
- − Mortgage interest
- −$33,604
- − Property taxes
- −$6,497
- − Insurance
- −$3,000
- − Repairs & maintenance
- −$6,906
- − Management
- −$6,906
- − Depreciation
- −$17,452
- Taxable income
- $11,964
- Est. tax owed @ 24.0%
- −$2,871
- After-tax cash flow
- $18,080/yr
For passive investors: Depreciation is non-cash, so a rental often shows a tax loss while cash-flowing — sheltering income. Rental losses are passive: they offset passive income freely, and up to $25,000/yr can offset ordinary (W-2) income if you actively participate and your MAGI is under $100k (phasing out to $0 by $150k); unused losses carry forward. On sale, claimed depreciation is recaptured at up to 25%, and gains may owe capital-gains tax (a 1031 exchange can defer both). Figures are a year-1 estimate at your 24.0% rate — not tax advice; consult a CPA.
Schools (NCES district)
- District
- Worcester
- NCES district ID
- 2513230
- Math proficiency
- 17% ▼ -15.00%
- Reading proficiency
- 30% ▼ -8.00%
- Median HH income
- $45,063
- Composite
- 20.3/100
- National rank
- #8615
- State rank
- #280 of 302 in MA
Livability — Worcester
- Score
- 87/100
- State rank
- #9
- US rank
- #312
Category grades
Schools grade is shown separately in the Schools card above.
Census & demographics
- Census place
- Worcester, MA
- County
- Worcester County · 487,911 people
- City population
- 207,324
- Metro
- Worcester, MA-CT
- Population (ZIP)
- 22,844
- Household income
- $92,105
- Rent vs Own
- Severe rent burden
- 634.0
Population outlook (Worcester County) Hauer SSP2
- Today (2025)
- 850,858 people
- By 2030
- 860,403 · +1.1%
- By 2040
- 869,902 · +2.2%
- By 2050
- 869,110 · +2.1%
- By 2075
- 870,120 · +2.3%
- By 2100
- 829,703 · -2.5%
Race, ethnicity, and origin ACS 2023
- Neighborhood character
- Diverse neighborhood (Simpson 0.56)
- Race & ethnicity
- White 64% Hispanic / Latino 14% Two or more races 12% Black 9% Asian 5%
- Hispanic origin (detail)
- Puerto Rican 6% Dominican 2%
- Common ancestry
- Romanian 7% Lithuanian 6% Estonian 2%
- Foreign-born
- 14% · Canada, Vietnam, China
- Languages at home
- 76% English-only · Spanish 10% Other Indo-European 4% Vietnamese 3%
Political lean MEDSL · Worcester
- 2024 margin
- D (+10.0) · D 53.9% · R 43.9% · Other 2.2%
- 2008→2024 swing
- -3.8pp toward R · 2008: 13.8pp · 2024: 10.0pp
- All cycles
- 2024: D+10.0 2020: D+17.8 2016: D+10.5 2012: D+9.2 2008: D+13.8
Not yet ingested
- Civics
- —
Market trends
- HPI YoY
- ▼ -240.84%
- Current HPI
- 295.2937
- Rent YoY
- ▲ 4.46%
- Metro
- Worcester, MA-CT
- State GDP YoY
- ▲ 2.28%
- F500 in state
- 38
Industry mix (Fortune 500 HQ in MA)
| Industry | F500 HQs | Revenue |
|---|---|---|
| Technology | 3 | $17B |
|
||
| Insurance | 2 | $84B |
|
||
| Retail | 2 | $76B |
|
||
| Life Sciences | 1 | $43B |
|
||
| Energy Technology | 1 | $31B |
|
||
| Aerospace / Defense | 1 | $18B |
|
||
Price history
1 event — show timeline
- 2026-05-29 Listed $599,900 MLS PIN
Property tax history
+4.8%/yrLatest (2023): $6,497 · +15.1% YoY. Source: county tax records.
Cash-flow waterfall
monthlySold comps — $/sqft
last 12 mo · ≤1 miLoading sold comps…