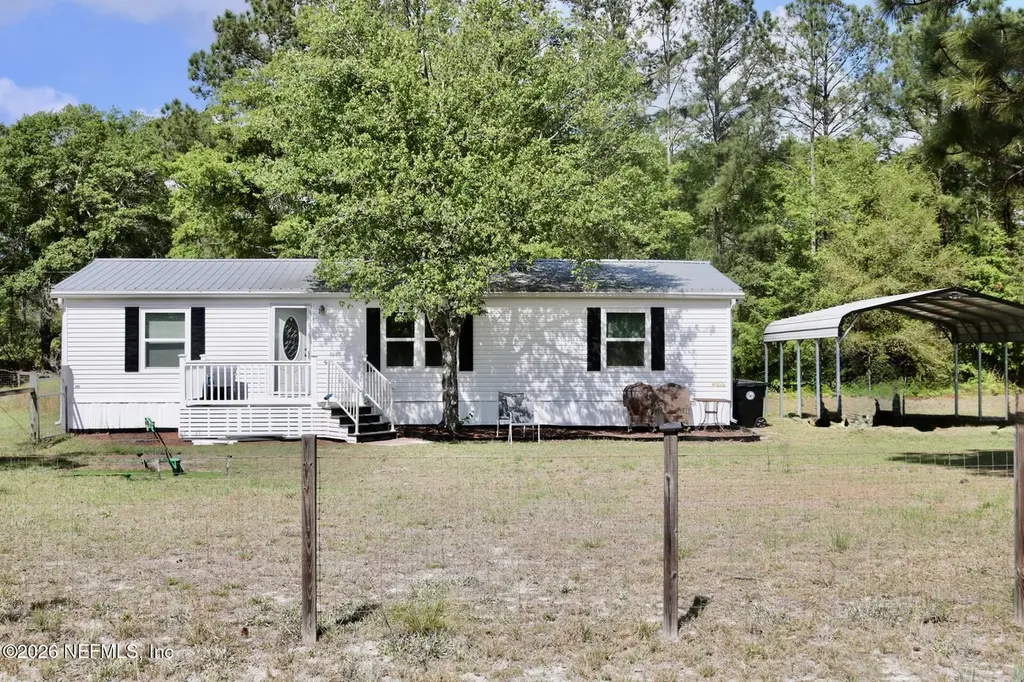
4710 Cattail St · Middleburg, FL
Flood risk 1/10 · Minimal
- FEMA flood zone
- X (unshaded)
- Chance of flooding over 30 yrs
- 0.0%
- Est. flood insurance / yr
- $507 – $1,088
Fire risk 7/10 · Major
- Est. fire insurance / yr
- $947 – $1,759
Heat risk 8/10 · Major
- Hot days now (above 109°F)
- 7 days/yr
- Hot days in 30 yrs
- 19 days/yr
Wind risk 9/10 · Severe
- Chance of severe wind over 30 yrs
- 99.0%
Air-quality risk 3/10 · Minor
- Unhealthy air days now
- 3 days/yr
- Unhealthy air days in 30 yrs
- 3 days/yr
Risk factors via First Street. Map © Google.
Why this score? — see what drove the D grade
The composite is a weighted blend of 9 inputs, each scored 0–100. Each bar is that input's sub-score; the figure is the points it added to the 100-point composite (weight × sub-score).
- Cash flow +19.4/30.0
- DSCR +6.1/10.0
- Schools +5.1/10.0
- 1% rule +3.8/10.0
- Rent growth +3.3/5.0
- Livability +3.2/5.0
- Condition / age +2.5/5.0
- ARV discount +0.0/15.0
- Appreciation +0.0/10.0
$225,000
🖨 Deal sheet 📄 Offer letter ✓ Due diligence
Listing remarks MLS
LARGE CORNER LOT - APPROXIMATELY 1.14 ACRE LOT ON PAVED ROAD! Double wide mobile home with greatroom, large kitchen with stove, dishwasher & microwave, dining area and shed for storage outside. See attachment for PAS requirements and WFHM offer submittal information in MLS document section. Refrigerator being removed from property.
Key facts
- Paved road
- Metal roof
- Acre of land
Tags
Property features AI
Finance
- HOA & community: Not a senior community
Exterior
- Parking: 2-space carport
- Utilities: Septic tank; Cable available; Sewer connected; Water connected
- Home design: Double wide mobile home; Single-story
- Exterior features: Property attached; Lot approximately 1.14 acres
Interior
- Kitchen: Electric oven; Refrigerator
- Bedrooms: Three bedrooms, all on the main level
- Bathrooms: Two full bathrooms
- Heating & cooling: Central heating; Central air conditioning
- Interior features: Seven total rooms; Family room on the main level; Dining room on the main level
Neighborhood map
What this means for you Summary
Snapshot
- This is a 3-bed/2.0-bath manufactured listed at $225k.
Deal economics
- At list price, monthly cash flow is $250 ($3k/yr) — positive.
- The deal already cash-flows at list — no discount required.
- To meet the 1% rule (rent ≥ 1% of price), the offer needs to be $199k (11.6% below list).
- Recommended offer: $199k (11.6% below list) — sets the bar for 1% rule.
- Cap rate 7.6% vs local median 3.8% in Middleburg — top-decile yield for the area; either an underpriced asset or a hidden risk that comps aren't pricing in. Stress-test before assuming the spread holds.
Location & tenants
- Location reads 65/100 on livability (#657 in FL) — a middle-class / working-renter tenant base. Strengths: cost of living A+, housing A+; Watch: amenities F, commute F, health & safety F.
- Clay (suburban): math 58% / reading 59% proficiency, ranked #14 of 73 in FL (top 19%) — acceptable for families but not a draw, mixed tenant base, ~2y average lease.
- Market conditions: Rents rising (+3.4%/yr); 601 active listings in the ZIP; solid renter incomes; 1,876 units permitted in Clay County in 2024 (14 in 5+ unit buildings).
Forward outlook
- Local home prices are declining (-3.0%/yr); year-one equity from $2k of loan paydown is wiped out by about $7k of value loss. Plan a longer hold.
- Clay County population projected at +19% by 2050 — long-run rental-demand tailwind backs the buy-and-hold thesis.
Negotiation context
- It's been on market 37 days — a 3% lower offer ($218k) is reasonable based on typical stale-listing flexibility.
- 8 sale attempts since 22y ago with the ask held roughly flat each time — persistent listings suggest the price (not the market) is what's stuck; bring a comps-based counter.
- Current owner paid $27k; list at $225k implies a 736% gain — meaningful room to come down on a strong offer.
Risks & watch-outs
- Climate carrying-cost: severe wind risk, 99% chance of damaging wind over 30y; major wildfire risk; extreme-heat days projected 7→19/yr by 2055 (HVAC capex compounding) — expect insurance premiums to compound above CPI over the hold.
Questions for the listing agent
- It's been on market 37 days. Have you received any prior offers? Is the seller open to a 12% concession, seller financing, or rate buy-down credit?
- Is there a deadline driving the sale (1031 exchange, divorce, estate, relocation)? That informs how much negotiation room exists.
- Schools are B-rated — typically a magnet for longer-tenancy family renters. What's the average tenant stay here, and is there a school-zone premium baked into asking?
- The area grade is low — what's the realistic commute time and amenity access for the typical tenant pool here? Any planned neighborhood developments (good or bad) we should know about?
- What's the average days-on-market for RENTAL listings here right now (not sales)? A rising rental-DOM trend means longer vacancies and softer asking-rent achievability than the comps imply.
- What's the recent tenant-quality profile in this submarket — average credit score on applications, eviction rate, late-payment / NSF rate, and stable-employment percentage? A property-management company in the area should have these aggregated.
- How much new for-sale + rental construction is in the pipeline within 1–3 miles? Heavy new supply typically softens prices + rents 12–24 months out; constrained supply supports both.
Investment metrics
- 1% rule
- 0.88% ✗
- Cap rate
- 7.63%
- Cash-on-cash
- 4.77%
- DSCR
- 1.21
- GRM
- 9.4
CMA / ARV
- ARV (on-the-fly)
- $182,016
- Comps found
- 8
Show comp detail 8 sales within ~0.75 mi
| Address | Dist | Beds/Ba | Sqft | Sold | Price | $/sf | Match |
|---|---|---|---|---|---|---|---|
| 2291 Cornel Ct | 0.13mi | 3/2.0 | 1,120 (-3%) | 14mo | $225,000 | $201 | 77 |
| 2359 Indigo Ave | 0.32mi | 3/2.0 | 1,216 (+6%) | 14mo | $180,000 | $148 | 64 |
| 4731 Mayflower St | 0.32mi | 2/2.0 (-1) | 1,216 (+6%) | 10mo | $67,500 | $56 | 62 |
| 4766 Acacia St | 0.37mi | 3/2.0 | 1,280 (+11%) | 9mo | $165,000 | $129 | 57 |
| 4785 Peppergrass St | 0.30mi | 3/2.0 | 1,296 (+12%) | 10mo | $205,000 | $158 | 57 |
| 2312 Cosmos Ave | 0.73mi | 3/2.0 | 1,152 (0%) | 13mo | $148,900 | $129 | 55 |
| 4570 Mayflower St | 0.56mi | 3/2.0 | 1,288 (+12%) | 1mo | $215,000 | $167 | 54 |
| 4542 Mayflower St | 0.72mi | 3/2.0 | 1,248 (+8%) | 22mo | $240,000 | $192 | 34 |
Match score weights: distance 35% · size 25% · config 20% · recency 20%. Top-matched comps best support the ARV.
Projected returns pro-forma
-3.0% appreciation · 3.35% rent growth · sell at horizon
- IRR
- -8.6%
- Equity multiple
- 0.68×
- Total profit
- $-19,922
- Equity at exit
- $33,548
- IRR
- 1.3%
- Equity multiple
- 1.09×
- Total profit
- $5,631
- Equity at exit
- $19,454
Cash invested: $63,000 (down + closing). Projections, not guarantees.
Landlord ↔ Tenant lean methodology
- Overall (STATE)
- 87 Strongly Landlord-Friendly
- State Florida
- 87 Strongly Landlord-Friendly · R+3
- County
- — inherits STATE
- City
- — inherits STATE
ZIP-level market 32068
- Home prices YoY
- -27.5%
- Rents YoY
- 3.4%
- Active inventory
- 601
- Price-to-rent
- 9.4×
Monthly cashflow live
- Estimated rent
- $1,989 medium interval (Pro) →
- Mortgage (P&I)
- −$1,180
- Tax from tax record
- −$47 /mo · $567/yr
- Insurance
- −$94
- HOA
- −$0
- Vacancy / Maint / Mgmt
- −$418
- Net cashflow
- $250
Break-even live
UW: 25.0% down · 7.5% · 30yr · 1.5% tax · 5.0% vac · 8.0% maint · 8.0% mgmt
Financing live
Cash to close
- Down payment
- $56,250
- Closing costs
- $6,750
- Reserves months
- —
- Total cash needed
- —
Loan-product check · same deal, 3 products live
Conventional
25% down · 7.5% · 30yr
- Down + closing
- —
- Monthly P&I
- —
- Monthly cashflow
- —
- DSCR
- —
- Eligible?
- —
Personal DTI + credit; lowest rate.
DSCR
20% down · 8.5% · 30yr
- Down + closing
- —
- Monthly P&I
- —
- Monthly cashflow
- —
- DSCR
- —
- Eligible?
- —
No personal income docs; deal must DSCR.
Hard money
10% down · 12.0% · 12mo
- Down + closing
- —
- Monthly P&I
- —
- Monthly cashflow
- —
- DSCR
- —
- Eligible?
- —
Short-term bridge; refi at stabilization.
Listing history 27 events
-
2026-06-07statusdays on market $225,000 Pending 37 DOM
-
2026-06-03days on market $225,000 Active 36 DOM
-
2026-06-02days on market $225,000 Active 35 DOM
-
2026-06-01days on market $225,000 Active 34 DOM
-
2026-05-31days on market $225,000 Active 33 DOM
-
2026-05-20status Active
-
2026-04-25status Pending
-
2026-04-20status Active
-
2026-04-18status Pending
-
2026-04-01$225,000 Active
-
2016-01-25soldstatus $26,900 Sold 339-char remark
Show marketing remark (339 chars)
LARGE CORNER LOT - APPROXIMATELY 1.14 ACRE LOT ON PAVED ROAD! Double wide mobile home with greatroom, large kitchen with stove, dishwasher & microwave, dining area and shed for storage outside. See attachment for PAS requirements and WFHM offer submittal information in MLS document section. Refrigerator being removed from property.
-
2015-12-04status Pending 339-char remark
Show marketing remark (339 chars)
LARGE CORNER LOT - APPROXIMATELY 1.14 ACRE LOT ON PAVED ROAD! Double wide mobile home with greatroom, large kitchen with stove, dishwasher & microwave, dining area and shed for storage outside. See attachment for PAS requirements and WFHM offer submittal information in MLS document section. Refrigerator being removed from property.
-
2015-10-27$24,900 Active 339-char remark
Show marketing remark (339 chars)
LARGE CORNER LOT - APPROXIMATELY 1.14 ACRE LOT ON PAVED ROAD! Double wide mobile home with greatroom, large kitchen with stove, dishwasher & microwave, dining area and shed for storage outside. See attachment for PAS requirements and WFHM offer submittal information in MLS document section. Refrigerator being removed from property.
-
2015-03-06status Pending 164-char remark
Show marketing remark (164 chars)
Land, privacy yet close to it all! With over an acre, there is room to spread out. Come see this great piece of land for yourself and make remake the home your way!
-
2015-03-06historical 164-char remark
Show marketing remark (164 chars)
Land, privacy yet close to it all! With over an acre, there is room to spread out. Come see this great piece of land for yourself and make remake the home your way!
-
2015-02-16$30,500 Active 164-char remark
Show marketing remark (164 chars)
Land, privacy yet close to it all! With over an acre, there is room to spread out. Come see this great piece of land for yourself and make remake the home your way!
-
2006-04-12soldstatus $86,800
-
2005-03-29soldstatus $72,900
-
2005-03-24historical
-
2005-03-21soldstatus $72,900
-
2005-02-28$72,900
-
2005-02-28soldstatus $60,000
-
2005-02-24historical
-
2005-02-23soldstatus $60,000
-
2005-01-24$69,900
-
2004-10-06historical
-
2004-04-06$74,500
ⓘ Source: listings_history table (triggers on properties + properties_extension) + one-shot
backfill from property_details.listing_events for pre-trigger history.
Tax reassessment forecast FL · Resets to sale price
- Current annual tax
- $567 · $47/mo
- Projected year-2 tax
- $1,868 · $156/mo
- Expected delta
- +$1,300/yr (+$108/mo · 229.1%)
ⓘ Screening estimate from a state-policy table — verify with the county assessor before closing.
Climate risk First Street
- Flood 1/10 Low FEMA zone X (unshaded) · 0% chance over 30 yrs
- Wildfire 7/10 Severe
- Heat 8/10 Severe 7 d/yr ≥109°F today · 19 d/yr by 30 yrs out
- Wind 9/10 Extreme 99% chance of damaging wind over 30 yrs
- Air quality 3/10 Moderate 3 unhealthy d/yr today · 3 by 30 yrs out
Nearby sold comps map
Loading sold comps map…
Walkable amenities ~0.75 mi
Loading nearby amenities…
Taxation est. · year 1
- Rental income
- $23,869
- − Mortgage interest
- −$12,603
- − Property taxes
- −$567
- − Insurance
- −$1,125
- − Repairs & maintenance
- −$1,910
- − Management
- −$1,910
- − Depreciation
- −$6,545
- Taxable loss
- −$792
- Est. tax savings @ 24.0%
- +$190
- After-tax cash flow
- $3,195/yr
For passive investors: Depreciation is non-cash, so a rental often shows a tax loss while cash-flowing — sheltering income. Rental losses are passive: they offset passive income freely, and up to $25,000/yr can offset ordinary (W-2) income if you actively participate and your MAGI is under $100k (phasing out to $0 by $150k); unused losses carry forward. On sale, claimed depreciation is recaptured at up to 25%, and gains may owe capital-gains tax (a 1031 exchange can defer both). Figures are a year-1 estimate at your 24.0% rate — not tax advice; consult a CPA.
Schools (NCES district)
- District
- Clay
- NCES district ID
- 1200300
- Math proficiency
- 58% ▼ -8.00%
- Reading proficiency
- 59% ▼ -3.00%
- Median HH income
- $59,379
- Composite
- 50.73/100
- National rank
- #1815
- State rank
- #14 of 73 in FL
Livability — Middleburg
- Score
- 65/100
- State rank
- #657
- US rank
- #13174
Category grades
Schools grade is shown separately in the Schools card above.
Census & demographics
- Census place
- Middleburg, FL
- County
- Clay County · 208,450 people
- City population
- 58,983
- Metro
- Jacksonville, FL
- Population (ZIP)
- 58,983
- Household income
- $84,431
- Rent vs Own
- Severe rent burden
- 975.0
Population outlook (Clay County) Hauer SSP2
- Today (2025)
- 230,495 people
- By 2030
- 242,427 · +5.2%
- By 2040
- 262,244 · +13.8%
- By 2050
- 275,148 · +19.4%
- By 2075
- 295,397 · +28.2%
- By 2100
- 287,592 · +24.8%
Race, ethnicity, and origin ACS 2023
- Neighborhood character
- Predominantly White (74%)
- Race & ethnicity
- White 74% Hispanic / Latino 13% Two or more races 10% Black 7%
- Hispanic origin (detail)
- Mexican 2% Puerto Rican 5%
- Common ancestry
- Slovak 2% Romanian 2% Lithuanian 2%
- Foreign-born
- 7% · Canada, Jamaica
- Languages at home
- 87% English-only · Spanish 9% Arabic 1% German/W. Germanic 1%
Political lean MEDSL · Clay
- 2024 margin
- Solid R (+39.3) · D 29.9% · R 69.2%
- 2008→2024 swing
- +3.6pp toward D · 2008: -42.8pp · 2024: -39.3pp
- All cycles
- 2024: R+39.3 2020: R+37.1 2016: R+44.3 2012: R+45.8 2008: R+42.8
Not yet ingested
- Civics
- —
Market trends
- HPI YoY
- ▼ -115.99%
- Current HPI
- 305.2531
- Rent YoY
- ▲ 3.35%
- Metro
- Jacksonville, FL
- State GDP YoY
- ▲ 3.28%
- F500 in state
- 36
Industry mix (Fortune 500 HQ in FL)
| Industry | F500 HQs | Revenue |
|---|---|---|
| Industrial Technology | 2 | $29B |
|
||
| Insurance | 2 | $17B |
|
||
| Retail | 1 | $60B |
|
||
| Technology Distribution | 1 | $58B |
|
||
| Homebuilding | 1 | $35B |
|
||
| Technology Manufacturing | 1 | $35B |
|
||
Price history
+202.0% since first listed22 events — show timeline
- 2026-05-20 Relisted — realMLS
- 2026-04-25 Pending — realMLS
- 2026-04-20 Relisted — realMLS
- 2026-04-18 Pending — realMLS
- 2026-04-01 Listed $225,000 realMLS
- 2016-01-25 Sold (MLS) $26,900 realMLS
- 2015-12-04 Pending — realMLS
- 2015-10-27 Listed $24,900 realMLS
- 2015-03-06 Pending — realMLS
- 2015-03-06 Listing Removed — realMLS
- 2015-02-16 Listed $30,500 realMLS
- 2006-04-12 Sold (Public Records) $86,800 Public Records
- 2005-03-29 Sold (Public Records) $72,900 Public Records
- 2005-03-24 Listing Removed — realMLS
- 2005-03-21 Sold (MLS) $72,900 realMLS
- 2005-02-28 Sold (Public Records) $60,000 Public Records
- 2005-02-28 Listed $72,900 realMLS
- 2005-02-24 Listing Removed — realMLS
- 2005-02-23 Sold (MLS) $60,000 realMLS
- 2005-01-24 Listed $69,900 realMLS
- 2004-10-06 Listing Removed — realMLS
- 2004-04-06 Listed $74,500 realMLS
Property tax history
-5.4%/yrLatest (2025): $567 · +2.2% YoY. Source: county tax records.
Cash-flow waterfall
monthlySold comps — $/sqft
last 12 mo · ≤1 miLoading sold comps…