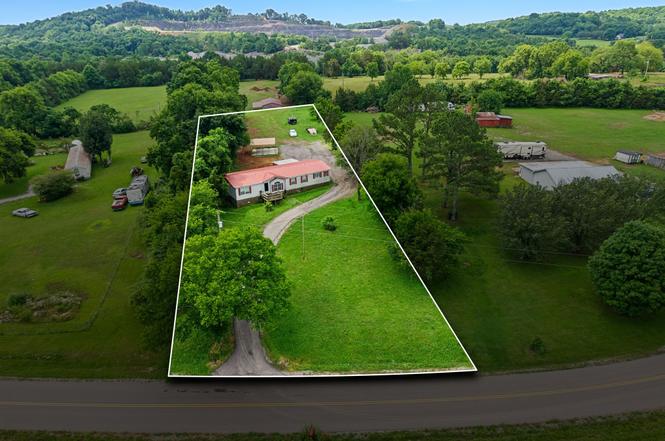
19 Clark Mill Rd · Fayetteville, TN
Flood risk 1/10 · Minimal
- FEMA flood zone
- X (unshaded)
- Chance of flooding over 30 yrs
- 0.0%
- Est. flood insurance / yr
- $507 – $1,088
Fire risk 5/10 · Moderate
- Est. fire insurance / yr
- $949 – $1,763
Heat risk 5/10 · Moderate
- Hot days now (above 105°F)
- 7 days/yr
- Hot days in 30 yrs
- 20 days/yr
Wind risk 4/10 · Minor
- Chance of severe wind over 30 yrs
- 21.0%
Air-quality risk 1/10 · Minimal
- Unhealthy air days now
- 0 days/yr
- Unhealthy air days in 30 yrs
- 0 days/yr
Risk factors via First Street. Map © Google.
Why this score? — see what drove the C grade
The composite is a weighted blend of 9 inputs, each scored 0–100. Each bar is that input's sub-score; the figure is the points it added to the 100-point composite (weight × sub-score).
- Cash flow +25.0/30.0
- DSCR +8.2/10.0
- ARV discount +5.7/15.0
- 1% rule +5.3/10.0
- Livability +3.2/5.0
- Schools +3.1/10.0
- Rent growth +2.5/5.0
- Condition / age +2.5/5.0
- Appreciation +0.0/10.0
$140,000
🖨 Deal sheet 📄 Offer letter ✓ Due diligence
Listing remarks
Opportunity is knocking on this 3-bedroom, 2-bathroom manufactured home offering 1,795 square feet of living space on a gorgeous 1.05-acre lot in Fayetteville. While the home does need some work, it's a perfect canvas for a buyer ready to add their own touches and build instant equity — whether you're an investor, a first-time buyer, or someone looking for an affordable place to call home in the country. The real showstopper here is the land: a beautiful, level lot with plenty of room to spread out, garden, or simply enjoy the peace and privacy of rural Tennessee living. Bring your vision and a little elbow grease, and turn this property into something special. For buyers dreaming big
Key facts
- Workshop space
- 1.05-acre lot
- Level lot
Tags
Property features AI
Finance
- Other: Lot about 1.04 acres; Living area approximately 1,770 sq ft; Assessor listed measurements and sources
Exterior
- Parking: Detached carport (2 covered/carport spaces, total 2 parking spaces)
- Utilities: Public water; Septic sewer
- Home design: Residential mobile home; Single-story
- Construction: Vinyl siding
- Exterior features: Public water available; Septic tank
Interior
- Kitchen: Dishwasher
- Bedrooms: 3 bedrooms (all on the main level)
- Flooring: Carpet; Vinyl
- Bathrooms: 2 full bathrooms
- Heating & cooling: Central heating; Central air conditioning
- Interior features: Dishwasher
Neighborhood map
What this means for you Summary
Snapshot
- This is a 3-bed/2.0-bath manufactured listed at $140k.
Deal economics
- At list price, monthly cash flow is $307 ($4k/yr) — positive.
- The deal already cash-flows at list — no discount required.
- Meets the 1% rule at list price ($1k rent vs $140k).
- Cap rate 8.9% vs local median 2.9% in Fayetteville — top-decile yield for the area; either an underpriced asset or a hidden risk that comps aren't pricing in. Stress-test before assuming the spread holds.
Location & tenants
- Location reads 63/100 on livability (#204 in TN) — a middle-class / working-renter tenant base. Strengths: cost of living A+, housing A+; Watch: crime F, amenities F, commute F.
- Lincoln County (rural): math 35% / reading 37% proficiency, ranked #24 of 139 in TN (top 17%) — families likely to look elsewhere, expect single-tenant / working-renter base with shorter leases.
- Zoned schools: Unity School (math 31% / reading 36%, grade F, #354 of 952 statewide, top 38%, 436 students, 0% FRL); Lincoln County High School (math 15% / reading 47%, grade F, #72 of 332 statewide, top 21%, 1,201 students, 0% FRL) — zoned schools average 0% FRL vs 46% district-wide (46 pts lower); this property's tenant base skews higher-income than the district average.
- Market conditions: 188 active listings in the ZIP; 173 units permitted in Lincoln County in 2024 (0 in 5+ unit buildings).
Forward outlook
- Local home prices are declining (-3.0%/yr); year-one equity from $968 of loan paydown is wiped out by about $4k of value loss. Plan a longer hold.
- Lincoln County population projected to shrink 3% by 2050 — rents likely to lag national; underwrite the cash flow, not the appreciation.
Negotiation context
- Only 2 days on market — expect competitive offers; lowballing is unlikely to land.
- 7 sale attempts with the ask held roughly flat each time — persistent listings suggest the price (not the market) is what's stuck; bring a comps-based counter.
- Current owner paid $80k; list at $140k implies a 75% gain — meaningful room to come down on a strong offer.
Risks & watch-outs
- Climate carrying-cost: moderate wildfire risk; extreme-heat days projected 7→20/yr by 2055 (HVAC capex compounding) — expect insurance premiums to compound above CPI over the hold.
Questions for the listing agent
- Is there a deadline driving the sale (1031 exchange, divorce, estate, relocation)? That informs how much negotiation room exists.
- Schools are D-rated, which usually means shorter tenancies and higher turnover. Who's the typical renter profile here, and what's been the actual vacancy rate?
- Crime grade is F in this area — have there been break-ins, vandalism, or insurance claims at this property in the last 3 years? What carrier currently insures it and at what premium?
- What's the average days-on-market for RENTAL listings here right now (not sales)? A rising rental-DOM trend means longer vacancies and softer asking-rent achievability than the comps imply.
- What's the recent tenant-quality profile in this submarket — average credit score on applications, eviction rate, late-payment / NSF rate, and stable-employment percentage? A property-management company in the area should have these aggregated.
- How much new for-sale + rental construction is in the pipeline within 1–3 miles? Heavy new supply typically softens prices + rents 12–24 months out; constrained supply supports both.
Investment metrics
- 1% rule
- 1.03% ✓
- Cap rate
- 8.92%
- Cash-on-cash
- 9.39%
- DSCR
- 1.42
- GRM
- 8.1
CMA / ARV
- ARV (on-the-fly)
- $134,520
- Comps found
- 1
Show comp detail 1 sale within ~0.75 mi
| Address | Dist | Beds/Ba | Sqft | Sold | Price | $/sf | Match |
|---|---|---|---|---|---|---|---|
| 34 Warden Rd | 0.70mi | 3/3.0 | 1,584 (-10%) | 23mo | $120,000 | $76 | 27 |
Match score weights: distance 35% · size 25% · config 20% · recency 20%. Top-matched comps best support the ARV.
Projected returns pro-forma
-3.0% appreciation · 3.0% rent growth · sell at horizon
- IRR
- -2.2%
- Equity multiple
- 0.92×
- Total profit
- $-3,215
- Equity at exit
- $20,874
- IRR
- 7.5%
- Equity multiple
- 1.56×
- Total profit
- $22,108
- Equity at exit
- $12,105
Cash invested: $39,200 (down + closing). Projections, not guarantees.
Landlord ↔ Tenant lean methodology
- Overall (STATE)
- 87 Strongly Landlord-Friendly
- State Tennessee
- 87 Strongly Landlord-Friendly · R+13
- County
- — inherits STATE
- City
- — inherits STATE
ZIP-level market 37334
- Home prices YoY
- -16.9%
- Active inventory
- 188
- Price-to-rent
- 8.1×
Monthly cashflow live
- Estimated rent
- $1,446 medium interval (Pro) →
- Mortgage (P&I)
- −$734
- Tax from tax record
- −$43 /mo · $517/yr
- Insurance
- −$58
- HOA
- −$0
- Vacancy / Maint / Mgmt
- −$304
- Net cashflow
- $307
Break-even live
UW: 25.0% down · 7.5% · 30yr · 1.5% tax · 5.0% vac · 8.0% maint · 8.0% mgmt
Financing live
Cash to close
- Down payment
- $35,000
- Closing costs
- $4,200
- Reserves months
- —
- Total cash needed
- —
Loan-product check · same deal, 3 products live
Conventional
25% down · 7.5% · 30yr
- Down + closing
- —
- Monthly P&I
- —
- Monthly cashflow
- —
- DSCR
- —
- Eligible?
- —
Personal DTI + credit; lowest rate.
DSCR
20% down · 8.5% · 30yr
- Down + closing
- —
- Monthly P&I
- —
- Monthly cashflow
- —
- DSCR
- —
- Eligible?
- —
No personal income docs; deal must DSCR.
Hard money
10% down · 12.0% · 12mo
- Down + closing
- —
- Monthly P&I
- —
- Monthly cashflow
- —
- DSCR
- —
- Eligible?
- —
Short-term bridge; refi at stabilization.
Listing history 3 events
-
2026-06-18days on market $140,000 Active 2 DOM
-
2026-06-16remarks 693-char remark
-
2026-06-16$140,000 Active 1 DOM
ⓘ Source: listings_history table (triggers on properties + properties_extension) + one-shot
backfill from property_details.listing_events for pre-trigger history.
Tax reassessment forecast TN · Resets to sale price
- Current annual tax
- $517 · $43/mo
- Projected year-2 tax
- $994 · $83/mo
- Expected delta
- +$477/yr (+$40/mo · 92.3%)
ⓘ Screening estimate from a state-policy table — verify with the county assessor before closing.
Climate risk First Street
- Flood 1/10 Low FEMA zone X (unshaded) · 0% chance over 30 yrs
- Wildfire 5/10 Major
- Heat 5/10 Major 7 d/yr ≥105°F today · 20 d/yr by 30 yrs out
- Wind 4/10 Moderate 21% chance of damaging wind over 30 yrs
- Air quality 1/10 Low 0 unhealthy d/yr today · 0 by 30 yrs out
Nearby sold comps map
Loading sold comps map…
Walkable amenities ~0.75 mi
Loading nearby amenities…
Taxation est. · year 1
- Rental income
- $17,350
- − Mortgage interest
- −$7,842
- − Property taxes
- −$517
- − Insurance
- −$700
- − Repairs & maintenance
- −$1,388
- − Management
- −$1,388
- − Depreciation
- −$4,073
- Taxable income
- $1,442
- Est. tax owed @ 24.0%
- −$346
- After-tax cash flow
- $3,334/yr
For passive investors: Depreciation is non-cash, so a rental often shows a tax loss while cash-flowing — sheltering income. Rental losses are passive: they offset passive income freely, and up to $25,000/yr can offset ordinary (W-2) income if you actively participate and your MAGI is under $100k (phasing out to $0 by $150k); unused losses carry forward. On sale, claimed depreciation is recaptured at up to 25%, and gains may owe capital-gains tax (a 1031 exchange can defer both). Figures are a year-1 estimate at your 24.0% rate — not tax advice; consult a CPA.
Schools (NCES district)
- District
- Lincoln County
- NCES district ID
- 4702490
- Math proficiency
- 35% ▼ -9.00%
- Reading proficiency
- 37% ▼ -2.00%
- Median HH income
- $44,692
- Composite
- 30.67/100
- National rank
- #6182
- State rank
- #24 of 139 in TN
Livability — Fayetteville
- Score
- 63/100
- State rank
- #204
- US rank
- #16029
Category grades
Schools grade is shown separately in the Schools card above.
Census & demographics
- City population
- 24,168
- Population (ZIP)
- 24,168
Population outlook (Lincoln County) Hauer SSP2
- Today (2025)
- 34,400 people
- By 2030
- 34,550 · +0.4%
- By 2040
- 34,345 · -0.2%
- By 2050
- 33,310 · -3.2%
- By 2075
- 30,199 · -12.2%
- By 2100
- 24,960 · -27.4%
Race, ethnicity, and origin ACS 2023
- Neighborhood character
- Predominantly White (82%)
- Race & ethnicity
- White 82% Black 8% Two or more races 6% Hispanic / Latino 5%
- Common ancestry
- Serbian 2% Italian 2% Slovak 2%
- Foreign-born
- 3% · Canada
- Languages at home
- 97% English-only · Spanish 2%
Political lean MEDSL · Lincoln
- 2024 margin
- Solid R (+64.6) · D 17.2% · R 81.9%
- 2008→2024 swing
- -22.5pp toward R · 2008: -42.2pp · 2024: -64.6pp
- All cycles
- 2024: R+64.6 2020: R+60.0 2016: R+59.0 2012: R+49.1 2008: R+42.2
Not yet ingested
- Civics
- —
Market trends
- HPI YoY
- ▼ -58.76%
- Current HPI
- 288.9104
- Rent YoY
- —
- Metro
- —
- State GDP YoY
- ▲ 2.78%
- F500 in state
- 22
Industry mix (Fortune 500 HQ in TN)
| Industry | F500 HQs | Revenue |
|---|---|---|
| Healthcare | 3 | $91B |
|
||
| Retail | 3 | $72B |
|
||
| Transportation / Logistics | 1 | $88B |
|
||
| Paper / Packaging | 1 | $19B |
|
||
| Insurance | 1 | $13B |
|
||
| Energy | 1 | $12B |
|
||
Price history
+161.2% since first listed14 events — show timeline
- 2026-06-16 Listed $140,000 REALTRACS as Distributed by MLS Grid
- 2026-05-19 Sold (Public Records) $80,000 Public Records
- 2025-12-16 Listing Removed — REALTRACS as Distributed by MLS Grid
- 2025-12-16 Listing Removed — REALTRACS as Distributed by MLS Grid
- 2025-12-12 Relisted — REALTRACS as Distributed by MLS Grid
- 2025-12-12 Relisted — REALTRACS as Distributed by MLS Grid
- 2025-11-21 Price Changed $275,000 REALTRACS as Distributed by MLS Grid
- 2025-11-20 Price Changed $275,000 REALTRACS as Distributed by MLS Grid
- 2025-11-17 Relisted — REALTRACS as Distributed by MLS Grid
- 2025-10-28 Listed $289,900 REALTRACS as Distributed by MLS Grid
- 2025-10-20 Listed $289,900 VMLS
- 2025-10-17 Listed $289,900 REALTRACS as Distributed by MLS Grid
- 2025-09-25 Coming Soon — REALTRACS as Distributed by MLS Grid
- 2004-06-18 Sold (Public Records) $53,600 Public Records
Property tax history
+3.8%/yrLatest (2025): $517 · -25.3% YoY. Source: county tax records.
Cash-flow waterfall
monthlySold comps — $/sqft
last 12 mo · ≤1 miLoading sold comps…